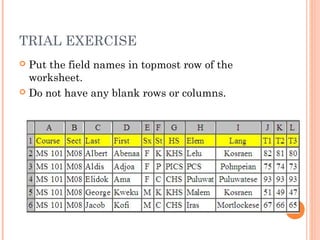
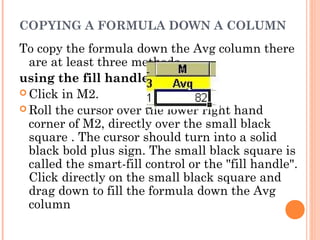
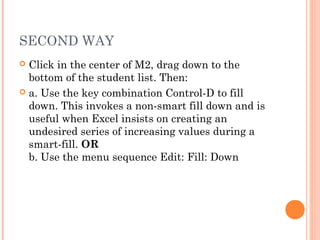
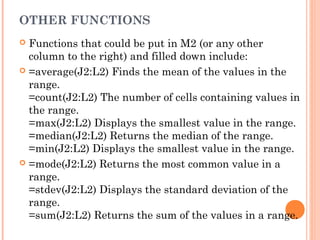
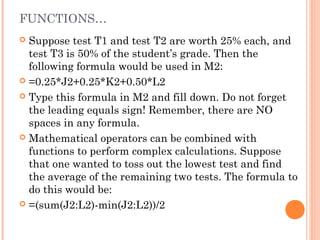
SPREADSHEETS
OBJECTIVES
 To Learn all features of spreadsheets
 To Understand spread sheets terminologies
 To Use of formulas
 To Use of functions
 To Learn data manipulation among others
INTRODUCTION TO SPREAD
SHEETS
• A modern spreadsheet file consists of multiple
worksheets (usually called by the shorter name
sheets) that make up one workbook, with each
file being one workbook.
Primary function of Spreadsheet
• Spreadsheet - Primary function is to perform
calculations that may involve mathematical,
financial, or scientific data.
TYPICAL USES FOR SPREADSHEETS
 Budgets
 ~ Financial/Accounting Reports
 ~ Taxes
 ~ Students' Grades
 ~ Columns of Text
 ~ Graphs
MICROSOFT EXCEL
• Microsoft Excel is a commercial spreadsheet application
written and distributed by Microsoft for Microsoft Windows and
Mac OS X.
It features calculation, graphing tools, pivot tables, and a macro
programming language called Visual Basic for Applications. It
has been a very widely applied spreadsheet for these platforms.
• MS. Excel is the program we use to work with spreadsheets.
• An Excel file consists of two parts:  worksheets and workbooks.
• Worksheets are the actual spreadsheets that contain the data in
which you can organize and manipulate.
• Workbooks are the entire Excel files.  Workbooks can have
multiple worksheets or as few as one.  Each worksheet in a
workbook will have a unique name that can be accessed on the
tabs at the bottom of the screen.
PARTS OF THE SPREADSHEET
~ Columns
• - Vertical areas of the spreadsheet
• - They are labeled A-Z, AA-AZ, BA-BZ, etc...
• - 256 Columns in MS Excel
~ Rows
• - Horizontal areas of the spreadsheet
• - Labeled Numerically 1…….65,536 Rows in MS
Excel
~ Cell
• - Rectangular area in which a row and column
intersect. Cells are specified by the intersection
of the column letter and row number such as F9.
DEFINITIONS
~ Cell Address
• - A description of which row and
column intersect to form the cell. Cell
A1 is the address for the first cell in
the first row and first column
~ Name Box
• - The area that displays the address
of the active cell
~ Formula Bar
• - The area that displays the contents
of the active cell. You may edit your
data here
• Ranges; which are a group of cells
specified by the address of the upper
left cell and lower right cell
separated by a full colon.
~ Active Cell
• - The selected cell with
the heavy border
around it
TRIAL EXERCISE
 Put the field names in topmost row of the
worksheet.
 Do not have any blank rows or columns.
SPREADSHEET FORMULAS
 * An instruction to calculate a number
 * The formula is entered in the cell where the
answer should appear
 * After you hit the "Enter" key, the answer is
displayed in the active cell while the formula
remains visible in the formula bar
ARITHMETIC OPERATIONS IN CELLS
 In the event that one needs to weight a cell
differently, arithmetic operators can be used
with cell addresses to accomplish this task.
The operators are:
 Addition +
 Multiplication * (shift-* asterisk on the
keyboard)
 Subtraction -
 Division /
 Exponentiation ^ (shift-6 on the keyboard)
*The four math operations are: + for add; - for
subtract; * for multiplication; / for divide
TWO RULES WHEN CREATING
FORMULAS:
 ~ A formula always starts with =
 ~ A formula uses cell addresses, not the values
themselves. (This way, if the values in the cell
locations change, the answer will automatically
change.)
 Eg =j1+L2
 values, such as 2, 9.14 or 6.67E-11;
 References to other cells, such as, A1 for a single cell
or B1:B3 for a range;
 arithmetic operators, such as +, -, *, /, and others;
 relational operators, such as >=, <, and others; and,
 Functions, such as SUM(), TAN(),MIN(),MAX() and
many others.
SPREADSHEET FUNCTIONS
 * Built-in formulas that perform special calculations
automatically.
 - Sum functions add up a column of figures.
 - Average functions average a group of numbers. 
(AVERAGE) eg =averagr(F2:H2) then press enter after
completing the formula.
 Note that there are NO spaces in a formula. The
average function averages all the cells from F2 to H2
is called a "range." A range includes all of the cells
between the cells. A range can be a portion of a row, a
portion of a column, or a rectangular area of a
spreadsheet.
 :
COPYING A FORMULA DOWN A COLUMN
To copy the formula down the Avg column there
are at least three methods
using the fill handle
 Click in M2.
 Roll the cursor over the lower right hand
corner of M2, directly over the small black
square . The cursor should turn into a solid
black bold plus sign. The small black square is
called the smart-fill control or the "fill handle".
Click directly on the small black square and
drag down to fill the formula down the Avg
column
SECOND WAY
 Click in the center of M2, drag down to the
bottom of the student list. Then:
 a. Use the key combination Control-D to fill
down. This invokes a non-smart fill down and is
useful when Excel insists on creating an
undesired series of increasing values during a
smart-fill. OR
b. Use the menu sequence Edit: Fill: Down
THIRD WAY
For those who prefer the keyboard:
 Click in the center of M2. Release the mouse
button. Hold down the shift key and use the
down arrow to select the portion of the Avg
column with the student list. Then:
 a. Use the key combination Control-D to fill
down. This invokes a non-smart fill down and is
useful when Excel insists on creating an
undesired series of increasing values during a
smart-fill.
 OR
b. Use the menu sequence Edit: Fill: Down
FUNCTIONS
 Count functions count all the blank spaces in
the range.
 - Minimum functions indicate the lowest value
in the range. (MIN)
 - Maximum functions indicate the highest
value in the range.  (MAX)
 - The IF STATEMENT is a logical function
which sets up a conditional statement to test
data.  the truth or falsity of the condition will
determine the results of the statement. 
 * Functions always start with =
 Functions are built in formulas that perform
special calculations automatically.
 * Functions may be used by itself or combined
with other functions.  Excel provides many
functions, some of which are used for
statistical and financial analysis, while others
are used in database operations.  A function
may be entered using the keyboard, the mouse
or a combination of both.  
 * Example:  to add cells=B2 + B3 + B4 + B5 +
B6 you could use the function:
 =SUM(B2:B:6)
OTHER FUNCTIONS
 Functions that could be put in M2 (or any other
column to the right) and filled down include:
 =average(J2:L2) Finds the mean of the values in the
range.
=count(J2:L2) The number of cells containing values in
the range.
=max(J2:L2) Displays the smallest value in the range.
=median(J2:L2) Returns the median of the range.
=min(J2:L2) Displays the smallest value in the range.
 =mode(J2:L2) Returns the most common value in a
range.
=stdev(J2:L2) Displays the standard deviation of the
range.
=sum(J2:L2) Returns the sum of the values in a range.
FUNCTIONS…
 Suppose test T1 and test T2 are worth 25% each, and
test T3 is 50% of the student’s grade. Then the
following formula would be used in M2:
 =0.25*J2+0.25*K2+0.50*L2
 Type this formula in M2 and fill down. Do not forget
the leading equals sign! Remember, there are NO
spaces in any formula.
 Mathematical operators can be combined with
functions to perform complex calculations. Suppose
that one wanted to toss out the lowest test and find
the average of the remaining two tests. The formula to
do this would be:
 =(sum(J2:L2)-min(J2:L2))/2
FUNCTIONS…
 Enter this formula into M2 and fill down.
 This formula would work for three tests, it could
be generalized to work for any number of tests
with the following formula:
 =(sum(J2:L2)-min(J2:L2))/(count(J2:L2)-1)
 Enter this formula into M2 and fill down. Be
careful when typing parentheses!

Spreadsheets[1]

  • 1.
  • 2.
    OBJECTIVES  To Learnall features of spreadsheets  To Understand spread sheets terminologies  To Use of formulas  To Use of functions  To Learn data manipulation among others
  • 3.
    INTRODUCTION TO SPREAD SHEETS •A modern spreadsheet file consists of multiple worksheets (usually called by the shorter name sheets) that make up one workbook, with each file being one workbook. Primary function of Spreadsheet • Spreadsheet - Primary function is to perform calculations that may involve mathematical, financial, or scientific data.
  • 4.
    TYPICAL USES FORSPREADSHEETS  Budgets  ~ Financial/Accounting Reports  ~ Taxes  ~ Students' Grades  ~ Columns of Text  ~ Graphs
  • 5.
    MICROSOFT EXCEL • MicrosoftExcel is a commercial spreadsheet application written and distributed by Microsoft for Microsoft Windows and Mac OS X. It features calculation, graphing tools, pivot tables, and a macro programming language called Visual Basic for Applications. It has been a very widely applied spreadsheet for these platforms. • MS. Excel is the program we use to work with spreadsheets. • An Excel file consists of two parts:  worksheets and workbooks. • Worksheets are the actual spreadsheets that contain the data in which you can organize and manipulate. • Workbooks are the entire Excel files.  Workbooks can have multiple worksheets or as few as one.  Each worksheet in a workbook will have a unique name that can be accessed on the tabs at the bottom of the screen.
  • 6.
    PARTS OF THESPREADSHEET ~ Columns • - Vertical areas of the spreadsheet • - They are labeled A-Z, AA-AZ, BA-BZ, etc... • - 256 Columns in MS Excel ~ Rows • - Horizontal areas of the spreadsheet • - Labeled Numerically 1…….65,536 Rows in MS Excel ~ Cell • - Rectangular area in which a row and column intersect. Cells are specified by the intersection of the column letter and row number such as F9.
  • 7.
    DEFINITIONS ~ Cell Address •- A description of which row and column intersect to form the cell. Cell A1 is the address for the first cell in the first row and first column ~ Name Box • - The area that displays the address of the active cell ~ Formula Bar • - The area that displays the contents of the active cell. You may edit your data here • Ranges; which are a group of cells specified by the address of the upper left cell and lower right cell separated by a full colon. ~ Active Cell • - The selected cell with the heavy border around it
  • 10.
    TRIAL EXERCISE  Putthe field names in topmost row of the worksheet.  Do not have any blank rows or columns.
  • 11.
    SPREADSHEET FORMULAS  *An instruction to calculate a number  * The formula is entered in the cell where the answer should appear  * After you hit the "Enter" key, the answer is displayed in the active cell while the formula remains visible in the formula bar
  • 12.
    ARITHMETIC OPERATIONS INCELLS  In the event that one needs to weight a cell differently, arithmetic operators can be used with cell addresses to accomplish this task. The operators are:  Addition +  Multiplication * (shift-* asterisk on the keyboard)  Subtraction -  Division /  Exponentiation ^ (shift-6 on the keyboard) *The four math operations are: + for add; - for subtract; * for multiplication; / for divide
  • 13.
    TWO RULES WHENCREATING FORMULAS:  ~ A formula always starts with =  ~ A formula uses cell addresses, not the values themselves. (This way, if the values in the cell locations change, the answer will automatically change.)  Eg =j1+L2
  • 14.
     values, suchas 2, 9.14 or 6.67E-11;  References to other cells, such as, A1 for a single cell or B1:B3 for a range;  arithmetic operators, such as +, -, *, /, and others;  relational operators, such as >=, <, and others; and,  Functions, such as SUM(), TAN(),MIN(),MAX() and many others.
  • 15.
    SPREADSHEET FUNCTIONS  *Built-in formulas that perform special calculations automatically.  - Sum functions add up a column of figures.  - Average functions average a group of numbers.  (AVERAGE) eg =averagr(F2:H2) then press enter after completing the formula.  Note that there are NO spaces in a formula. The average function averages all the cells from F2 to H2 is called a "range." A range includes all of the cells between the cells. A range can be a portion of a row, a portion of a column, or a rectangular area of a spreadsheet.  :
  • 16.
    COPYING A FORMULADOWN A COLUMN To copy the formula down the Avg column there are at least three methods using the fill handle  Click in M2.  Roll the cursor over the lower right hand corner of M2, directly over the small black square . The cursor should turn into a solid black bold plus sign. The small black square is called the smart-fill control or the "fill handle". Click directly on the small black square and drag down to fill the formula down the Avg column
  • 17.
    SECOND WAY  Clickin the center of M2, drag down to the bottom of the student list. Then:  a. Use the key combination Control-D to fill down. This invokes a non-smart fill down and is useful when Excel insists on creating an undesired series of increasing values during a smart-fill. OR b. Use the menu sequence Edit: Fill: Down
  • 18.
    THIRD WAY For thosewho prefer the keyboard:  Click in the center of M2. Release the mouse button. Hold down the shift key and use the down arrow to select the portion of the Avg column with the student list. Then:  a. Use the key combination Control-D to fill down. This invokes a non-smart fill down and is useful when Excel insists on creating an undesired series of increasing values during a smart-fill.  OR b. Use the menu sequence Edit: Fill: Down
  • 19.
    FUNCTIONS  Count functionscount all the blank spaces in the range.  - Minimum functions indicate the lowest value in the range. (MIN)  - Maximum functions indicate the highest value in the range.  (MAX)  - The IF STATEMENT is a logical function which sets up a conditional statement to test data.  the truth or falsity of the condition will determine the results of the statement.   * Functions always start with =
  • 20.
     Functions arebuilt in formulas that perform special calculations automatically.  * Functions may be used by itself or combined with other functions.  Excel provides many functions, some of which are used for statistical and financial analysis, while others are used in database operations.  A function may be entered using the keyboard, the mouse or a combination of both.    * Example:  to add cells=B2 + B3 + B4 + B5 + B6 you could use the function:  =SUM(B2:B:6)
  • 21.
    OTHER FUNCTIONS  Functionsthat could be put in M2 (or any other column to the right) and filled down include:  =average(J2:L2) Finds the mean of the values in the range. =count(J2:L2) The number of cells containing values in the range. =max(J2:L2) Displays the smallest value in the range. =median(J2:L2) Returns the median of the range. =min(J2:L2) Displays the smallest value in the range.  =mode(J2:L2) Returns the most common value in a range. =stdev(J2:L2) Displays the standard deviation of the range. =sum(J2:L2) Returns the sum of the values in a range.
  • 22.
    FUNCTIONS…  Suppose testT1 and test T2 are worth 25% each, and test T3 is 50% of the student’s grade. Then the following formula would be used in M2:  =0.25*J2+0.25*K2+0.50*L2  Type this formula in M2 and fill down. Do not forget the leading equals sign! Remember, there are NO spaces in any formula.  Mathematical operators can be combined with functions to perform complex calculations. Suppose that one wanted to toss out the lowest test and find the average of the remaining two tests. The formula to do this would be:  =(sum(J2:L2)-min(J2:L2))/2
  • 23.
    FUNCTIONS…  Enter thisformula into M2 and fill down.  This formula would work for three tests, it could be generalized to work for any number of tests with the following formula:  =(sum(J2:L2)-min(J2:L2))/(count(J2:L2)-1)  Enter this formula into M2 and fill down. Be careful when typing parentheses!