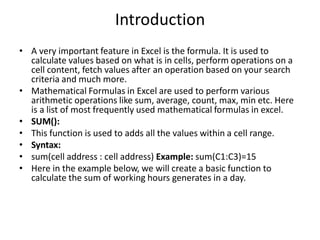
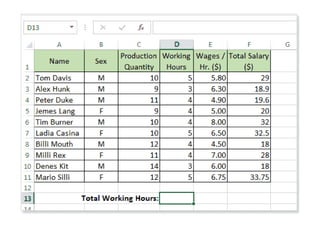
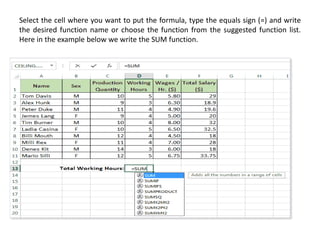
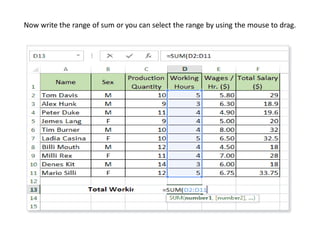
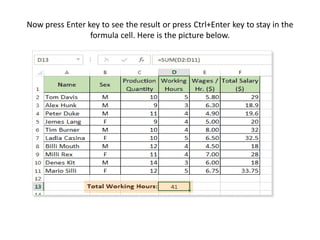
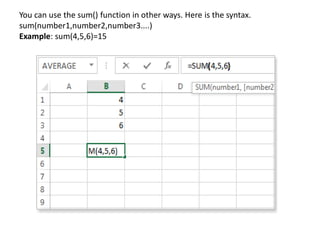
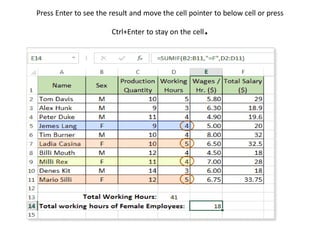
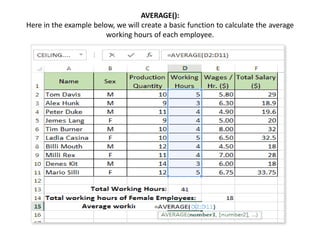
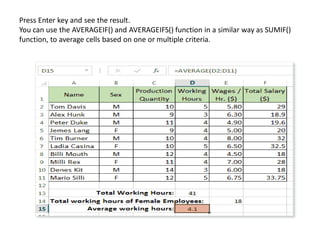
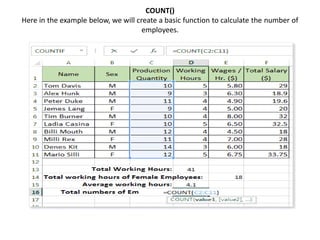
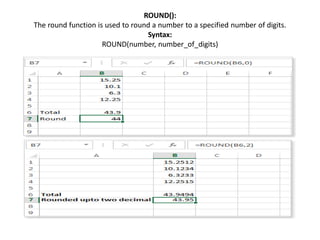
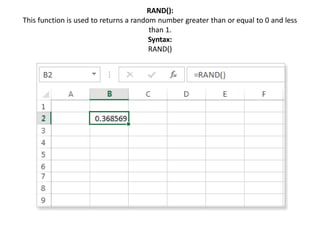
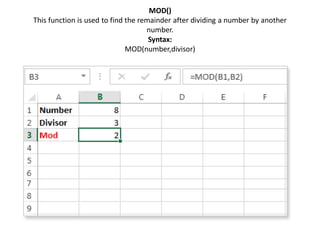
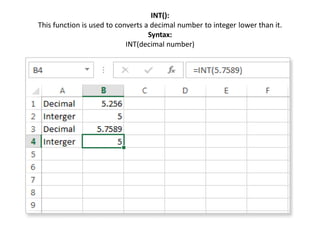
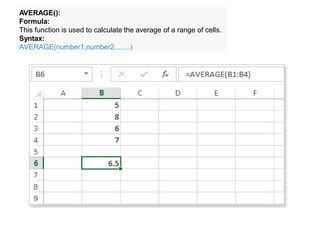
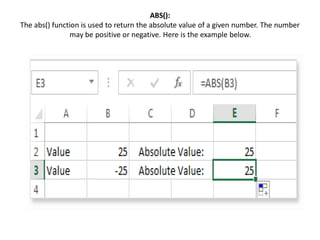
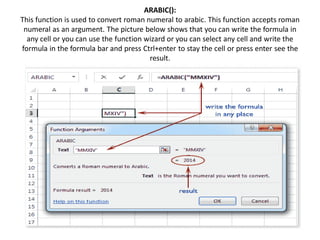
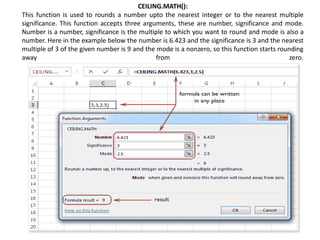
Mathematical functions in Excel are used to perform arithmetic operations like sum, average, count, max, min. The SUM function adds the values within a cell range. For example, SUM(C1:C3)=15 adds the values in cells C1 through C3. The AVERAGE function calculates the average of a range of cells. COUNT counts the number of cells that contain numbers. Other common functions include ROUND, RAND, MOD, INT, ABS, ARABIC, and CEILING.MATH.
Excel Tutorials - VLOOKUP and HLOOKUP FunctionsMerve Nur Taş
Excel Tutorials with screenshots.
Reference and lookup functions in Excel: How to use VLOOKUP and HLOOKUP functions. VLOOKUP function example.
MS Excel 2016 for Mac
Just some excel courses. Have fun and learn from basic to advance, to develope strong skills in operating Excel.
Microsoft Office Excel was never so easy to understand like now!
Want to learn more? Sign up to our course: http://bit.ly/excel2013course
This 4 step excel 2013 functions guide covers the fundamental aspects of using excel. It highlights and covers key components of excel for everyday usage and helps to enhance productivity with using excel.
Top 20 microsoft excel formulas you must knowAlexHenderson59
icrosoft Excel is one of the most popular data analysis tools in the world. A significant number of companies depend on MS Excel for calculation, analysis and visualization of data and information. Not many are taking full advantage of this simple yet powerful tool. We made a list of Top 20 Microsoft Excel Formulas you must know to become an Excel guru.
You can enter formulas in two ways, either directly into the cell itself, or at the input line. Either way, you need to start a formula with one of the following symbols: =, + or –. Starting with anything else causes the formula to be treated as if it were text.
Creating Formulas
Understanding Functions
Using regular expressions in functions
Using Pivot tables
The DataPilot dialog
As Europe's leading economic powerhouse and the fourth-largest hashtag#economy globally, Germany stands at the forefront of innovation and industrial might. Renowned for its precision engineering and high-tech sectors, Germany's economic structure is heavily supported by a robust service industry, accounting for approximately 68% of its GDP. This economic clout and strategic geopolitical stance position Germany as a focal point in the global cyber threat landscape.
In the face of escalating global tensions, particularly those emanating from geopolitical disputes with nations like hashtag#Russia and hashtag#China, hashtag#Germany has witnessed a significant uptick in targeted cyber operations. Our analysis indicates a marked increase in hashtag#cyberattack sophistication aimed at critical infrastructure and key industrial sectors. These attacks range from ransomware campaigns to hashtag#AdvancedPersistentThreats (hashtag#APTs), threatening national security and business integrity.
🔑 Key findings include:
🔍 Increased frequency and complexity of cyber threats.
🔍 Escalation of state-sponsored and criminally motivated cyber operations.
🔍 Active dark web exchanges of malicious tools and tactics.
Our comprehensive report delves into these challenges, using a blend of open-source and proprietary data collection techniques. By monitoring activity on critical networks and analyzing attack patterns, our team provides a detailed overview of the threats facing German entities.
This report aims to equip stakeholders across public and private sectors with the knowledge to enhance their defensive strategies, reduce exposure to cyber risks, and reinforce Germany's resilience against cyber threats.
Show drafts
volume_up
Empowering the Data Analytics Ecosystem: A Laser Focus on Value
The data analytics ecosystem thrives when every component functions at its peak, unlocking the true potential of data. Here's a laser focus on key areas for an empowered ecosystem:
1. Democratize Access, Not Data:
Granular Access Controls: Provide users with self-service tools tailored to their specific needs, preventing data overload and misuse.
Data Catalogs: Implement robust data catalogs for easy discovery and understanding of available data sources.
2. Foster Collaboration with Clear Roles:
Data Mesh Architecture: Break down data silos by creating a distributed data ownership model with clear ownership and responsibilities.
Collaborative Workspaces: Utilize interactive platforms where data scientists, analysts, and domain experts can work seamlessly together.
3. Leverage Advanced Analytics Strategically:
AI-powered Automation: Automate repetitive tasks like data cleaning and feature engineering, freeing up data talent for higher-level analysis.
Right-Tool Selection: Strategically choose the most effective advanced analytics techniques (e.g., AI, ML) based on specific business problems.
4. Prioritize Data Quality with Automation:
Automated Data Validation: Implement automated data quality checks to identify and rectify errors at the source, minimizing downstream issues.
Data Lineage Tracking: Track the flow of data throughout the ecosystem, ensuring transparency and facilitating root cause analysis for errors.
5. Cultivate a Data-Driven Mindset:
Metrics-Driven Performance Management: Align KPIs and performance metrics with data-driven insights to ensure actionable decision making.
Data Storytelling Workshops: Equip stakeholders with the skills to translate complex data findings into compelling narratives that drive action.
Benefits of a Precise Ecosystem:
Sharpened Focus: Precise access and clear roles ensure everyone works with the most relevant data, maximizing efficiency.
Actionable Insights: Strategic analytics and automated quality checks lead to more reliable and actionable data insights.
Continuous Improvement: Data-driven performance management fosters a culture of learning and continuous improvement.
Sustainable Growth: Empowered by data, organizations can make informed decisions to drive sustainable growth and innovation.
By focusing on these precise actions, organizations can create an empowered data analytics ecosystem that delivers real value by driving data-driven decisions and maximizing the return on their data investment.
Adjusting primitives for graph : SHORT REPORT / NOTESSubhajit Sahu
Graph algorithms, like PageRank Compressed Sparse Row (CSR) is an adjacency-list based graph representation that is
Multiply with different modes (map)
1. Performance of sequential execution based vs OpenMP based vector multiply.
2. Comparing various launch configs for CUDA based vector multiply.
Sum with different storage types (reduce)
1. Performance of vector element sum using float vs bfloat16 as the storage type.
Sum with different modes (reduce)
1. Performance of sequential execution based vs OpenMP based vector element sum.
2. Performance of memcpy vs in-place based CUDA based vector element sum.
3. Comparing various launch configs for CUDA based vector element sum (memcpy).
4. Comparing various launch configs for CUDA based vector element sum (in-place).
Sum with in-place strategies of CUDA mode (reduce)
1. Comparing various launch configs for CUDA based vector element sum (in-place).
2. Introduction
• A very important feature in Excel is the formula. It is used to
calculate values based on what is in cells, perform operations on a
cell content, fetch values after an operation based on your search
criteria and much more.
• Mathematical Formulas in Excel are used to perform various
arithmetic operations like sum, average, count, max, min etc. Here
is a list of most frequently used mathematical formulas in excel.
• SUM():
• This function is used to adds all the values within a cell range.
• Syntax:
• sum(cell address : cell address) Example: sum(C1:C3)=15
• Here in the example below, we will create a basic function to
calculate the sum of working hours generates in a day.
3.
4. Select the cell where you want to put the formula, type the equals sign (=) and write
the desired function name or choose the function from the suggested function list.
Here in the example below we write the SUM function.
5. Now write the range of sum or you can select the range by using the mouse to drag.
6. Now press Enter key to see the result or press Ctrl+Enter key to stay in the
formula cell. Here is the picture below.
7. You can use the sum() function in other ways. Here is the syntax.
sum(number1,number2,number3....)
Example: sum(4,5,6)=15
8. SUMIF():
Here in the example below, we will create a basic function to calculate
the sum of working hours generates in a day only for female employees.
10. Press Enter to see the result and move the cell pointer to below cell or press
Ctrl+Enter to stay on the cell.
11. AVERAGE():
Here in the example below, we will create a basic function to calculate the average
working hours of each employee.
12. Press Enter key and see the result.
You can use the AVERAGEIF() and AVERAGEIFS() function in a similar way as SUMIF()
function, to average cells based on one or multiple criteria.
13. COUNT()
Here in the example below, we will create a basic function to calculate the number of
employees.
14. ROUND():
The round function is used to round a number to a specified number of digits.
Syntax:
ROUND(number, number_of_digits)
15. RAND():
This function is used to returns a random number greater than or equal to 0 and less
than 1.
Syntax:
RAND()
16. MOD()
This function is used to find the remainder after dividing a number by another
number.
Syntax:
MOD(number,divisor)
17. INT():
This function is used to converts a decimal number to integer lower than it.
Syntax:
INT(decimal number)
19. ABS():
The abs() function is used to return the absolute value of a given number. The number
may be positive or negative. Here is the example below.
20. ARABIC():
This function is used to convert roman numeral to arabic. This function accepts roman
numeral as an argument. The picture below shows that you can write the formula in
any cell or you can use the function wizard or you can select any cell and write the
formula in the formula bar and press Ctrl+enter to stay the cell or press enter see the
result.
21. CEILING.MATH():
This function is used to rounds a number upto the nearest integer or to the nearest multiple
significance. This function accepts three arguments, these are number, significance and mode.
Number is a number, significance is the multiple to which you want to round and mode is also a
number. Here in the example below the number is 6.423 and the significance is 3 and the nearest
multiple of 3 of the given number is 9 and the mode is a nonzero, so this function starts rounding
away from zero.