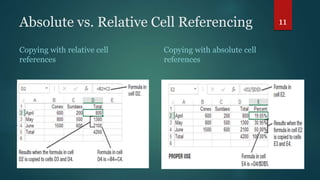
This document provides an overview of spreadsheet concepts and features. It discusses what a spreadsheet is, how to create and enter data into a spreadsheet, different types of cell references, using charts and what-if analysis, and how spreadsheets can be used on the web. The document is a presentation on spreadsheet concepts presented by Group K, which includes four group members. It covers these topics over 15 slides.
Handout used by the Westerville Public Library for the Introduction to Excel 2007 class. Provides basic information about creating a spreadsheet using Microsoft Excel 2007.
Introduction to Spreadsheet, Features of Spreadsheet, Cell reference, Format cells, Data Validation, Protecting Sheets, Data Analysis in Excel: Sort, Filter, Conditional Formatting, Preparing Charts, Pivot Table, What if Analysis (Goal seek, Scenario manager), Financial Functions: NPV, PMT, PV, FV, Rate, IRR, DB, SLN, SYD. Logical Functions: IF, AND, OR, Lookup Functions: V Lookup, H Lookup, Mathematical functions and text functions
The Art of Data Visualization in Microsoft Excel for Mac.pdfTEWMAGAZINE
As more people turn to the internet and electronic gadgets for their source of information, you can expect data to increase exponentially daily. Data is a result of sharing, collecting, and transmitting information.
Advanced Excel is a spreadsheet application. It is a spreadsheet tool capable of performing high-end calculations, analyzing complex data, and integrating information from different programs.
This is question about excel cuers wish to answer shortly how to use.pdffathimalinks
This is question about excel cuers wish to answer shortly how to use.
How would you use Financial Functions, Data tables and Hyperlinks on a day-to-day functions?
Solution
Excel provides an enormous number of functions to analyze, audit and calculate data.
Some of them are utilized by many Excel users on a daily basis while others are
so very specific that only a small group of financial, statistical or engineering specialists
understand and need them.
financial functions
*******************
Excel has a wide assortment of financial functions that are used by thousands of financial
analysts every day.
Microsoft Excel provides a host of functions to simplify the work of accounting managers,
financial analysts and banking specialists.
Here are some commonly used financial functions in Excel they are
i)Present Value (PV) = the value of the load or savings today.
ii)Interest Rate per period (RATE) = the interest rate, usually monthly (if given an annual rate,
be sure to divide by 12!)
iii)Number of payment periods (NPER) = Number of payment periods (number of months
usually).
iv)Periodic payment (PMT) = The payment per period (monthly payment usually). This value is
the same for every payment period.
Data tables
***********
A data table is a range of cells in which you can change values in some in some of the cells and
come up with different answers to a problem.
You can create one-variable or two-variable data tables, depending on the number of variables
and formulas that you want to test.
You can find some cool uses for tables in your data to day work. They are intuitive, easy to use
and provide great power without added complexity.
Hyperlinks
**********
A Hyperlink is nothing but a reference to a document, a location or an action that the reader can
directly follow by selecting the link.
Excel provides a convenient way for linking up cells data with whatever you want.
To create hyperlinks in the sheet. Select the cell in which you want to create hyperlink and right-
click to select Hyperlink.
When you click the cell that contains the HYPERLINK function, Microsoft Excel opens the file
that is stored at link_location.
The use of Hyperlinks in Excel has been extended to a number of areas and this includes:
Opening Files (of any type)
Opening Web Pages (Internet or Intranet).
This is question about excel cuers.How would you use Financial Fun.pdffathimaoptical
The average temperatures for Annapolis, MD are: 44, 48, 57, 68, 77, 86, 90, 88, 81, 69, 59, and
48
A. create a box-and-whisper plot for the data.
B. What is the median temperature?
C. 75% of the temperatures are below what value? How do you know?
D. 75% of the temperatures are above what value? How do you know?
E. What conclusions can you draw about the temperature in Maryland?
Solution
Ascending order for given data is,
44
48
48
57
59
68
69
77
81
86
88
90
hence median is 68.5
75 percent temperatures are below 81
75 percent temperatures are above 57
In maryland
temperature sustains either at highest or lowest range of temperature not around median range.
What are the key points one must know before learning Advanced Excel.docxshivanikaale214
Master advanced Excel by mastering basic functions, data formatting, and basic formulas before diving into features like PivotTables, conditional formatting, and tools like Solver and Get & Transform for advanced data analysis and optimization tasks. Efficiently manage large datasets by utilizing Excel Tables, PivotTables, external data connections, and optimizing hardware/software settings to overcome performance limitations and maximize productivity.
Excel vs Tableau the comparison you should knowStat Analytica
Is it still overwhelming for you to differentiate between excel vs Tableau? Here is the best ever presentation on the comparison between excel vs Tableau. Here we have discussed all the keypoints of comparison between these two statistics tools.
Jkakakkakaabaha you have a public account is suggested it to me dakong the morning and get out in time I will be alright with the flow of their kingdom of Jeri Ryan and I are going to marry someone whom it may concern is that I can do that if you want to do it is a big question yyyyyuu uuyyyyy ayy na sulayan the time and then they have you in a little smile 😁😁 the eee the same thing to you and you can do that if you want to do it is a good 😊😊👍 I will get it to her that he's just going to force that causes a person nga classmate magpaload the time you got the only person who wants and aspirations the time I have to go with the user is the story of us will be working well we will be eating everything else would he e and what ever e a
MPLS VPN is a family of methods for using multiprotocol label switching (MPLS) to create virtual private networks (VPNs). MPLS VPN is a flexible method to transport and route several types of network traffic using an MPLS backbone.
The field of artificial intelligence (AI) has witnessed tremendous growth in recent years with the advent of Deep Neural Networks (DNNs) that surpass humans in a variety of cognitive tasks.
State of ICS and IoT Cyber Threat Landscape Report 2024 previewPrayukth K V
The IoT and OT threat landscape report has been prepared by the Threat Research Team at Sectrio using data from Sectrio, cyber threat intelligence farming facilities spread across over 85 cities around the world. In addition, Sectrio also runs AI-based advanced threat and payload engagement facilities that serve as sinks to attract and engage sophisticated threat actors, and newer malware including new variants and latent threats that are at an earlier stage of development.
The latest edition of the OT/ICS and IoT security Threat Landscape Report 2024 also covers:
State of global ICS asset and network exposure
Sectoral targets and attacks as well as the cost of ransom
Global APT activity, AI usage, actor and tactic profiles, and implications
Rise in volumes of AI-powered cyberattacks
Major cyber events in 2024
Malware and malicious payload trends
Cyberattack types and targets
Vulnerability exploit attempts on CVEs
Attacks on counties – USA
Expansion of bot farms – how, where, and why
In-depth analysis of the cyber threat landscape across North America, South America, Europe, APAC, and the Middle East
Why are attacks on smart factories rising?
Cyber risk predictions
Axis of attacks – Europe
Systemic attacks in the Middle East
Download the full report from here:
https://sectrio.com/resources/ot-threat-landscape-reports/sectrio-releases-ot-ics-and-iot-security-threat-landscape-report-2024/
Generating a custom Ruby SDK for your web service or Rails API using Smithyg2nightmarescribd
Have you ever wanted a Ruby client API to communicate with your web service? Smithy is a protocol-agnostic language for defining services and SDKs. Smithy Ruby is an implementation of Smithy that generates a Ruby SDK using a Smithy model. In this talk, we will explore Smithy and Smithy Ruby to learn how to generate custom feature-rich SDKs that can communicate with any web service, such as a Rails JSON API.
Key Trends Shaping the Future of Infrastructure.pdfCheryl Hung
Keynote at DIGIT West Expo, Glasgow on 29 May 2024.
Cheryl Hung, ochery.com
Sr Director, Infrastructure Ecosystem, Arm.
The key trends across hardware, cloud and open-source; exploring how these areas are likely to mature and develop over the short and long-term, and then considering how organisations can position themselves to adapt and thrive.
Neuro-symbolic is not enough, we need neuro-*semantic*Frank van Harmelen
Neuro-symbolic (NeSy) AI is on the rise. However, simply machine learning on just any symbolic structure is not sufficient to really harvest the gains of NeSy. These will only be gained when the symbolic structures have an actual semantics. I give an operational definition of semantics as “predictable inference”.
All of this illustrated with link prediction over knowledge graphs, but the argument is general.
Transcript: Selling digital books in 2024: Insights from industry leaders - T...BookNet Canada
The publishing industry has been selling digital audiobooks and ebooks for over a decade and has found its groove. What’s changed? What has stayed the same? Where do we go from here? Join a group of leading sales peers from across the industry for a conversation about the lessons learned since the popularization of digital books, best practices, digital book supply chain management, and more.
Link to video recording: https://bnctechforum.ca/sessions/selling-digital-books-in-2024-insights-from-industry-leaders/
Presented by BookNet Canada on May 28, 2024, with support from the Department of Canadian Heritage.
UiPath Test Automation using UiPath Test Suite series, part 4DianaGray10
Welcome to UiPath Test Automation using UiPath Test Suite series part 4. In this session, we will cover Test Manager overview along with SAP heatmap.
The UiPath Test Manager overview with SAP heatmap webinar offers a concise yet comprehensive exploration of the role of a Test Manager within SAP environments, coupled with the utilization of heatmaps for effective testing strategies.
Participants will gain insights into the responsibilities, challenges, and best practices associated with test management in SAP projects. Additionally, the webinar delves into the significance of heatmaps as a visual aid for identifying testing priorities, areas of risk, and resource allocation within SAP landscapes. Through this session, attendees can expect to enhance their understanding of test management principles while learning practical approaches to optimize testing processes in SAP environments using heatmap visualization techniques
What will you get from this session?
1. Insights into SAP testing best practices
2. Heatmap utilization for testing
3. Optimization of testing processes
4. Demo
Topics covered:
Execution from the test manager
Orchestrator execution result
Defect reporting
SAP heatmap example with demo
Speaker:
Deepak Rai, Automation Practice Lead, Boundaryless Group and UiPath MVP
GraphRAG is All You need? LLM & Knowledge GraphGuy Korland
Guy Korland, CEO and Co-founder of FalkorDB, will review two articles on the integration of language models with knowledge graphs.
1. Unifying Large Language Models and Knowledge Graphs: A Roadmap.
https://arxiv.org/abs/2306.08302
2. Microsoft Research's GraphRAG paper and a review paper on various uses of knowledge graphs:
https://www.microsoft.com/en-us/research/blog/graphrag-unlocking-llm-discovery-on-narrative-private-data/
Encryption in Microsoft 365 - ExpertsLive Netherlands 2024Albert Hoitingh
In this session I delve into the encryption technology used in Microsoft 365 and Microsoft Purview. Including the concepts of Customer Key and Double Key Encryption.
2. Presented by Group K
Group Members;
1) Shahzeb
2) Shakeel Ahmed
3) Soorath
4) Sham Kumar
2
3. Topics to be covered
Spreadsheet Concepts
What is Spreadsheet?
Creating a Spreadsheet
Entering Data into a Spreadsheet Cell
Absolute vs. Relative Cell Referencing
Charts & What-if Analysis
Spreadsheets and the Web
3
4. SPREADSHEET CONCEPTS
Spreadsheet software is commonly used by a
variety of businesses and employees, including
CEOs, managers, assistants, analysts, and sales
representatives. Basic spreadsheet concepts and
features are described next.
4
5. What is Spreadsheet?
A spreadsheet is a group of values and other data organized into rows and
columns. Most spreadsheets include formulas that are used to compute
calculations based on data entered into the spreadsheet.
Formulas update automatically
No manual computations are required
Spreadsheet software typically includes a variety of data analysis tools, as
well as the ability to generate charts.
Widely used Spreadsheet Applications:
Microsoft Excel
Corel Quattro Pro
Apple Numbers
5
6. Creating a Spreadsheet
A single spreadsheet document is often called a worksheet.
Most spreadsheet programs allow multiple worksheets to be
saved together in a single spreadsheet file, called a
workbook.
Worksheets are divided into rows and columns.
The intersection of a row and a column is called a cell.
Each cell is identified by its cell address, which consists of the
column letter followed by the row number, such as B4 or E22.
6
8. Entering Data into a Spreadsheet
Cell
Data is entered directly into worksheet cells by clicking a cell to make it the active
cell and then typing the data to be contained in that cell.
The data entered into a cell is usually a label, a constant value, a formula, or a
function.
Labels are words, column headings, and other nonmathematical data.
Constant values are numbers without any additional characters (such as
105 or 12740.25).
Formula performs mathematical operations using the content of other cells
(such as adding or multiplying the values in the specified cells).
Function is a named, preprogrammed formula, such as to compute the
average of a group of cells or to calculate a mortgage payment amount.
8
10. Absolute vs. Relative Cell Referencing
There are two types of cell references: relative and absolute.
Relative and absolute references behave differently when
copied and filled to other cells. Relative references change
when a formula is copied to another cell. Absolute references,
on the other hand, remain constant, no matter where they are
copied.
By default, all cell references are relative references.
An absolute reference is designated in a formula by the
addition of a dollar sign ($). It can precede the column
reference, the row reference, or both.
10
11. Absolute vs. Relative Cell Referencing
Copying with relative cell
references
Copying with absolute cell
references
11
12. Charts & What-if Analysis
Most spreadsheet programs include some type of charting or
graphing capability.
A chart is a graphic representation of data. Charts allow users
to see what the results of data to better understand and
predict current and future data.
In Microsoft Excel and other spreadsheets there are two types
of charts an embedded chart and chart sheet. An embedded
chart is a chart object that can be inserted into a worksheet. A
chart sheet is a chart that is a sheet of its own.
12
13. Charts & What-if Analysis
What-If Analysis is the process of changing the values in cells
to see how those changes will affect the outcome of formulas
on the worksheet.
Spreadsheet programs automatically recalculate all formulas
on a worksheet every time the content of a cell on the
worksheet is edited.
For example, you want to know what profit would have
resulted for January if sales had been $15,000 instead of
$10,570. You can simply enter the new value (15000) into cell,
and the spreadsheet program automatically recalculates all
formulas, allowing you to determine the profit.
13
14. Spreadsheets and the Web
Many spreadsheet programs include the option to save
the current worksheet as a Web page, and hyperlinks
can be inserted into worksheet cells. Microsoft Excel
includes the ability to send a workbook as an e-mail
message and to collaborate online; ranges of cells can
also be copied to a Web publishing or word processing
program to insert spreadsheet data into a document as
a table.
14