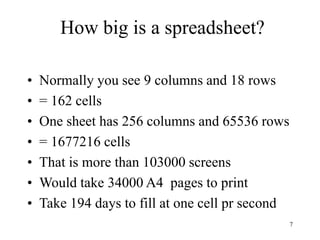
An electronic spreadsheet allows users to organize numbers in rows and columns to perform calculations. It can calculate budgets, do statistical analysis, and show diagrams and graphs. Spreadsheets offer advantages like exploring "what-if" scenarios and templates that save time. Key spreadsheet components include cells, formulas, functions, and charts. Statistical analysis tools in spreadsheets can calculate correlations and do regression. Careful planning and testing is needed when developing a spreadsheet.


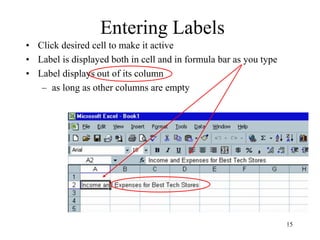


![18
Entering Values
• When entering numbers
– do not use commas
– numbers are right justified by default
• To proceed to next cell right use [Tab] or right
arrow key
• To proceed down, use [Enter] key](https://image.slidesharecdn.com/itv3-2-240225084809-18b758f7/85/Project-on-Electronic-Spreadsheets-for-Students-17-320.jpg)