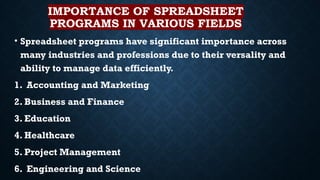
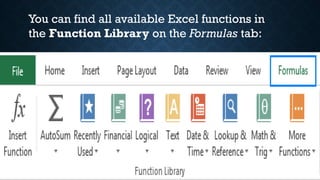
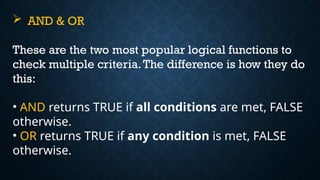
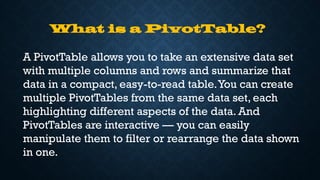
It's a question with multiple choices for somatic cells and reproductive system for somatic cells in the body of water separates the best advocates for somatic cell genetic engineering and technology and reproductive system and proteins are made of water separates the thoracic cavity filling up the week

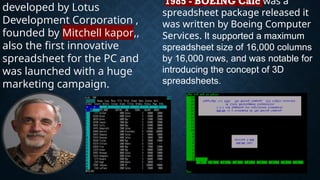


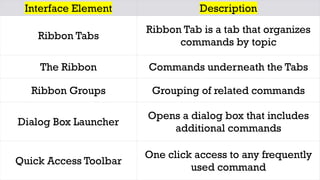


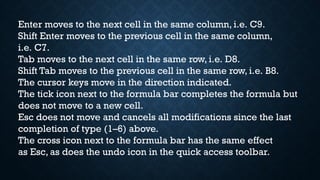
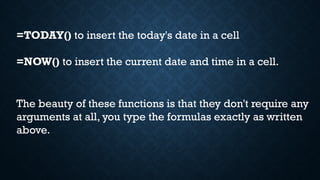
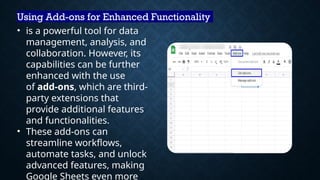
![10 Excel Basic Functions
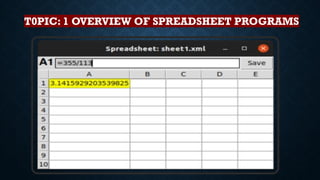
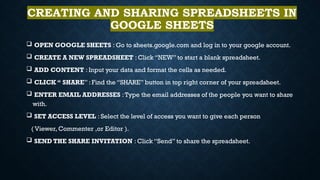
SUM
•The first Excel function you should be familiar with
is the one that performs the basic arithmetic
operation of addition:
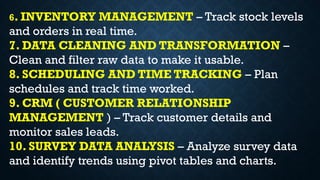
SUM(number1, [number2], …)](https://image.slidesharecdn.com/inbound8892906594451662013-250914061443-7b53cef7/85/inbound8892906594451662013-pptx-informatics-49-320.jpg)
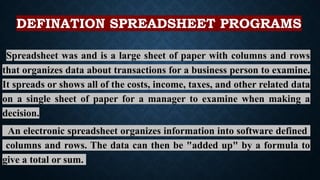
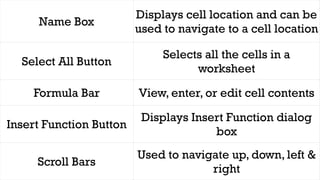
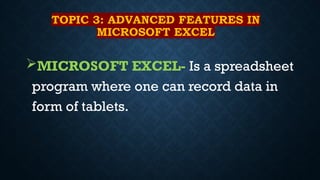
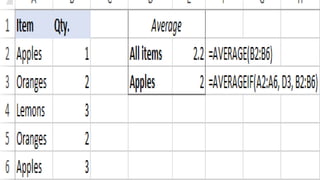
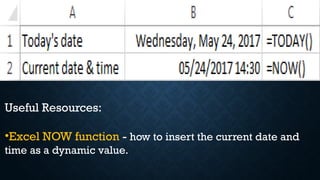
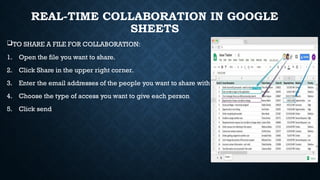
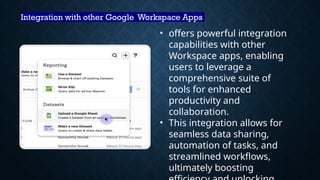
![AVERAGE
•The Excel AVERAGE function does exactly what its
name suggests, i.e. finds an average, or arithmetic
mean, of numbers. Its syntax is similar to SUM’s:
AVERAGE(number1, [number2], …)](https://image.slidesharecdn.com/inbound8892906594451662013-250914061443-7b53cef7/85/inbound8892906594451662013-pptx-informatics-53-320.jpg)
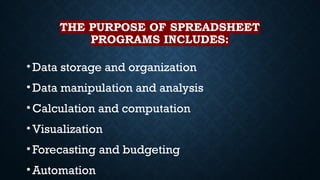
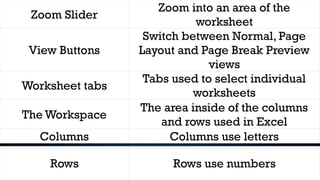
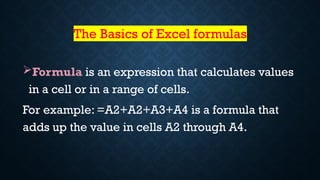
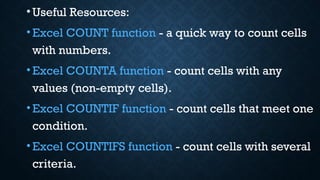
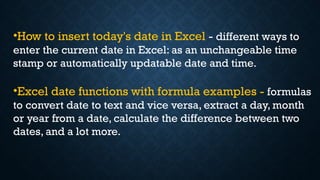
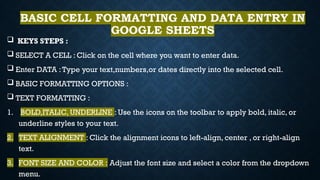
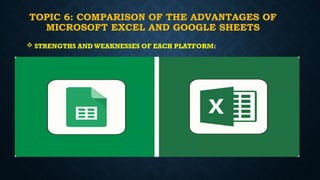
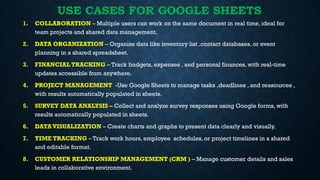
![COUNT & COUNTA
•If you are curious to know how many cells in a given
range contain numeric values (numbers or dates),
don't waste your time counting them by hand.The
Excel COUNT function will bring you the count in a
heartbeat:
COUNT(value1, [value2], …)](https://image.slidesharecdn.com/inbound8892906594451662013-250914061443-7b53cef7/85/inbound8892906594451662013-pptx-informatics-59-320.jpg)
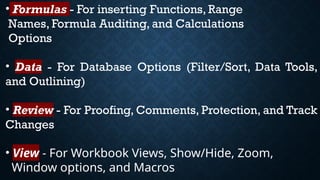
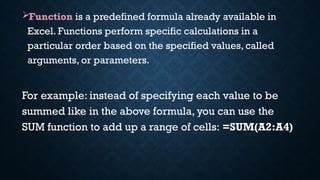
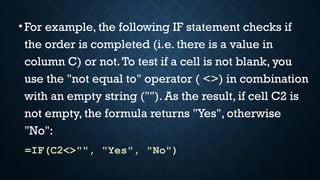
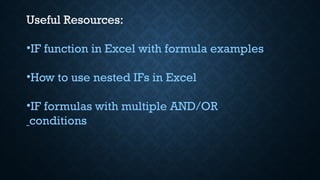
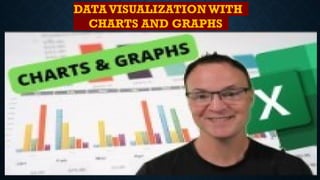
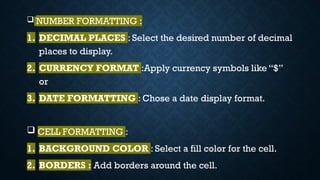
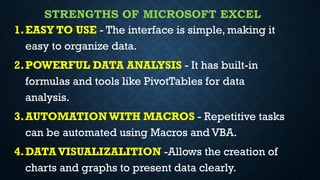
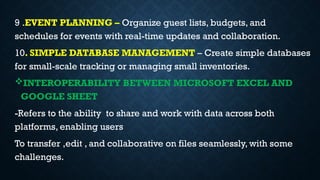
![IF
•Judging by the number of IF-related comments on
our blog, it's the most popular function in Excel. In
simple terms, you use an IF formula to ask Excel to
test a certain condition and return one value or
perform one calculation if the condition is met, and
another value or calculation if the condition is not
met:
IF(logical_test, [value_if_true], [value_if_false])](https://image.slidesharecdn.com/inbound8892906594451662013-250914061443-7b53cef7/85/inbound8892906594451662013-pptx-informatics-64-320.jpg)
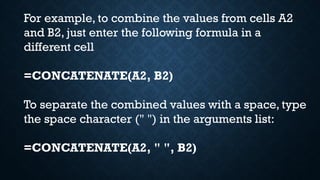
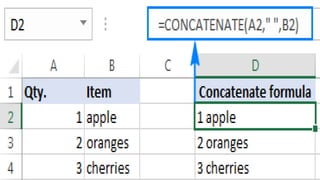
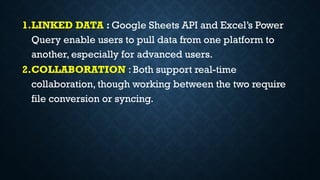
![ CONCATENATE
In case you want to take values from two or more
cells and combine them into one cell, use the
concatenate operator (&) or the CONCATENATE
function:
CONCATENATE(text1,[text2], …)](https://image.slidesharecdn.com/inbound8892906594451662013-250914061443-7b53cef7/85/inbound8892906594451662013-pptx-informatics-81-320.jpg)


![[DSC Europe 25] Mikhail Rozhkov - AI Product Canvas: From Business Goals to T...](https://cdn.slidesharecdn.com/ss_thumbnails/d53doddtpgfqivmzqel6-mikhail-rozhkov-ai-product-canvas-v1-260121115910-9dd517a7-thumbnail.jpg?width=640&height=640&fit=bounds)

![[DSC Europe 25] Milovan Jovicic - Beyond AI's Reach: The Enduring Value of Ev...](https://cdn.slidesharecdn.com/ss_thumbnails/pyeij0hurgwq5jugmtnv-2-milovan-jovicic-beyond-ais-reach-the-enduring-value-of-evergreen-design-v2-260120105856-d6ee57e5-thumbnail.jpg?width=640&height=640&fit=bounds)
![[DSC Europe 25] Srdj Stanisic - Local and Private AI in UX.pdf](https://cdn.slidesharecdn.com/ss_thumbnails/vwmetykqmztgmokmmkfa-3-srdjan-stanisic-local-and-small-ai-in-ux-260120105855-55a31869-thumbnail.jpg?width=640&height=640&fit=bounds)


![[DSC Europe 25] Laila Kakar - Leveraging AI for Strategic Excellence: Enhanci...](https://cdn.slidesharecdn.com/ss_thumbnails/eykmhrtsqmaaftwkexh7-dsc-lailakakar-1-260119101520-5f3b5616-thumbnail.jpg?width=640&height=640&fit=bounds)

![[DSC Europe 25] Dubravko Culibrk - Deep Learning for Mammography.pptx](https://cdn.slidesharecdn.com/ss_thumbnails/yiscimuktacgqoiu4dkp-deep-learning-for-mammography-260119121559-aad59182-thumbnail.jpg?width=640&height=640&fit=bounds)
![[DSC Europe 25] Josip Saban - Career building for data professionals.pptx](https://cdn.slidesharecdn.com/ss_thumbnails/zroflcttkm1vmli0txea-josip-saban-career-building-for-data-professionals-260123083019-587cdb8c-thumbnail.jpg?width=640&height=640&fit=bounds)
![[DSC Europe 25] Gordana Milutinovic Dumbelovic - From Insight to Oversight: A...](https://cdn.slidesharecdn.com/ss_thumbnails/t7dkjsfxqwwzceropjv4-gordana-milutinovicdumbelovic-from-insight-to-oversight-ai-driven-power-bi-moni-260119121559-9e0bf11b-thumbnail.jpg?width=640&height=640&fit=bounds)


![[DSC Europe 25] Tamas Srancsik - How To Teach Your AI Football? An Argument f...](https://cdn.slidesharecdn.com/ss_thumbnails/bcjh1m9xtbosv20ucftb-tamas-srancsik-how-to-teach-your-ai-football-260121115910-08b53e9e-thumbnail.jpg?width=640&height=640&fit=bounds)


