Download to read offline

![15
A mixed cell reference combines both relative
and absolute cell referencing
◦ Example: When you copy a formula, you may want
to change the row reference but keep the column
reference
◦ Created using the [F4] function key
Switch between displaying formulas and their
values on a worksheet by pressing
CTRL + ` (grave accent)
Do NOT adjust or format columns in Formula
View
See next slide for example](https://image.slidesharecdn.com/excel2007final-220405171433/85/Excel_2007_Final-pptx-15-320.jpg)
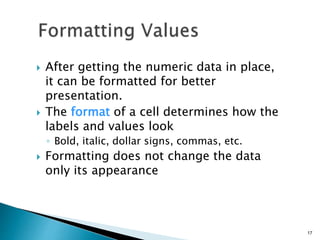

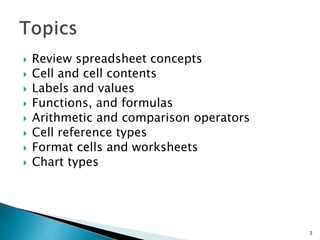
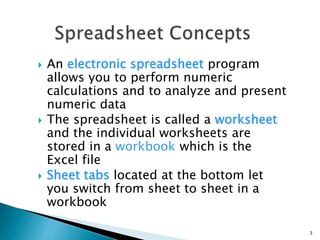
The document provides an overview of key concepts for working with spreadsheets in Excel, including spreadsheet components like cells, ranges, and worksheets; entering labels and values; using formulas and functions; formatting cells and worksheets; and creating different types of charts to visually represent numeric data. The summary covers the essential elements of working with Excel spreadsheets, such as entering data into cells, writing formulas, formatting cells and worksheets, and creating charts to analyze and present numeric data.