ITEC 1010 –Information and Organizations
Introduction to Spreadsheet
References:
[1] https://www.w3schools.com/excel/index.php
[2] https://cs101.wvu.edu/media/48360/Intro_Excel_FA12.ppt
2.
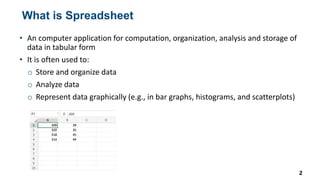
What is Spreadsheet
•An computer application for computation, organization, analysis and storage of
data in tabular form
• It is often used to:
o Store and organize data
o Analyze data
o Represent data graphically (e.g., in bar graphs, histograms, and scatterplots)
2
3.
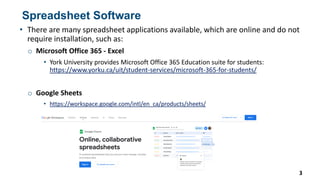
Spreadsheet Software
• Thereare many spreadsheet applications available, which are online and do not
require installation, such as:
o Microsoft Office 365 - Excel
• York University provides Microsoft Office 365 Education suite for students:
https://www.yorku.ca/uit/student-services/microsoft-365-for-students/
o Google Sheets
• https://workspace.google.com/intl/en_ca/products/sheets/
3
4.
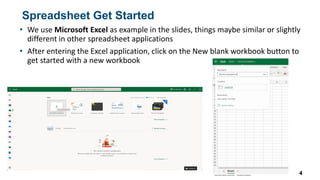
Spreadsheet Get Started
•We use Microsoft Excel as example in the slides, things maybe similar or slightly
different in other spreadsheet applications
• After entering the Excel application, click on the New blank workbook button to
get started with a new workbook
4
5.
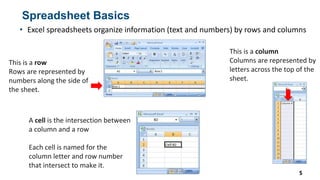
Spreadsheet Basics
• Excelspreadsheets organize information (text and numbers) by rows and columns
5
This is a row
Rows are represented by
numbers along the side of
the sheet.
This is a column
Columns are represented by
letters across the top of the
sheet.
A cell is the intersection between
a column and a row
Each cell is named for the
column letter and row number
that intersect to make it.
6.
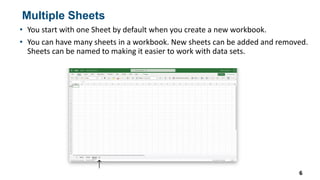
Multiple Sheets
• Youstart with one Sheet by default when you create a new workbook.
• You can have many sheets in a workbook. New sheets can be added and removed.
Sheets can be named to making it easier to work with data sets.
6
7.
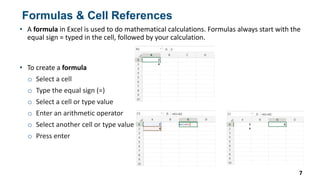
Formulas & CellReferences
• A formula in Excel is used to do mathematical calculations. Formulas always start with the
equal sign = typed in the cell, followed by your calculation.
7
• To create a formula
o Select a cell
o Type the equal sign (=)
o Select a cell or type value
o Enter an arithmetic operator
o Select another cell or type value
o Press enter
8.
Formulas & CellReferences
8
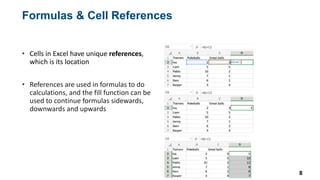
• Cells in Excel have unique references,
which is its location
• References are used in formulas to do
calculations, and the fill function can be
used to continue formulas sidewards,
downwards and upwards
9.
Functions
9
• Excel hasmany premade formulas, called functions
• Functions are typed by = and the functions name
• For example =SUM(A1:A5) is the sum up of cells from A1 to A5
• The range is always inside of parentheses
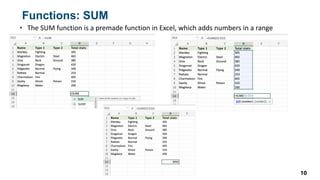
10.
Functions: SUM
• TheSUM function is a premade function in Excel, which adds numbers in a range
10
11.
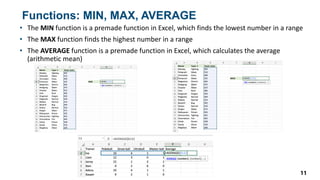
Functions: MIN, MAX,AVERAGE
• The MIN function is a premade function in Excel, which finds the lowest number in a range
• The MAX function finds the highest number in a range
• The AVERAGE function is a premade function in Excel, which calculates the average
(arithmetic mean)
11
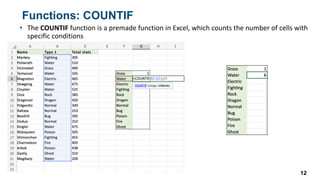
12.
Functions: COUNTIF
• TheCOUNTIF function is a premade function in Excel, which counts the number of cells with
specific conditions
12
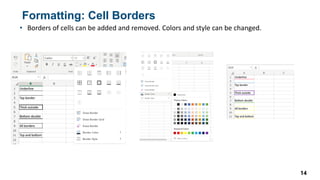
Formatting: Cell Borders
•Borders of cells can be added and removed. Colors and style can be changed.
14
15.
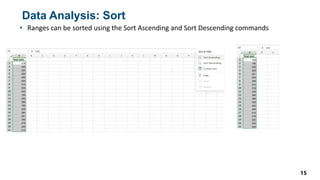
Data Analysis: Sort
•Ranges can be sorted using the Sort Ascending and Sort Descending commands
15
16.
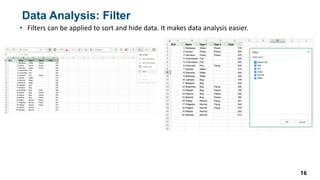
Data Analysis: Filter
•Filters can be applied to sort and hide data. It makes data analysis easier.
16
17.
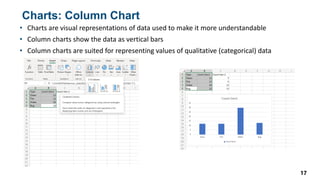
Charts: Column Chart
•Charts are visual representations of data used to make it more understandable
• Column charts show the data as vertical bars
• Column charts are suited for representing values of qualitative (categorical) data
17
18.
Charts: Line Chart
•Charts are visual representations of data used to make it more understandable
• Line charts show the data as a continuous line, which are typically used for showing trends
18
19.
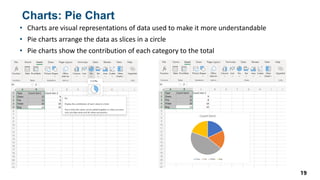
Charts: Pie Chart
•Charts are visual representations of data used to make it more understandable
• Pie charts arrange the data as slices in a circle
• Pie charts show the contribution of each category to the total
19
![ITEC 1010 – Information and Organizations
Introduction to Spreadsheet
References:
[1] https://www.w3schools.com/excel/index.php
[2] https://cs101.wvu.edu/media/48360/Intro_Excel_FA12.ppt](https://image.slidesharecdn.com/week10-introtospreadsheet-250901170437-b5066f00/85/ITEC-1010-Week-10-Intro-to-Spreadsheet-pdf-1-320.jpg)