Spectroscopy
•
2 likes•881 views

What is spectroscopy and how to measure the wavelength of light? Learn more about it in this presentation!
Report
Share
Report
Share
Download to read offline

Recommended
Basic introduction of FTIR
This document provides an overview of Fourier Transform Infrared Spectroscopy (FTIR). It defines key terms and outlines the history and development of FTIR. The basic principles of FTIR are explained, including how an interferometer splits light into two beams which undergo constructive and destructive interference. Key components of an FTIR instrument are described, such as the infrared source, beam splitter, fixed and moving mirrors, laser, and detectors. Thermal and photonic detectors are discussed. Finally, some applications of FTIR in forensics are highlighted.
Atomic absorption spectroscopy, History, atomization techniques, and instrume...
Atomic absorption spectroscopy, History, atomization techniques, and instrume...Muhammad Asif Shaheeen
History, principle, types, instrumentation, comparison with atomic emission spectroscopy, interference, advantages and disadvantages of different types of atomization techniques.Optical rotatory dispersion and circular dichroism
This document provides an overview of optical rotatory dispersion (ORD) and circular dichroism (CD). It defines these terms and discusses their fundamentals, including that ORD occurs at all wavelengths and measures differences in speed of left and right circularly polarized light, while CD only occurs at characteristic wavelengths and measures differences in absorption. It also describes the instrumentation used for ORD and CD measurements and some common applications, such as using CD to determine protein secondary structure.
Spectrophotometer instrumentation
A spectrophotometer uses monochromatic light to measure the absorbance of light by a sample, allowing identification and quantification of compounds. It works by passing light through a sample and measuring the intensity of transmitted light, using this to determine concentration according to the Beer-Lambert law. Key components include a light source, monochromator, sample cuvettes, and detectors, and it has various applications in qualitative and quantitative analysis of proteins, nucleic acids, and other biological compounds.
Spectrophotometry
Spectrophotometry is a method to measure how much a chemical substance absorbs light by measuring the intensity of light as a beam of light passes through sample solution. The basic principle is that each compound absorbs or transmits light over a certain range of wavelength
Principles of ftir
FTIR spectroscopy works by collecting an interferogram using an interferometer, then applying a Fourier transform to obtain the infrared spectrum. Radiation from a source is split into two beams that reflect between a fixed and moving mirror, recombining to produce an interferogram containing all infrared information. The Fourier transform converts this interferogram into a spectrum as a function of wavelength. FTIR has advantages over dispersive IR including faster measurement times as it collects all frequencies simultaneously, higher signal-to-noise ratios, and improved wavelength accuracy from calibration with a He-Ne laser.
Spectrophotometry: basic concepts, instrumentation and application
This document provides an overview of spectrophotometry, including basic concepts, instrumentation, and applications. It describes how spectrophotometers work by isolating specific wavelengths of light and measuring their absorption by a sample. The key relationship discussed is Beer's Law, which states that absorbance is directly proportional to concentration. Instrumentation components are also outlined, including light sources, monochromators for selecting wavelengths, and various methods for spectral isolation like filters, prisms and diffraction gratings.
Raman spectroscopy
This document provides an overview of Raman spectroscopy. It discusses the history and discovery of Raman scattering. The basic theory and classical description of Raman scattering from a diatomic molecule is explained. Factors that affect vibrational frequencies are outlined. The document also describes instrumentation components such as light sources, sample handling, filters, monochromators, detectors, and calibration standards. Variations of Raman spectroscopy including resonance Raman spectroscopy and surface-enhanced Raman spectroscopy are also summarized.
Atomic Absorption Techniques & Applications
The document discusses atomic absorption spectrometry (AAS) and its use in analyzing metals. It describes the basic components and process of AAS, including how samples are atomized in flames or graphite furnaces and the light absorption is measured. It also lists some common elements that are analyzed by AAS and applications in areas like environmental, food, and clinical testing.
Fluorescence Microscopy
Fluorescence microscopy uses fluorescence to visualize specimens. It works by exciting fluorescent molecules in the sample with high intensity light, causing them to emit light of a longer wavelength. This emitted light is then filtered and used to produce a magnified image of the sample. Modern fluorescence microscopes allow multiple fluorescence filters to be used, and fluorescent markers like dyes, proteins, and antibodies can be introduced to tag specific structures in cells or proteins of interest. This technique is widely used in medical and biological research to study structures and track molecules within living cells.
xray diffraction instrumentation
This document describes the key components and functioning of instrumentation used in x-ray diffraction. The main components are a radiation source like an x-ray tube, a collimator to narrow the beam, a monochromator to remove unwanted radiation, detectors like photographic film or counters, and associated electronics. X-ray tubes generate x-rays via the impact of electrons on a metal target. Collimators and monochromators shape and refine the x-ray beam before it interacts with the sample. Detectors then measure the diffraction pattern, with options including film, Geiger-Muller tubes, proportional counters, scintillators, and semiconductors.
Chemiluminescence, types of luminescent
Chemiluminescence is the production of light from a chemical reaction. Two chemicals react to form an excited intermediate state that releases energy in the form of photons as it returns to a stable ground state. This light emission occurs without much heat release. Chemiluminescent reactions can be grouped into chemical reactions using synthetic compounds, bioluminescent reactions from living organisms like fireflies, and electrochemiluminescent reactions involving electrical current. Forensic scientists use the chemiluminescent reaction of luminol to detect traces of blood at crime scenes by spraying a mixture that causes a blue glow in the presence of iron from hemoglobin.
Applications of uv visible spectroscopy
UV-visible spectroscopy involves measuring the absorption of light in the UV and visible light ranges. It is useful for determining conjugation and distinguishing between conjugated and non-conjugated compounds. It has applications in identifying unknown compounds, determining the extent of conjugation, and elucidating the structures of molecules like vitamins. It can also provide information about configuration, hydrogen bonding, molecular weight, and detect impurities. The Woodward-Fieser rules allow calculating the expected absorption maxima for certain functional groups.
Instrumentation of HPLC, principle by kk sahu
INTRODUCTION
Instrumentation of HPLC
TYPES OF HPLC
PARAMETERS
APPLICATION
CONCLUSION
REFERENCE
High-performance liquid chromatography ( HPLC) is a specific form of column chromatography generally used in biochemistry and analysis to separate, identify, and quantify the active compounds.
HPLC mainly utilizes a column that holds packing material (stationary phase), a pump that moves the mobile phase(s) through the column, and a detector that shows the retention times of the molecules.
Luminescence presentation
The document discusses different types of luminescence including bioluminescence used by deep sea organisms. It then describes how luminol is used by crime scene investigators to detect trace amounts of blood, even if cleaning products were used. Finally, it mentions green fluorescent protein (GFP) which was used to win the 2008 Nobel Prize in Chemistry and is now used in medical research to track proteins in diseases like cancer and Alzheimer's.
IR spectroscopy- Infra Red spectroscopy in details
This document provides an overview of infrared spectroscopy. It discusses how infrared spectroscopy can be used to analyze molecular vibrations and determine functional groups present in a molecule. The document outlines the basic principles of infrared spectroscopy, including how molecular vibrations absorb infrared radiation depending on factors like bond strength and atomic mass. It also summarizes typical infrared absorption regions and provides a chart of common functional group absorptions.
Flame photometry
Flame photometry is one of the method for analysis of drugs. Here we can get the principle, method, requirements and applications of flame photometry
Instrumentation of uv spectrophotometer pranav kumar singh
This document discusses the components and operation of a UV spectrophotometer. It describes the main components as the source, wavelength selector, sample container, detector, and readout. It provides details on common sources like deuterium arc lamps, tungsten lamps, and xenon arc lamps. It also discusses wavelength selector devices like monochromators and filters. The document outlines the applications of UV spectrophotometry in areas like detection of impurities, structure elucidation, and quantitative analysis. In under 3 sentences.
Introduction to UV-based detectors
UV-visible detectors are commonly used to detect and quantify organic compounds in HPLC. They work by exciting electrons in sample molecules using light from a lamp, with different compounds absorbing different wavelengths. Key factors that affect detector performance include optics design, lamp type and intensity, flow cell design, slit width, data collection rate, time constant, and use of a reference signal to reduce noise. Optimizing these parameters can improve sensitivity, robustness, and quantitation.
Atomic absorption spectroscopy (aas)
This document provides information on atomic absorption spectroscopy (AAS), including:
1) AAS is a technique used to determine the concentration of chemical elements in samples by measuring light absorption by free atoms. It can analyze over 62 elements and is commonly used in pharmaceutical, food, and environmental applications.
2) The basic components of an AAS instrument are a hollow cathode lamp, monochromator, atomizer, detector, and nebulizer. Samples are atomized in a flame or graphite furnace then irradiated to cause absorption of specific wavelengths that are measured.
3) AAS is based on the principle that free atoms generated from a sample can absorb radiation at specific frequencies, allowing quantification of elemental
Absorption Spectroscopy
1. Absorption spectroscopy measures the absorption of light by a sample as it transitions between energy levels. The amount of light absorbed is dependent on characteristics of the sample like concentration and path length.
2. A spectrophotometer directs light from a source through a wavelength selector and sample cell, and a detector measures the intensity of light transmitted. Double beam instruments separately measure light passing through a reference and sample for improved accuracy.
3. Beer's law states absorbance is directly proportional to concentration, path length, and a proportionality constant. Spectrophotometers allow determination of unknown concentrations by measuring absorbance.
FLUORESCENCE MICROSCOPY .pptx
Fluorescence microscopy uses fluorescent dyes and filters to visualize structures that cannot be seen with regular light microscopy. It works by exciting fluorophores in the sample with high intensity light which causes them to emit light of a longer wavelength. This emitted light is then filtered and used to form an image. Fluorescence microscopy allows specific labeling and tracking of molecules and structures within cells. It is widely used today in life sciences research and other fields like histology, food chemistry, and mineralogy. While it provides high sensitivity and specificity, limitations include photobleaching and potential phototoxicity to cells from fluorescent excitation.
Ftir
Fourier Transform Infrared Spectroscopy-:A type of infrared spectroscopy.It is method of obtaining an infrared spectrum by measuring interferogram and then performimg a Fourier Transform upon the interferogram to obtain the spectrum.
Raman Spectroscopy
This document provides an overview of Raman spectroscopy. It begins by defining spectroscopy as the study of how atoms and molecules interact with light. It then describes Raman scattering, which was discovered by C.V. Raman in 1928 and involves a change in frequency of scattered light that depends on the chemical structure of molecules. The rest of the document discusses key aspects of Raman spectroscopy such as Stokes and anti-Stokes scattering, the relationship between Raman and infrared spectroscopy, and applications of Raman spectroscopy such as molecular identification and quantification.
Pyrolysis Gas Chromatography. PY-GCMS
Pyrolysis is the breaking apart of chemical bonds through thermal energy. Analytical pyrolysis introduces solid and high molecular weight samples to a gas chromatograph by breaking them down. It is used to minimize sample preparation and analyze whole samples. Applications include forensics, polymers, and microorganisms. Samples are placed in a quartz tube or vial and pyrolyzed. Liquid samples can also be injected and pyrolyzed. The OPTIC inlet allows for fast, high temperature pyrolysis for both solid and liquid samples.
Nephlometry & turbidimetry
Turbidimetry and nephelometry are techniques used to analyze suspensions. Nephelometry measures scattered light at a 90 degree angle to determine concentration, while turbidimetry measures transmitted light at 180 degrees. Factors like concentration, particle geometry, and the refractive index difference affect measurements. Instruments include turbidimeters, which use blue filters or 530 nm light, and nephelometers, which use visible filters. Both techniques are used to quantitatively analyze various substances in applications like water treatment and pollution analysis.
Nephelometry instrumentation presentation
This document discusses nephelometry, which measures the amount of light scattered by particles suspended in a solution. Nephelometry is based on the principle of turbidity, where light is scattered by small particles in solution. Factors like particle size and concentration affect nephelometry measurements. Clinically, nephelometry is used to determine concentrations of immunoglobins and serum proteins in biological samples, and can also be used to monitor therapeutic drug levels in blood samples.
Photometry by Dr. Anurag Yadav
This document discusses photometry and spectrophotometry. It defines photometers as instruments that use filters to select wavelengths of light, while spectrophotometers use monochromators like prisms or gratings to select wavelengths. Beer's law and Lambert's law relating the absorption of light to properties of the absorbing material are also described. The key components of a spectrophotometer including its light source, wavelength selector, sample cell, and detector are summarized. Double beam and multichannel spectrophotometers are mentioned as are applications in chemistry, biology, and quality control testing of spectrophotometers.
Spectroscopy and doppler shift
This document discusses spectroscopy and how it is used to analyze light from stars and determine their composition. It provides three key points:
1) A spectroscope separates white light into a spectrum of wavelengths that is unique for each chemical element. The pattern of wavelengths emitted is like a fingerprint that identifies the element.
2) When elements are heated, they emit light across the visible spectrum in distinct patterns called emission spectra. Observing these spectra in starlight allows scientists to determine which elements are present on distant stars and galaxies.
3) All light from stars and galaxies is redshifted due to the expansion of the universe, providing evidence that the universe has been expanding since the Big Bang over 14 billion years ago.
Spectroscopy, Emission Spectroscopy.
Spectroscopy is defined as the study of the interaction between radiation and matter as a function of wavelength. It involves splitting light into its constituent wavelengths to study how matter absorbs and emits electromagnetic radiation. There are several types of spectroscopy that are used for various applications like determining atomic structure, monitoring dissolved oxygen, and characterizing proteins. Atomic emission spectroscopy uses high temperatures to excite the atoms in a sample, causing them to emit light at characteristic wavelengths. This emitted light is analyzed to determine the elemental composition of the sample.
More Related Content
What's hot
Atomic Absorption Techniques & Applications
The document discusses atomic absorption spectrometry (AAS) and its use in analyzing metals. It describes the basic components and process of AAS, including how samples are atomized in flames or graphite furnaces and the light absorption is measured. It also lists some common elements that are analyzed by AAS and applications in areas like environmental, food, and clinical testing.
Fluorescence Microscopy
Fluorescence microscopy uses fluorescence to visualize specimens. It works by exciting fluorescent molecules in the sample with high intensity light, causing them to emit light of a longer wavelength. This emitted light is then filtered and used to produce a magnified image of the sample. Modern fluorescence microscopes allow multiple fluorescence filters to be used, and fluorescent markers like dyes, proteins, and antibodies can be introduced to tag specific structures in cells or proteins of interest. This technique is widely used in medical and biological research to study structures and track molecules within living cells.
xray diffraction instrumentation
This document describes the key components and functioning of instrumentation used in x-ray diffraction. The main components are a radiation source like an x-ray tube, a collimator to narrow the beam, a monochromator to remove unwanted radiation, detectors like photographic film or counters, and associated electronics. X-ray tubes generate x-rays via the impact of electrons on a metal target. Collimators and monochromators shape and refine the x-ray beam before it interacts with the sample. Detectors then measure the diffraction pattern, with options including film, Geiger-Muller tubes, proportional counters, scintillators, and semiconductors.
Chemiluminescence, types of luminescent
Chemiluminescence is the production of light from a chemical reaction. Two chemicals react to form an excited intermediate state that releases energy in the form of photons as it returns to a stable ground state. This light emission occurs without much heat release. Chemiluminescent reactions can be grouped into chemical reactions using synthetic compounds, bioluminescent reactions from living organisms like fireflies, and electrochemiluminescent reactions involving electrical current. Forensic scientists use the chemiluminescent reaction of luminol to detect traces of blood at crime scenes by spraying a mixture that causes a blue glow in the presence of iron from hemoglobin.
Applications of uv visible spectroscopy
UV-visible spectroscopy involves measuring the absorption of light in the UV and visible light ranges. It is useful for determining conjugation and distinguishing between conjugated and non-conjugated compounds. It has applications in identifying unknown compounds, determining the extent of conjugation, and elucidating the structures of molecules like vitamins. It can also provide information about configuration, hydrogen bonding, molecular weight, and detect impurities. The Woodward-Fieser rules allow calculating the expected absorption maxima for certain functional groups.
Instrumentation of HPLC, principle by kk sahu
INTRODUCTION
Instrumentation of HPLC
TYPES OF HPLC
PARAMETERS
APPLICATION
CONCLUSION
REFERENCE
High-performance liquid chromatography ( HPLC) is a specific form of column chromatography generally used in biochemistry and analysis to separate, identify, and quantify the active compounds.
HPLC mainly utilizes a column that holds packing material (stationary phase), a pump that moves the mobile phase(s) through the column, and a detector that shows the retention times of the molecules.
Luminescence presentation
The document discusses different types of luminescence including bioluminescence used by deep sea organisms. It then describes how luminol is used by crime scene investigators to detect trace amounts of blood, even if cleaning products were used. Finally, it mentions green fluorescent protein (GFP) which was used to win the 2008 Nobel Prize in Chemistry and is now used in medical research to track proteins in diseases like cancer and Alzheimer's.
IR spectroscopy- Infra Red spectroscopy in details
This document provides an overview of infrared spectroscopy. It discusses how infrared spectroscopy can be used to analyze molecular vibrations and determine functional groups present in a molecule. The document outlines the basic principles of infrared spectroscopy, including how molecular vibrations absorb infrared radiation depending on factors like bond strength and atomic mass. It also summarizes typical infrared absorption regions and provides a chart of common functional group absorptions.
Flame photometry
Flame photometry is one of the method for analysis of drugs. Here we can get the principle, method, requirements and applications of flame photometry
Instrumentation of uv spectrophotometer pranav kumar singh
This document discusses the components and operation of a UV spectrophotometer. It describes the main components as the source, wavelength selector, sample container, detector, and readout. It provides details on common sources like deuterium arc lamps, tungsten lamps, and xenon arc lamps. It also discusses wavelength selector devices like monochromators and filters. The document outlines the applications of UV spectrophotometry in areas like detection of impurities, structure elucidation, and quantitative analysis. In under 3 sentences.
Introduction to UV-based detectors
UV-visible detectors are commonly used to detect and quantify organic compounds in HPLC. They work by exciting electrons in sample molecules using light from a lamp, with different compounds absorbing different wavelengths. Key factors that affect detector performance include optics design, lamp type and intensity, flow cell design, slit width, data collection rate, time constant, and use of a reference signal to reduce noise. Optimizing these parameters can improve sensitivity, robustness, and quantitation.
Atomic absorption spectroscopy (aas)
This document provides information on atomic absorption spectroscopy (AAS), including:
1) AAS is a technique used to determine the concentration of chemical elements in samples by measuring light absorption by free atoms. It can analyze over 62 elements and is commonly used in pharmaceutical, food, and environmental applications.
2) The basic components of an AAS instrument are a hollow cathode lamp, monochromator, atomizer, detector, and nebulizer. Samples are atomized in a flame or graphite furnace then irradiated to cause absorption of specific wavelengths that are measured.
3) AAS is based on the principle that free atoms generated from a sample can absorb radiation at specific frequencies, allowing quantification of elemental
Absorption Spectroscopy
1. Absorption spectroscopy measures the absorption of light by a sample as it transitions between energy levels. The amount of light absorbed is dependent on characteristics of the sample like concentration and path length.
2. A spectrophotometer directs light from a source through a wavelength selector and sample cell, and a detector measures the intensity of light transmitted. Double beam instruments separately measure light passing through a reference and sample for improved accuracy.
3. Beer's law states absorbance is directly proportional to concentration, path length, and a proportionality constant. Spectrophotometers allow determination of unknown concentrations by measuring absorbance.
FLUORESCENCE MICROSCOPY .pptx
Fluorescence microscopy uses fluorescent dyes and filters to visualize structures that cannot be seen with regular light microscopy. It works by exciting fluorophores in the sample with high intensity light which causes them to emit light of a longer wavelength. This emitted light is then filtered and used to form an image. Fluorescence microscopy allows specific labeling and tracking of molecules and structures within cells. It is widely used today in life sciences research and other fields like histology, food chemistry, and mineralogy. While it provides high sensitivity and specificity, limitations include photobleaching and potential phototoxicity to cells from fluorescent excitation.
Ftir
Fourier Transform Infrared Spectroscopy-:A type of infrared spectroscopy.It is method of obtaining an infrared spectrum by measuring interferogram and then performimg a Fourier Transform upon the interferogram to obtain the spectrum.
Raman Spectroscopy
This document provides an overview of Raman spectroscopy. It begins by defining spectroscopy as the study of how atoms and molecules interact with light. It then describes Raman scattering, which was discovered by C.V. Raman in 1928 and involves a change in frequency of scattered light that depends on the chemical structure of molecules. The rest of the document discusses key aspects of Raman spectroscopy such as Stokes and anti-Stokes scattering, the relationship between Raman and infrared spectroscopy, and applications of Raman spectroscopy such as molecular identification and quantification.
Pyrolysis Gas Chromatography. PY-GCMS
Pyrolysis is the breaking apart of chemical bonds through thermal energy. Analytical pyrolysis introduces solid and high molecular weight samples to a gas chromatograph by breaking them down. It is used to minimize sample preparation and analyze whole samples. Applications include forensics, polymers, and microorganisms. Samples are placed in a quartz tube or vial and pyrolyzed. Liquid samples can also be injected and pyrolyzed. The OPTIC inlet allows for fast, high temperature pyrolysis for both solid and liquid samples.
Nephlometry & turbidimetry
Turbidimetry and nephelometry are techniques used to analyze suspensions. Nephelometry measures scattered light at a 90 degree angle to determine concentration, while turbidimetry measures transmitted light at 180 degrees. Factors like concentration, particle geometry, and the refractive index difference affect measurements. Instruments include turbidimeters, which use blue filters or 530 nm light, and nephelometers, which use visible filters. Both techniques are used to quantitatively analyze various substances in applications like water treatment and pollution analysis.
Nephelometry instrumentation presentation
This document discusses nephelometry, which measures the amount of light scattered by particles suspended in a solution. Nephelometry is based on the principle of turbidity, where light is scattered by small particles in solution. Factors like particle size and concentration affect nephelometry measurements. Clinically, nephelometry is used to determine concentrations of immunoglobins and serum proteins in biological samples, and can also be used to monitor therapeutic drug levels in blood samples.
Photometry by Dr. Anurag Yadav
This document discusses photometry and spectrophotometry. It defines photometers as instruments that use filters to select wavelengths of light, while spectrophotometers use monochromators like prisms or gratings to select wavelengths. Beer's law and Lambert's law relating the absorption of light to properties of the absorbing material are also described. The key components of a spectrophotometer including its light source, wavelength selector, sample cell, and detector are summarized. Double beam and multichannel spectrophotometers are mentioned as are applications in chemistry, biology, and quality control testing of spectrophotometers.
What's hot (20)
IR spectroscopy- Infra Red spectroscopy in details
IR spectroscopy- Infra Red spectroscopy in details
Instrumentation of uv spectrophotometer pranav kumar singh
Instrumentation of uv spectrophotometer pranav kumar singh
Similar to Spectroscopy
Spectroscopy and doppler shift
This document discusses spectroscopy and how it is used to analyze light from stars and determine their composition. It provides three key points:
1) A spectroscope separates white light into a spectrum of wavelengths that is unique for each chemical element. The pattern of wavelengths emitted is like a fingerprint that identifies the element.
2) When elements are heated, they emit light across the visible spectrum in distinct patterns called emission spectra. Observing these spectra in starlight allows scientists to determine which elements are present on distant stars and galaxies.
3) All light from stars and galaxies is redshifted due to the expansion of the universe, providing evidence that the universe has been expanding since the Big Bang over 14 billion years ago.
Spectroscopy, Emission Spectroscopy.
Spectroscopy is defined as the study of the interaction between radiation and matter as a function of wavelength. It involves splitting light into its constituent wavelengths to study how matter absorbs and emits electromagnetic radiation. There are several types of spectroscopy that are used for various applications like determining atomic structure, monitoring dissolved oxygen, and characterizing proteins. Atomic emission spectroscopy uses high temperatures to excite the atoms in a sample, causing them to emit light at characteristic wavelengths. This emitted light is analyzed to determine the elemental composition of the sample.
Light
Light can be described as both a wave and a particle. As a wave, it travels at 300 million meters per second and is characterized by its wavelength and frequency. The different wavelengths of light make up the electromagnetic spectrum, from radio waves to gamma rays. As the frequency increases, so does the energy of the electromagnetic waves. Light also behaves as particles called photons, which are emitted or absorbed in specific wavelengths by electrons in atoms. This allows spectroscopy to be used to determine the composition of different objects by their emission or absorption spectra.
ComponentsPrincipleandApplicationsofUVVis-Spectophotometer-DRSJ.ppt
Spectrophotometers use light sources, monochromators, and detectors to measure the absorption of specific wavelengths of light by a sample. They have applications in photometry, colorimetry, and spectrophotometry to quantitatively analyze compounds. A spectrophotometer passes light through a sample and measures the intensity of transmitted light, allowing concentration measurements using the Beer-Lambert law. Common components include sources like deuterium lamps, monochromators to select wavelengths, and detectors to convert light to electrical signals.
Introduction to Spectroscopy
Spectroscopy is the study of the interaction of electromagnetic radiation in all its forms with the matter. The interaction might give rise to electronic excitations, (e.g. UV), molecular vibrations (e.g. IR) or nuclear spin orientations (e.g. NMR). Thus Spectroscopy is the science of the interaction of energy, in the form of electromagnetic radiation (EMR), acoustic waves, or particle beams, with the matter.
Here in this article, the matter is studied in further detail.
Introduction to Light Lesson for Middle School
Light is a type of electromagnetic radiation that behaves as both a particle and wave. It comes in packets called photons that act like particles. As a wave, light has frequencies and wavelengths. The frequency is the number of times the wave passes a fixed point per unit of time, and higher frequencies correspond to shorter wavelengths. Different frequencies and wavelengths of light carry different amounts of energy. The electromagnetic spectrum classifies light based on its energy, with some types like ultraviolet and infrared having wavelengths just outside the visible light range that the human eye can see. Visible light corresponds to wavelengths from 400-700 nanometers and is experienced as the colors violet, blue, green, yellow, orange, and red from shortest to longest wavelength.
Artificial lighting.pptx
Red light has a longer wavelength than blue light. Light behaves as a wave and the color we see depends on the wavelength. Visible light is a small portion of the electromagnetic spectrum. A photometer is a device that measures light intensity as perceived by the human eye, taking into account the eye's sensitivity to different wavelengths. There are different types of photometry including differential, which compares the brightness of an object to others, and absolute, which measures an object's actual brightness without comparison.
Spectrophotometry and colorimetry.pdf
Spectrophotometry and colorimetry are analytical techniques that use light to determine properties of substances. Spectrophotometry measures how much light is absorbed by a solution and can be used to determine concentration. It works by passing light through a sample and measuring the absorption at specific wavelengths. Many factors can affect the measurements, including concentration, path length, and calibration. Spectrophotometry has wide applications in fields like chemistry, medicine, food science and more.
Spectrophotometer instrumentation & working
Spectrophotometric analysis is a technique to measure the concentration of solute solution by measuring the amount of light absorbed by solution.
Absorption can be calculated in terms of transmittance by using Beer's Lambert law.
Fundamentals of Spectrophotometer
The document provides an overview of fundamentals of spectrophotometry. It discusses how spectrophotometers work by measuring the absorption of light as it passes through a sample. Key points include:
- Spectrophotometers measure the intensity of light absorbed by a sample at specific wavelengths.
- Beer's law describes the relationship between light absorption and analyte concentration, path length, and absorptivity.
- The basic design of a spectrophotometer includes a light source, wavelength selector/monochromator to isolate wavelengths, and a detector to measure transmitted light intensity.
Mse spectroscopy
Spectroscopy is the study of the absorption and emission of light and other electromagnetic radiation by matter. It is used to study the structure of atoms and molecules by analyzing the wavelengths of radiation absorbed or emitted. A spectrophotometer can measure the amount of light absorbed by a sample and is used to determine the concentration of substances in solution. Common types of spectroscopy include absorption, emission, scattering, and fluorescence spectroscopy which use different methods to excite samples and analyze the spectra produced. Spectroscopy has many applications in fields like environmental analysis, biomedical science, and astronomy.
Fluorescence spectroscopy
This document discusses different types of luminescence including photoluminescence, chemiluminescence, and electroluminescence. It then focuses on fluorescence spectroscopy, describing how it works, common instrumentation used, and parameters that influence fluorescence spectra such as excitation wavelength and concentration. Applications of fluorescence spectroscopy are outlined as well as techniques like steady-state fluorescence, time-resolved fluorescence, fluorescence anisotropy, and quenching of fluorescence.
Spectrometer
Spectrometers are instruments that identify substances by analyzing the wavelengths of light they absorb or emit. They work by dispersing light into a spectrum of component wavelengths using a prism or diffraction grating. Each element has a unique spectral pattern that can be used to identify it. Sir Isaac Newton invented an early spectrometer in the 1600s, and later scientists like Kirchhoff and Rydberg made advances that allowed spectrometers to accurately measure atomic structures and energy levels. Modern spectrometers are used across many fields including astronomy, archaeology, chemistry, and medicine to analyze material compositions and properties.
Spectroscopy
Spectroscopy using spectrophotometers of different types like: U.V, Mass Spectrophotometer, absorption , Emission, Nuclear magnetic resonance and X-rays Spectrophotometer
PHOTOMETRY.pptx
Photometry is the science of measuring light in terms of its brightness as perceived by the human eye. It only considers visible light since the eye can only see in this range. Spectrophotometry measures light intensity across the electromagnetic spectrum using instruments. Absorption spectrophotometry measures the absorption of light as it passes through a sample, relating absorption to characteristics like concentration through Beer's and Lambert's laws. A spectrophotometer directs light from a source through a sample and measures the intensity of transmitted light using a detector to analyze samples and identify substances.
Uv visiblr spectroscopy
This document provides an overview of UV-visible spectroscopy and chromophores. It discusses electromagnetic radiation and its wave and particle properties. UV-visible spectroscopy utilizes absorption of radiation in the ultraviolet and visible wavelength ranges by chromophores in molecules. Chromophores are functional groups that absorb specific wavelengths, while auxochromes modify this absorption. Beer's law describes the relationship between absorption and concentration. Instrumentation for UV-visible spectroscopy includes sources of radiation, monochromators, sample cells, and detectors. Applications involve quantitative analysis, structure elucidation, and more.
Spectrophotometer
A spectrophotometer is an instrument that measures the amount of light transmitted through a sample. It uses light energy in the ultraviolet (UV) or visible light spectrum to detect molecules in a solution. The spectrophotometer shines a beam of light on a sample, and measures how the sample interacts with the light through absorption, reflection, or transmission. By comparing the transmittance or absorbance values of an unknown sample to standards of known concentration, the spectrophotometer can determine the concentration of the unknown sample.
Spectrometer
This document discusses different methods for detecting molecules in solutions, including indicator solutions and spectrophotometers. It describes how spectrophotometers work by shining light on a sample and measuring how it absorbs, reflects, or transmits the light. Spectrophotometers can use ultraviolet or visible light and measure transmittance, converting it to absorbance using Beer's Law to determine concentrations of unknown samples. The document provides details on the inner parts of spectrophotometers including lamps, prisms or gratings, and outer parts like sample holders and displays.
spectrophotometry, ultra violet absorption, infra red atomic absorption.
A spectrophotometer is a photometer that can measure the intensity of light as a function of its wavelength. Single beam and double beam are the two major classes of spectrophotometers. Linear range of absorption and spectral bandwidth measurement are the important features of spectrophotometers.
In Single Beam Spectrophotometers, all the light passes through the sample. To measure the intensity of the incident light the sample must be removed so that all the light can pass through. This type of spectrometer is usually less expensive and less complicated. The single beam instruments are optically simpler and more compact, znc can also have a larger dynamic range.
In a Double Beam Spectrophotometer, before it reaches the sample, the light source is split into two separate beams. One beam passes through the sample and the second one is used for reference. This gives an advantage because the reference reading and sample reading can take place at the same time.
In transmission measurements, the spectrophotometer quantitatively compares the amount of light passing through the reference and test sample. For reflectance, it compares the amount of light reflecting from the test and reference sample solutions.
Many spectrophotometers must be calibrated before they start to analyse the sample and the procedure for calibrating spectrophotometer is known as "zeroing." Calibration is done by using the reference substance, and the absorbencies of all other substances are measured relative to the reference substance. % transmissivity (the amount of light transmitted through the substance relative to the initial substance) is displayed on the spectrophotometer.
Electromagnetic spectrum-power point
A. Electromagnetic waves travel as vibrations in electrical and magnetic fields at the speed of light without a medium. They have properties of both waves and particles.
B. The electromagnetic spectrum orders electromagnetic waves from radio waves to gamma rays based on increasing frequency and decreasing wavelength. Different electromagnetic waves are used for technologies like WiFi, infrared devices, MRI, and X-rays.
Similar to Spectroscopy (20)
ComponentsPrincipleandApplicationsofUVVis-Spectophotometer-DRSJ.ppt
ComponentsPrincipleandApplicationsofUVVis-Spectophotometer-DRSJ.ppt
spectrophotometry, ultra violet absorption, infra red atomic absorption.
spectrophotometry, ultra violet absorption, infra red atomic absorption.
Recently uploaded
Temple of Asclepius in Thrace. Excavation results
The temple and the sanctuary around were dedicated to Asklepios Zmidrenus. This name has been known since 1875 when an inscription dedicated to him was discovered in Rome. The inscription is dated in 227 AD and was left by soldiers originating from the city of Philippopolis (modern Plovdiv).
THE SACRIFICE HOW PRO-PALESTINE PROTESTS STUDENTS ARE SACRIFICING TO CHANGE T...
The recent surge in pro-Palestine student activism has prompted significant responses from universities, ranging from negotiations and divestment commitments to increased transparency about investments in companies supporting the war on Gaza. This activism has led to the cessation of student encampments but also highlighted the substantial sacrifices made by students, including academic disruptions and personal risks. The primary drivers of these protests are poor university administration, lack of transparency, and inadequate communication between officials and students. This study examines the profound emotional, psychological, and professional impacts on students engaged in pro-Palestine protests, focusing on Generation Z's (Gen-Z) activism dynamics. This paper explores the significant sacrifices made by these students and even the professors supporting the pro-Palestine movement, with a focus on recent global movements. Through an in-depth analysis of printed and electronic media, the study examines the impacts of these sacrifices on the academic and personal lives of those involved. The paper highlights examples from various universities, demonstrating student activism's long-term and short-term effects, including disciplinary actions, social backlash, and career implications. The researchers also explore the broader implications of student sacrifices. The findings reveal that these sacrifices are driven by a profound commitment to justice and human rights, and are influenced by the increasing availability of information, peer interactions, and personal convictions. The study also discusses the broader implications of this activism, comparing it to historical precedents and assessing its potential to influence policy and public opinion. The emotional and psychological toll on student activists is significant, but their sense of purpose and community support mitigates some of these challenges. However, the researchers call for acknowledging the broader Impact of these sacrifices on the future global movement of FreePalestine.
BPSC-105 important questions for june term end exam
BPSC-105 important questions for june term end exam
Level 3 NCEA - NZ: A Nation In the Making 1872 - 1900 SML.ppt
The History of NZ 1870-1900.
Making of a Nation.
From the NZ Wars to Liberals,
Richard Seddon, George Grey,
Social Laboratory, New Zealand,
Confiscations, Kotahitanga, Kingitanga, Parliament, Suffrage, Repudiation, Economic Change, Agriculture, Gold Mining, Timber, Flax, Sheep, Dairying,
欧洲杯下注-欧洲杯下注押注官网-欧洲杯下注押注网站|【网址🎉ac44.net🎉】
【网址🎉ac44.net🎉】欧洲杯下注在体育博彩方面,不难发现,欧洲杯下注多为英式运动提供投注。欧洲杯下注为丰富多彩的体育项目提供投注,如足球、赛马、板球和飞镖,但这不是欧洲杯下注的唯一优势。在欧洲杯下注,全世界玩家都可以找到自己感兴趣的比赛进行投注。欧洲杯下注为网球和美式运动如棒球、美式足球、篮球、冰球开出的投注同样值得关注。在夏季或冬季奥运会方面,欧洲杯下注为玩家开出了丰富多彩的服务,是你的不二之选。你还可以投注水球、自行车和班迪球等小众体育项目,甚至可以为武术、拳击和综合格斗投注。欧洲杯下注为众多体育项目开出滚球投注。
INTRODUCTION TO HOSPITALS & AND ITS ORGANIZATION
The document discuss about the hospitals and it's organization .
How to Download & Install Module From the Odoo App Store in Odoo 17
Custom modules offer the flexibility to extend Odoo's capabilities, address unique requirements, and optimize workflows to align seamlessly with your organization's processes. By leveraging custom modules, businesses can unlock greater efficiency, productivity, and innovation, empowering them to stay competitive in today's dynamic market landscape. In this tutorial, we'll guide you step by step on how to easily download and install modules from the Odoo App Store.
Contiguity Of Various Message Forms - Rupam Chandra.pptx
Contiguity Of Various Message Forms - Rupam Chandra.pptx
Elevate Your Nonprofit's Online Presence_ A Guide to Effective SEO Strategies...
Whether you're new to SEO or looking to refine your existing strategies, this webinar will provide you with actionable insights and practical tips to elevate your nonprofit's online presence.
How to Setup Default Value for a Field in Odoo 17
In Odoo, we can set a default value for a field during the creation of a record for a model. We have many methods in odoo for setting a default value to the field.
A Free 200-Page eBook ~ Brain and Mind Exercise.pptx
(A Free eBook comprising 3 Sets of Presentation of a selection of Puzzles, Brain Teasers and Thinking Problems to exercise both the mind and the Right and Left Brain. To help keep the mind and brain fit and healthy. Good for both the young and old alike.
Answers are given for all the puzzles and problems.)
With Metta,
Bro. Oh Teik Bin 🙏🤓🤔🥰
Recently uploaded (20)
220711130088 Sumi Basak Virtual University EPC 3.pptx
220711130088 Sumi Basak Virtual University EPC 3.pptx
THE SACRIFICE HOW PRO-PALESTINE PROTESTS STUDENTS ARE SACRIFICING TO CHANGE T...
THE SACRIFICE HOW PRO-PALESTINE PROTESTS STUDENTS ARE SACRIFICING TO CHANGE T...
BPSC-105 important questions for june term end exam
BPSC-105 important questions for june term end exam
SWOT analysis in the project Keeping the Memory @live.pptx
SWOT analysis in the project Keeping the Memory @live.pptx
Level 3 NCEA - NZ: A Nation In the Making 1872 - 1900 SML.ppt
Level 3 NCEA - NZ: A Nation In the Making 1872 - 1900 SML.ppt
How to Download & Install Module From the Odoo App Store in Odoo 17
How to Download & Install Module From the Odoo App Store in Odoo 17
Contiguity Of Various Message Forms - Rupam Chandra.pptx
Contiguity Of Various Message Forms - Rupam Chandra.pptx
Elevate Your Nonprofit's Online Presence_ A Guide to Effective SEO Strategies...
Elevate Your Nonprofit's Online Presence_ A Guide to Effective SEO Strategies...
A Free 200-Page eBook ~ Brain and Mind Exercise.pptx
A Free 200-Page eBook ~ Brain and Mind Exercise.pptx
Spectroscopy
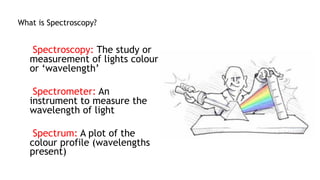
- 1. What is Spectroscopy? Spectroscopy: The study or measurement of lights colour or ‘wavelength’ Spectrometer: An instrument to measure the wavelength of light Spectrum: A plot of the colour profile (wavelengths present)
- 2. Colour and Wavelength Light can be many different colours Each colour of light is different to the other Because each colour of light has a different wavelength!
- 3. Colour and Wavelength The wavelength λ of light is the distance point to point of a wave of light The ‘visible’ light ranges from violet light 400nm up to red 700nm The shorter the wavelength the more energy the light has λ
- 4. Electromagnetic Spectrum Light is a form of ‘electromagnetic wave’ Visible light is only a very small section of the range of wavelengths! See if you recognize any others
- 5. • So how does a spectrometer work? • The answer lies with dispersion Measuring the Wavelength of Light So if a nanometer is 1 millionth of a millimeter, how do we measure the wavelength of light? We certainly can’t use a ruler! So we must use other means, we must use a spectrometer
- 6. Measuring the Wavelength of Light When light passes through a small slit (grating) or prism it ‘spreads out’ or disperses The longer the wavelength the further it disperses Each wavelength spreads differently due to the formula n.λ=d.sinθ • This dispersion creates a spectra, which we can record using a camera to analyze • This is the basis of spectroscopy
- 7. Spectroscopy There are three main types of spectra within spectroscopy Continuum: Broad bands of many wavelengths Emission: Only some specific wavelengths present Absorption: Some specific wavelengths missing (Absorbed)
- 8. Spectroscopy In professional spectrometers the intensity of the light is plotted vs. the position of the light on the camera, With a little math we can then convert this to intensity of the light vs. the wavelength of the light
- 9. Spectroscopy Continuum spectra are most commonly due to thermal energy being released from a sample at all wavelengths (Black body radiation) The broad release of energy will have certain shape of intensity which can often be used to determine the rough temperature of the sample Emission and Absorption spectra hold much more information about the sample and are what we look for in spectroscopy. But why? The answer is atomic fingerprints!
- 10. Atomic Emission – Atom Fingerprints When atoms are excited electrons can move up into the outer rings Electrons will release energy in the form of light to return to their original state For each element the spectrum of light is specific like a fingerprint
- 11. Atomic Absorption - Atom Fingerprints Similar to atomic emission but the process is reversed Fingerprints of light are absorbed rather than emitted Electron is excited up and releases the energy in other forms Usually requires the sample to be in a gaseous state
- 12. Atom Fingerprints If we can capture these atomic spectra with a spectrometer we can read these ‘fingerprints’ Using reference tables we can determine what elements are present It’s nearly like looking at the sample’s recipe! Ingredients: 1 Tsp Carbon 1 Tbsp Hydrogen 1 Tsp Oxygen Pinch of Potassium
- 13. Example – Fluorescent Bulb We can see the change to the ‘new’ style of bulb has less continuum this is due to less energy wasted into heat energy We can also see that the mercury spectrum matches up with lines in the spectra showing the presence of mercury in the bulbs Fluorescent Bulb Old Style Fluorescent Bulb New Style Mercury Spectrum
- 14. Example – Multi element Source