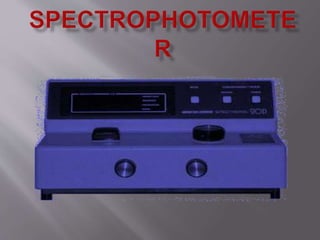
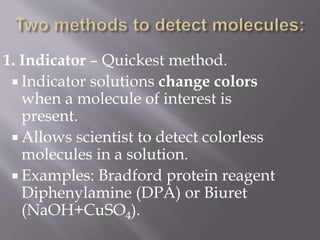
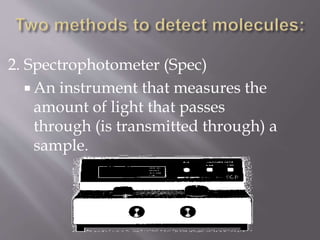
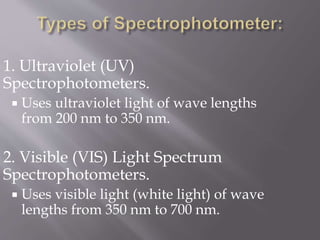
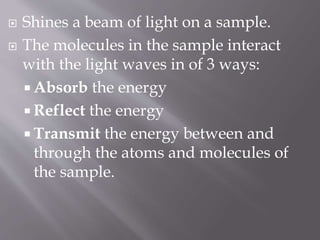
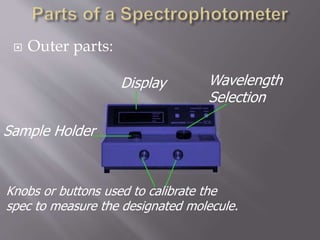
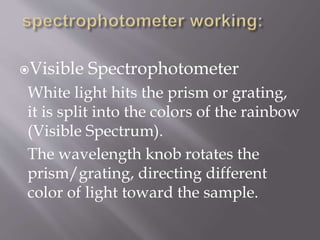
Mujahid ali
Roll No: 44
B.s applied geology
Institute of geology, University of the Punjab Lahore
1. Indicator – Quickest method.
 Indicator solutions change colors
when a molecule of interest is
present.
 Allows scientist to detect colorless
molecules in a solution.
 Examples: Bradford protein reagent
Diphenylamine (DPA) or Biuret
(NaOH+CuSO4).
2. Spectrophotometer (Spec)
 An instrument that measures the
amount of light that passes
through (is transmitted through) a
sample.
Uses a type of light to detect
molecules in a solution
Light is a type of energy, and
the energy is reported as
wavelengths, in nanometers
(nm).
1. Ultraviolet (UV)
Spectrophotometers.
 Uses ultraviolet light of wave lengths
from 200 nm to 350 nm.
2. Visible (VIS) Light Spectrum
Spectrophotometers.
 Uses visible light (white light) of wave
lengths from 350 nm to 700 nm.
R O Y G B I V
 Shines a beam of light on a sample.
 The molecules in the sample interact
with the light waves in of 3 ways:
 Absorb the energy
 Reflect the energy
 Transmit the energy between and
through the atoms and molecules of
the sample.
Consider blue molecules, all the
wavelengths of light are absorbed,
except for the blue ones.
The blue wavelengths are transmitted
or reflected off the molecules. If these
blue wavelengths hit a detector (such
as in the spectrophotometer or the
nerve cells in your eye), they appear
blue.
 Molecules are whatever color of
light that they do not absorb.
 Green molecules appear green
because they absorb most
wavelengths of visible light,
except the green wavelengths.
The spectrophotometer measures
the amount of light transmitted
through the sample
(Transmittance).
By using an equation (Beers law),
it converts the transmittance data
to an absorbance value.
It is quantitative analysis
The concentration of an unknown
sample can be determined by
comparing the absorbance data to
standards of known concentration.
The data generated with the set of
known standards is called a
standard curve.
 Inner parts
● Lamp
● Prism or grating that direct light of
a specific wavelength.
 Outer parts:
Sample Holder
Display
Knobs or buttons used to calibrate the
spec to measure the designated molecule.
Wavelength
Selection
Visible Spectrophotometer
White light hits the prism or grating,
it is split into the colors of the rainbow
(Visible Spectrum).
The wavelength knob rotates the
prism/grating, directing different
color of light toward the sample.
 The wavelength of light produced
by the tungsten lamp range from
about 350 nm (Violet light) to 700
nm (red light).
 The molecules in the sample either
absorb or Transmit the light energy
of one wavelength or another.
 The detector measures the amount
of light being transmitted by the
sample and reports that value
directly (% transmittance) or
converts it to the amount of light
absorbed in absorbance units (au)
using Beers Law.
1. Determines the presence and
concentrations of samples.
2. Determines the purity of a
sample.
3. Look at the change of samples
over time.

Spectrometer

  • 2.
    Mujahid ali Roll No:44 B.s applied geology Institute of geology, University of the Punjab Lahore
  • 3.
    1. Indicator –Quickest method.  Indicator solutions change colors when a molecule of interest is present.  Allows scientist to detect colorless molecules in a solution.  Examples: Bradford protein reagent Diphenylamine (DPA) or Biuret (NaOH+CuSO4).
  • 4.
    2. Spectrophotometer (Spec) An instrument that measures the amount of light that passes through (is transmitted through) a sample.
  • 5.
    Uses a typeof light to detect molecules in a solution Light is a type of energy, and the energy is reported as wavelengths, in nanometers (nm).
  • 6.
    1. Ultraviolet (UV) Spectrophotometers. Uses ultraviolet light of wave lengths from 200 nm to 350 nm. 2. Visible (VIS) Light Spectrum Spectrophotometers.  Uses visible light (white light) of wave lengths from 350 nm to 700 nm.
  • 7.
    R O YG B I V
  • 8.
     Shines abeam of light on a sample.  The molecules in the sample interact with the light waves in of 3 ways:  Absorb the energy  Reflect the energy  Transmit the energy between and through the atoms and molecules of the sample.
  • 9.
    Consider blue molecules,all the wavelengths of light are absorbed, except for the blue ones. The blue wavelengths are transmitted or reflected off the molecules. If these blue wavelengths hit a detector (such as in the spectrophotometer or the nerve cells in your eye), they appear blue.
  • 10.
     Molecules arewhatever color of light that they do not absorb.  Green molecules appear green because they absorb most wavelengths of visible light, except the green wavelengths.
  • 11.
    The spectrophotometer measures theamount of light transmitted through the sample (Transmittance). By using an equation (Beers law), it converts the transmittance data to an absorbance value. It is quantitative analysis
  • 12.
    The concentration ofan unknown sample can be determined by comparing the absorbance data to standards of known concentration. The data generated with the set of known standards is called a standard curve.
  • 13.
     Inner parts ●Lamp ● Prism or grating that direct light of a specific wavelength.
  • 14.
     Outer parts: SampleHolder Display Knobs or buttons used to calibrate the spec to measure the designated molecule. Wavelength Selection
  • 16.
    Visible Spectrophotometer White lighthits the prism or grating, it is split into the colors of the rainbow (Visible Spectrum). The wavelength knob rotates the prism/grating, directing different color of light toward the sample.
  • 17.
     The wavelengthof light produced by the tungsten lamp range from about 350 nm (Violet light) to 700 nm (red light).  The molecules in the sample either absorb or Transmit the light energy of one wavelength or another.
  • 18.
     The detectormeasures the amount of light being transmitted by the sample and reports that value directly (% transmittance) or converts it to the amount of light absorbed in absorbance units (au) using Beers Law.
  • 19.
    1. Determines thepresence and concentrations of samples. 2. Determines the purity of a sample. 3. Look at the change of samples over time.