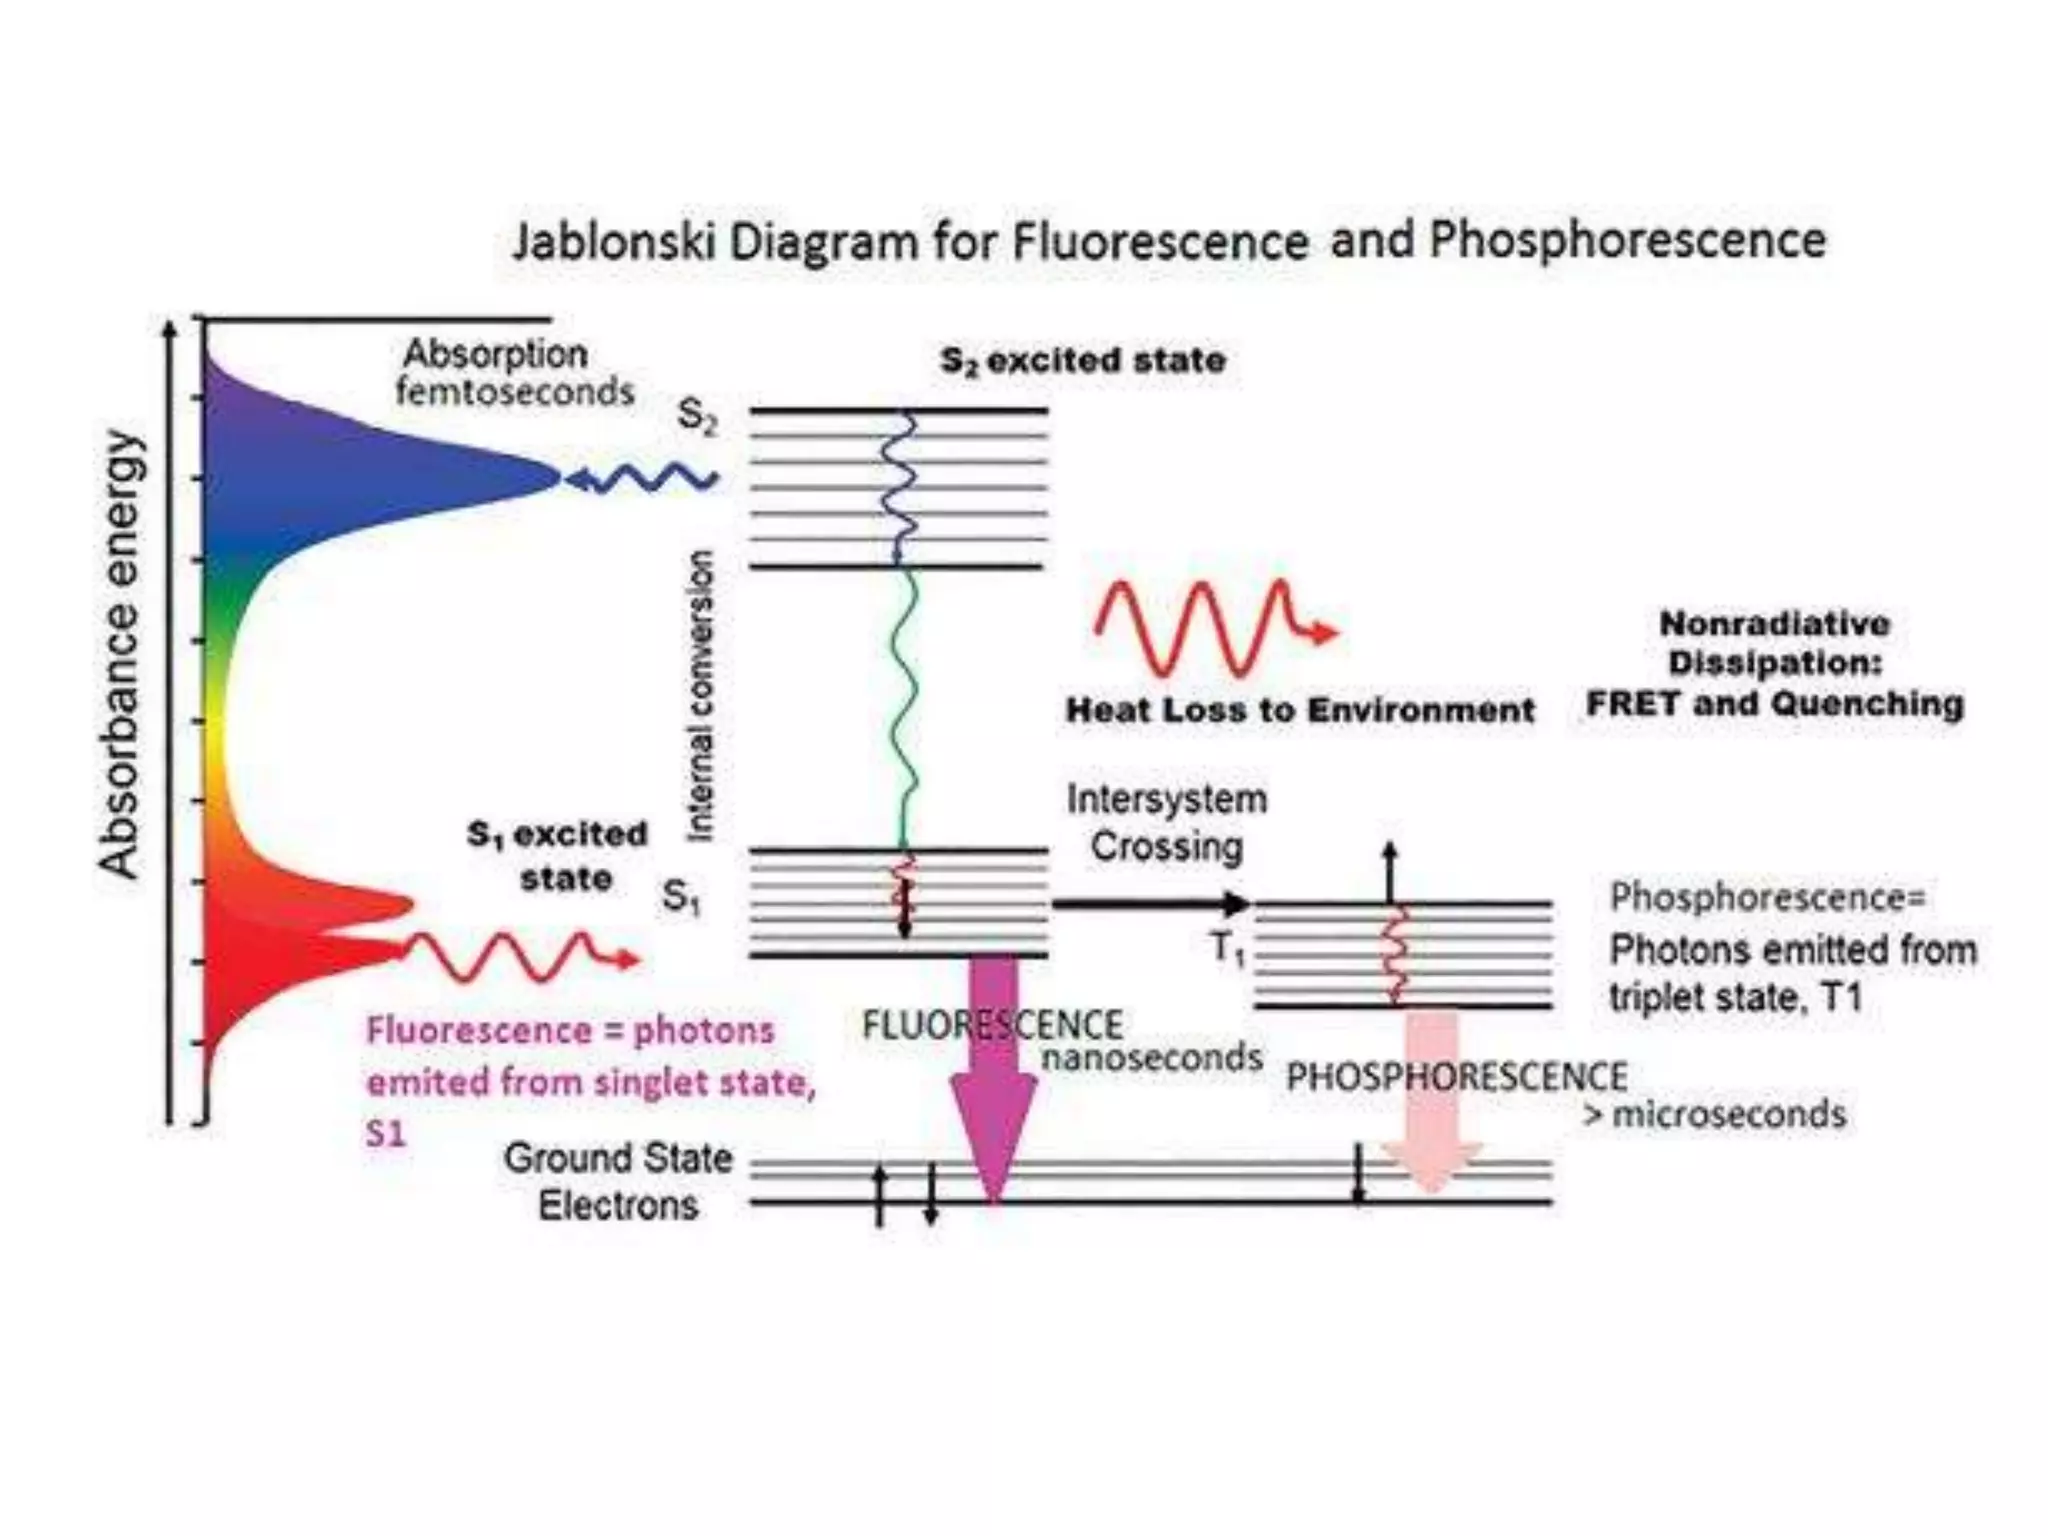
2. Luminescence, broadly defined, is light emission from a molecule. There are several types of
luminescence.
Photoluminescence is when light energy, or photons, stimulate the emission of a photon.
Chemiluminescence, is defined as when chemical energy stimulates the emission of a photon,
and this includes bioluminescence, as seen in fire flies and many forms of sea life.
Electroluminescence, is when electrical energy or a strong electric field, stimulates the
emission of a photon, such as in some lighting applications.
Fluorescence, specifically, is a type of photoluminescence where light raises an electron to an
excited state. The excited state undergoes rapid thermal energy loss to the environment
through vibrations, and then a photon is emitted from the lowest-lying singlet excited state.
3. When white light passes through
substance, a characteristic portion
or is reflected by a colored
of the mixed wavelengths is
absorbed. The remaining light will then assume the complementary
color to the wavelength(s) absorbed.
This relationship is demonstrated by
the color wheel shown on the right.
Here, complementary colors are
opposite each other.diametrically
Thus,
absorption of 420-430 nm light
renders a substance YELLOW and
absorption of 500-520 nm light makes
it RED.
GREEN is unique in that it can be
created by absoption close to 400 nm
as well as absorption near 800 nm.
7. Fluorescence spectroscopy (also known as fluorimetry or spectrofluorometry) is a
type of electromagnetic spectroscopy that analyzes fluorescence from a sample.
What is Fluorescent Spectroscopy
• Fluorescence spectrometry is a fast, simple and inexpensive method to determine the
concentration of an analyte in solution based on its fluorescent properties.
• It can be used for relatively simple analyses, where the type of compound to be analyzed
(‘analyte’) is known, to do a quantitative analysis to determine the concentration of the
analytes.
• Fluorescence is used mainly for measuring compounds in solution.
• In fluorescence spectroscopy, a beam with a wavelength varying between 180 and ∼800 nm
passes through a solution in a cuvette. We then measure from an angle the light that is emitted
by the sample.
• In fluorescence spectrometry both an excitation spectrum (the light that is absorbed by the
sample) and/or an emission spectrum (the light emitted by the sample) can be measured. The
concentration of the analyte is directly proportional with the intensity of the emission.
9. JABLONSKI: The father of fluorescence spectroscopy
.
• The processes that occur between
absorption and emmision of light was
explained by Prof. Alexander Jablonski
• He also decribed concentration
polarization and anisotropy to explain
polarised emission from solutions.
14. Stokes shift
The Stokes shift is the gap between the maximum of the first absorption band
and the maximum of the fluorescence spectrum
loss of vibrational energy in the excited
state as heat by collision with solvent
heat
15. Introduction to Steady State and Time Resolved Fluorescence Spectroscopy
• Steady state fluorescence spectra are
when molecules, excited by a constant
source of light, emit fluorescence, and the
emitted photons, or intensity, are detected
as a function of wavelength.
• A fluorescence emission spectrum is
when the excitation wavelength is fixed
and the emission wavelength is scanned to
get a plot of intensity vs. emission
wavelength.
• A fluorescence excitation spectrum is when the emission wavelength is fixed and the
excitation monochromator wavelength is scanned.
• Fluorescence spectra is analogous to absorbance spectrum, but is a much more sensitive
technique in terms of limits of detection and molecular specificity.
• The emission and excitation spectra for a given fluorophore are mirror images of each other.
Typically, the emission spectrum occurs at higher wavelengths (lower energy) than the
excitation or absorbance spectrum.
18. There are several parameters influencing the intensity and shape of the spectra.
When recording an emission spectrum the intensity is dependent on the:
• Excitation wavelength
• Concentration of the analyte solvent
• Path length of the cuvette
• Self-absorption of the sample
solvatochromism
19. When we can use fluorescence spectroscopy:
• Fluorescence analysis is suitable for analytes that can be dissolved in solvents like water,
ethanol, hexane.
• The analyte need to absorb UV or visible light.
• The analytes need to emit visible or near infra red radiation.
• With fluorescence analysis we can do quantitative measurements of a single analyte in
solution ( or more than one analytes in solution provided they do not interfare with each
other. )
When we cannot use fluorescence spectroscopy:
• Analytes that have a photochemical reaction at ( or above )the wavelength range of
interest.
• Intranparent or colloidal samples.
• Compounds that do not show fluorescence.
20. STEADY-STATE AND TIME-RESOLVED FLUORESCENCE
Fluorescence measurements can be broadly classified into two types of measurements:
steady-state and time-resolved.
Steady-state measurements, the most common type, are those performed with constant illumination
and observation. The sample is illuminated with a continuous beam of light, and the intensity or
emission spectrum is recorded. Because of the ns timescale of fluorescence, most measurements are
steady-state measurements. When the sample is first exposed to light, steady state is reached almost
immediately.
The second type of measurement is
time-resolved, which is used for
measuring intensity decays or
anisotropy decays. For these
measurements the sample is
exposed to a pulse of light, where
the pulse width is typically shorter
than the decay time of the sample.
This intensity decay is recorded with
a high-speed detection system that
permits the intensity or anisotropy
to be measured on the ns timescale.
21. It is important to understand the relationship between steady-state and time-resolved
measurements. A steady state observation is simply an average of the time-resolved
phenomena over the intensity decay of the sample. For instance, consider a fluorophore
that displays a single decay time (τ) and a single rotational correlation time (θ). The intensity
and anisotropy decays are given by
where I0 and r0 are the intensities and anisotropies at t = 0, immediately following the
excitation pulse, respectively. Equations 1 and 2 can be used to illustrate how the decay
time determines what can be observed using fluorescence. The steady-state anisotropy
(r) is given by the average of r(t) weighted by I(t):
……. (1)
……. (2)
……. (3)
Put equation (1) and (2) in equation (3)
we get perrin equation
……. (4)
22. Perhaps a simpler example is how the steady-state intensity (ISS) is related to the decay
time. The steady-state intensity is given by
23. Time resolved fluorescence
• A fluorescence lifetime is the time a molecule spends in the excited state.
• Measure fluorescence as a lifetime decay and fit the decay to a rate ( or multiple rate )
equation.
• We use time correlated single photon counting technique to do this.
24. What is Fluorescence Anisotropy
• Anisotropy is a measurement of the changing orientation of the molecule in space with
respect to time between the absorption and emission events.
• Absorption and emission indicate the spatial alignment of the molecules dipoles relative
to the electronic vector of the electromagnetic wave of excitation light and emitted
light,respectively.
Anisotroy, r
• vv denotes vertical excitation,
vertical emission
• vH denotes vertical excitation,
horizontal emission
25.
26. Quenching of Fluorescence
A wide variety of small molecules or ions can act as quenchers of fluorescence, that is, they
decrease the intensity of the emission. These substances include iodide (I-), oxygen, and
acrylamide. The accessibility of fluorophores to such quenchers can be used to determine the
location of probes on macromolecules, or the porosity of proteins and membranes to
quenchers.
Fluorescent spectroscopy used by most of the field in science