SlideShare a Scribd company logo
1 of 6
Download to read offline
SYED MUHAMMAD KHAN (BS HONS. ZOOLOGY)
pg. 1
SPECTROPHOTOMETRY IN BIOLOGY
“Spectrophotometry is the quantitative measurement of the reflection or transmission
properties of a material as a function of wavelength, it deals with visible light, near-
ultraviolet, and near-infrared. Spectrophotometers are special types of photometers that
can measure a light beam's intensity as a function of its color (wavelength).”
Important features of spectrophotometers are spectral bandwidth (the range of colors it can
transmit through the test sample), the percentage of sample-transmission, the logarithmic
range of sample-absorption, and sometimes a percentage of reflectance measurement.
STRUCTURE OF A SPECTROPHOTOMETER
A modern spectrophotometer includes: (1) an optic/beam splitting unit which isolates a light
ray of the desired wavelength, (2) sample unit which holds the sample, (3) light detection and
processing unit, and (4) display and user interface.
Figure: Table top spectrophotometer
1. BEAM SPLITTING UNIT (OPTICAL UNIT)
Light Source: The common light sources of a spectrophotometer are tungsten halogen lamps
(for visible light), deuterium lamps (for UV light), and xenon lamps (visible + UV).
Light Source Switch: It is used to sequentially switch the UV light source and visible light
source.
SYED MUHAMMAD KHAN (BS HONS. ZOOLOGY)
pg. 2
Collimating Mirror (Reflector & Light-in Slit): Before the light been spitted into a single color
beam, the original light from the lamps can be preprocessed into a straight parallel light rays
by these optic devices.
Grating: The surface of a grating is a jagged mirror. It is used to disperse the original color-
mixed “white light” into several individual color light (it has replaced prisms).
Collimating Mirror (Light-out Slit): After the white light is dispersed into pure individual
colors, the light is unfolded like a folding fan. By rotating the angle of a collimating mirror, a
specific wavelength of the color light can be aligned on the light-out slit. After the color light
passing through the slit, the unwanted wavelengths are filtered out, and a single pure light
(of the desired wavelength) is produced.
2. SAMPLE UNIT
Cuvette: A cuvette is a container for liquid samples, with an opened square hole on the top,
for pouring into the sample. The general materials of a cuvette can be glass, quartz (for UV),
or plastic, and so on. The width of a cuvette affects the path length of the beam getting
through the sample, resulting in different absorbance. The most common cuvettes are 10mm
(1cm) wide. Some "micro cuvettes" are designed for a tiny amount of samples, such as DNA
and RNA samples. Or some long optical path, 10cm wide cuvette for low concentration
samples.
Cuvette Holder: The cuvette is placed on the cuvette holder, which is usually a four-channel
manual pull-push holder with a rod for four cuvettes. There are hollowed-out holes on the
sides of the holder, which allow the beam to pass through the sample. There are also
automatic cuvette holder in some higher-end spectrophotometer, which switches the
cuvettes one by one automatically, by the preset program.
3. LIGHT DETECTION & PROCESSING UNIT
Light Detector: The most common light detector is silicon photodiodes. The signal outputs
from the photodiode is voltage, which is an analog signal. So, it will need an analog to digital
converter (A/D converter), to digitalize the intensity of the light.
Digital Signal Processor: The processor can process the digital signals from the light sensor,
and simultaneously control the step motors and moving parts in the instrument. The result
received from the light detector is processed a series of absorbance values that the user can
read.
4. DISPLAY & USER INTERFACE
LCD Screen & Keyboard: LCD screen has different sizes and resolutions on a
spectrophotometer. On a high-end spectrophotometer, the resolution of the screen accepts
the spectrum to be displayed directly. And the operation can be down via the touch screen.
SYED MUHAMMAD KHAN (BS HONS. ZOOLOGY)
pg. 3
USB Connection: It allows the users to connect the spectrophotometer to a computer, or one
can insert a USB stick to export measurement results. Via this feature, one can use a computer
to draw a spectrum, or export a report to a PDF file, etc.
SINGLE BEAM & DOUBLE BEAM SPECTROPHOTOMETERS
Spectrophotometers can either use a single beam or two beams:
1. DOUBLE BEAM SPECTROPHOTOMETER: It compares the light intensity between two
light paths, one path containing a reference sample and the other the test sample.
2. SINGLE BEAM SPECTROPHOTOMETER: It measures the relative light intensity of the
beam before and after a test sample is inserted.
Figure: Single Beam Spectrophotometer
Although comparison measurements from double-beam instruments are easier and more
stable, single-beam instruments can have a larger dynamic range and are optically simpler
and more compact. Additionally, some specialized instruments, such as spectrophotometers
built onto microscopes or telescopes, are single-beam instruments due to practicality.
TRANSMISSION & REFLECTANCE MEASUREMENTS
The lights rays may be measured either after they have passed through a sample or reflected
off its surface:
1. TRANSMISSION MEASUREMENTS: The spectrophotometer quantitatively compares the
fraction of light that passes through a reference solution and a test solution, then
electronically compares the intensities of the two signals and computes the percentage
of transmission of the sample compared to the reference standard.
2. REFLECTANCE MEASUREMENTS: The spectrophotometer quantitatively compares the
fraction of light that reflects from the reference and test samples.
SYED MUHAMMAD KHAN (BS HONS. ZOOLOGY)
pg. 4
WORKING OF A SPECTROPHOTOMETER
Light from the source lamp is passed through a monochromator, which diffracts the light into
a "rainbow" of wavelengths through a rotating prism and outputs narrow bandwidths of this
diffracted spectrum through a mechanical slit on the output side of the monochromator.
These bandwidths are transmitted through the test sample. The transmittance or reflectance
value for each wavelength of the test sample is then compared with the transmission or
reflectance values from the reference sample. Most instruments will apply a logarithmic
function to the linear transmittance ratio to calculate the 'absorbency' of the sample, a value
which is proportional to the 'concentration' of the chemical being measured. In short, the
sequence of events in a scanning spectrophotometer is as follows:
 The light source is shone into a monochromator, diffracted into a rainbow, and split into
two beams. It is then scanned through the sample and the reference solutions.
 Fractions of the incident wavelengths are transmitted through, or reflected from, the
sample and the reference.
 The resultant light strikes the photodetector device, which compares the relative intensity
of the two beams.
 Electronic circuits convert the relative currents into linear transmission percentages
and/or absorbance/concentration values.
ABSORBANCE & OPTICAL DENSITY
Absorbance measures the ability of a refractive medium or optical component to absorb light.
It measures how much light is lost during the light's passage through the given medium. It is
given by the following formula:
Where: A is absorbance, Io is the intensity of the light entering
the specimen and I is the intensity of the light leaving the sample.
The optical density of a substance is the logarithmic ratio of the intensity of transmitted light
to the intensity of the incident light passing through the substance. It is otherwise measured
as the absorbed radiation of the corresponding wavelength. Optical density refers to the
absorbance of a substance. It is given by the following formula:
Where, OD is optical density and T is transmittance (the ratio of
the light energy falling on a body to that transmitted through it).
APPLICATIONS IN BIOCHEMISTRY
Spectrophotometry is an important technique used in many biochemical experiments that
involve DNA, RNA, and protein isolation, enzyme kinetics, and biochemical analyses. Since
samples in these applications are not readily available in large quantities, they are especially
SYED MUHAMMAD KHAN (BS HONS. ZOOLOGY)
pg. 5
suited to being analyzed in this non-destructive technique. Also, precious samples can be
saved by utilizing a micro-volume platform, where, as little as 1µL of sample is required for
complete analyses. A brief explanation of the procedure of spectrophotometry includes
comparing the absorbency of a blank sample that does not contain a colored compound to a
sample that contains a colored compound. This coloring can be accomplished by either a dye
such as Coomassie Brilliant Blue G-250 dye measured at 595 nm or by an enzymatic reaction
as seen between β-galactosidase and ONPG (turns sample yellow) measured at 420 nm. Some
important applications of spectrophotometry in biochemistry are as follows:
 In biochemical experiments, a chemical and/or physical property is chosen and the
procedure that is used is specific to that property to derive more information about the
sample, such as the quantity, purity, enzyme activity, etc.
 Spectrophotometry can be used for several techniques such as determining optimal
wavelength absorbance of samples, determining optimal pH for absorbance of samples,
determining concentrations of unknown samples, and determining the pKa of various
samples.
 Spectrophotometry is also a helpful process for protein purification.
 It can also be used as a method to create optical assays of a compound.
 Spectrophotometric data can also be used in conjunction with the Beer-Lambert Equation
to determine various relationships between transmittance and concentration, and
absorbance and concentration.
TURBIDIMETRY
The turbidimetric method uses spectrophotometers or colorimeters to measure the number
of bacterial cells in a solution based on the turbidity of the solution, due to their presence.
Microbiologists use turbidity as a measure of cell density within a culture sample.
Microbiologists use photometers and spectrophotometers that shine different types of light
through culture samples to determine turbidity. The general assumption is that the higher the
turbidity, the higher number of cells within the culture. It is one of the most popular methods
for estimating microbial population of a medium and also to note the rate of growth. But it
does have some limitations:
 The culture to be measured must be dense enough to register some turbidity on the
instrument.
 It may not be possible to measure cultures grown on a deeply colored media.
 It may not be possible to measure cultures that contain suspended material other than
bacteria.
 Both dead and living cells contribute to the turbidity.
UV-VISIBLE & IR SPECTROPHOTOMETRY
SYED MUHAMMAD KHAN (BS HONS. ZOOLOGY)
pg. 6
The details of the two most common types of spectrophotometric techniques, UV-Visible
spectrophotometry and Infrared Spectrophotometry, are as follows:
1. UV-VISIBLE SPECTROPHOTOMETRY: Many spectrophotometers are used in the UV
and visible regions of the spectrum. Ultraviolet-Visible (UV-VIS) spectroscopy involves
energy levels that excite electronic transitions. Absorption of UV-VIS light excites
molecules that are in ground-states to their excited-states. Visible region 400 – 700 nm
spectrophotometry is used extensively in colorimetry science. Scientists use this
instrument to measure the amount of compounds in a sample. If the compound is more
concentrated more light will be absorbed by the sample. Samples are usually prepared in
cuvettes; depending on the region of interest, they may be constructed of glass, plastic
(visible spectrum region of interest), or quartz (Far UV spectrum region of interest). Some
applications require small volume measurements which can be performed with micro-
volume platforms.
2. IR SPECTROPHOTOMETRY: Spectrophotometers designed for the infrared region are
quite different because of the technical requirements of measurement in that region. One
major factor is the type of photo-sensors that are available for different spectral regions,
but the infrared measurement is also challenging because virtually everything emits IR
light as thermal radiation. Another complication is that quite a few materials such as glass
and plastic absorb infrared light, making it incompatible as an optical medium. Ideal
optical materials are salts, which do not absorb strongly. Samples for IR
spectrophotometry may be smeared between two discs of potassium bromide or ground
with potassium bromide and pressed into a pellet. Where aqueous solutions are to be
measured, insoluble silver chloride is used to construct the cell.

More Related Content

What's hot

Light phase contrast and fluorescence microscopy
Light phase contrast and fluorescence microscopyLight phase contrast and fluorescence microscopy
Light phase contrast and fluorescence microscopy
Keerthana Chithanathan
 
Spectrophotometer
SpectrophotometerSpectrophotometer
Spectrophotometer
Asad Leo
 
Spectrophotometry : Instruments & Applications
Spectrophotometry : Instruments & ApplicationsSpectrophotometry : Instruments & Applications
Spectrophotometry : Instruments & Applications
reyhane mazahernasab
 
Spectrophotometry
SpectrophotometrySpectrophotometry
Spectrophotometry
suniu
 

What's hot (20)

Light phase contrast and fluorescence microscopy
Light phase contrast and fluorescence microscopyLight phase contrast and fluorescence microscopy
Light phase contrast and fluorescence microscopy
 
Fluoresence microscope
Fluoresence microscopeFluoresence microscope
Fluoresence microscope
 
Spectrophotometer
SpectrophotometerSpectrophotometer
Spectrophotometer
 
Light microscope
Light microscopeLight microscope
Light microscope
 
Spectrophotometry : Instruments & Applications
Spectrophotometry : Instruments & ApplicationsSpectrophotometry : Instruments & Applications
Spectrophotometry : Instruments & Applications
 
Microscopy .
Microscopy .Microscopy .
Microscopy .
 
Radioisotope technique and methods
Radioisotope technique and methodsRadioisotope technique and methods
Radioisotope technique and methods
 
Light microscope
Light microscopeLight microscope
Light microscope
 
Microscopy - Magnification, Resolving power, Principles, Types and Applications
Microscopy - Magnification, Resolving power, Principles, Types and ApplicationsMicroscopy - Magnification, Resolving power, Principles, Types and Applications
Microscopy - Magnification, Resolving power, Principles, Types and Applications
 
Fluorescence microscopy
Fluorescence microscopyFluorescence microscopy
Fluorescence microscopy
 
Confocal microscopy by prabhat
Confocal microscopy by prabhatConfocal microscopy by prabhat
Confocal microscopy by prabhat
 
Isolation Of Algae
Isolation Of AlgaeIsolation Of Algae
Isolation Of Algae
 
Light Microscopy
Light MicroscopyLight Microscopy
Light Microscopy
 
Fluorescence Microscopy
Fluorescence MicroscopyFluorescence Microscopy
Fluorescence Microscopy
 
Spetrophotometer
SpetrophotometerSpetrophotometer
Spetrophotometer
 
Spectrophotometry
SpectrophotometrySpectrophotometry
Spectrophotometry
 
Light microscope
Light microscopeLight microscope
Light microscope
 
Bright field microscopy, Principle and applications
Bright field microscopy, Principle and applicationsBright field microscopy, Principle and applications
Bright field microscopy, Principle and applications
 
Taxonomic key
Taxonomic keyTaxonomic key
Taxonomic key
 
Confocal microscope presentation pt
Confocal microscope presentation  ptConfocal microscope presentation  pt
Confocal microscope presentation pt
 

Similar to Spectrophotometry In Biology

Spectrophoto meter
Spectrophoto meterSpectrophoto meter
Spectrophoto meter
Nasir Nazeer
 
Biomolecular andcellularresearchdevices fin
Biomolecular andcellularresearchdevices finBiomolecular andcellularresearchdevices fin
Biomolecular andcellularresearchdevices fin
MUBOSScz
 

Similar to Spectrophotometry In Biology (20)

spectrophotometer 2.pdf
spectrophotometer 2.pdfspectrophotometer 2.pdf
spectrophotometer 2.pdf
 
Spectroscopy.pptx
Spectroscopy.pptxSpectroscopy.pptx
Spectroscopy.pptx
 
Spectrophotometry & Calorimetry.pptx
Spectrophotometry & Calorimetry.pptxSpectrophotometry & Calorimetry.pptx
Spectrophotometry & Calorimetry.pptx
 
Single beam spectrophotometer
Single beam spectrophotometer Single beam spectrophotometer
Single beam spectrophotometer
 
Spectrophotometer introducing
Spectrophotometer  introducingSpectrophotometer  introducing
Spectrophotometer introducing
 
Spectrophoto meter
Spectrophoto meterSpectrophoto meter
Spectrophoto meter
 
Spectrophotometer by Kainat Ramzan
Spectrophotometer by Kainat RamzanSpectrophotometer by Kainat Ramzan
Spectrophotometer by Kainat Ramzan
 
Uv visible spectroscopy
Uv visible spectroscopyUv visible spectroscopy
Uv visible spectroscopy
 
UV ray spectrophotometer
UV ray spectrophotometerUV ray spectrophotometer
UV ray spectrophotometer
 
Spectrophotometry and colorimetry.pdf
Spectrophotometry and colorimetry.pdfSpectrophotometry and colorimetry.pdf
Spectrophotometry and colorimetry.pdf
 
UV rays
UV rays UV rays
UV rays
 
performance and specifications of spectrophotometer
performance and specifications of spectrophotometerperformance and specifications of spectrophotometer
performance and specifications of spectrophotometer
 
Spectrophotometry
SpectrophotometrySpectrophotometry
Spectrophotometry
 
Biomolecular andcellularresearchdevices fin
Biomolecular andcellularresearchdevices finBiomolecular andcellularresearchdevices fin
Biomolecular andcellularresearchdevices fin
 
Spectrophotometer
SpectrophotometerSpectrophotometer
Spectrophotometer
 
Uv/visible spectroscopy
Uv/visible spectroscopyUv/visible spectroscopy
Uv/visible spectroscopy
 
Uv
UvUv
Uv
 
Spectrophotometer.pptx
Spectrophotometer.pptxSpectrophotometer.pptx
Spectrophotometer.pptx
 
ppt spectrophotometer.pptx
ppt spectrophotometer.pptxppt spectrophotometer.pptx
ppt spectrophotometer.pptx
 
Spectrophotometry in clinical chemistry
Spectrophotometry in clinical chemistrySpectrophotometry in clinical chemistry
Spectrophotometry in clinical chemistry
 

More from Syed Muhammad Khan

More from Syed Muhammad Khan (20)

International Agencies Involved in Conservation & Management of Wildlife
International Agencies Involved in Conservation & Management of WildlifeInternational Agencies Involved in Conservation & Management of Wildlife
International Agencies Involved in Conservation & Management of Wildlife
 
International Agencies Involved in Conservation & Management of Wildlife
International Agencies Involved in Conservation & Management of WildlifeInternational Agencies Involved in Conservation & Management of Wildlife
International Agencies Involved in Conservation & Management of Wildlife
 
Types of Bacteria
Types of BacteriaTypes of Bacteria
Types of Bacteria
 
Translational Regulation of Development
Translational Regulation of DevelopmentTranslational Regulation of Development
Translational Regulation of Development
 
Oligotrophic Microbes - Life at Low Nutrient Concentrations
Oligotrophic Microbes - Life at Low Nutrient ConcentrationsOligotrophic Microbes - Life at Low Nutrient Concentrations
Oligotrophic Microbes - Life at Low Nutrient Concentrations
 
Differential RNA Processing & Animal Development
Differential RNA Processing & Animal DevelopmentDifferential RNA Processing & Animal Development
Differential RNA Processing & Animal Development
 
Differential Cell Affinity
Differential Cell AffinityDifferential Cell Affinity
Differential Cell Affinity
 
Cell Adhesion Molecules
Cell Adhesion MoleculesCell Adhesion Molecules
Cell Adhesion Molecules
 
Barriers to Animal Dispersal
Barriers to Animal DispersalBarriers to Animal Dispersal
Barriers to Animal Dispersal
 
Australian Region
Australian RegionAustralian Region
Australian Region
 
Affinity Chromatography
Affinity ChromatographyAffinity Chromatography
Affinity Chromatography
 
Synaptic Transmission
Synaptic TransmissionSynaptic Transmission
Synaptic Transmission
 
Use of Centrifuge
Use of CentrifugeUse of Centrifuge
Use of Centrifuge
 
Types of Bacteria
Types of BacteriaTypes of Bacteria
Types of Bacteria
 
Transposable Elements or Transposition
Transposable Elements or TranspositionTransposable Elements or Transposition
Transposable Elements or Transposition
 
Translational Regulation of Development
Translational Regulation of DevelopmentTranslational Regulation of Development
Translational Regulation of Development
 
Transduction
TransductionTransduction
Transduction
 
Thin Layer Chromatography
Thin Layer ChromatographyThin Layer Chromatography
Thin Layer Chromatography
 
Teratogenesis
TeratogenesisTeratogenesis
Teratogenesis
 
Bioenergetics & Regulation of Glycolysis
Bioenergetics & Regulation of GlycolysisBioenergetics & Regulation of Glycolysis
Bioenergetics & Regulation of Glycolysis
 

Recently uploaded

Discovery of an Accretion Streamer and a Slow Wide-angle Outflow around FUOri...
Discovery of an Accretion Streamer and a Slow Wide-angle Outflow around FUOri...Discovery of an Accretion Streamer and a Slow Wide-angle Outflow around FUOri...
Discovery of an Accretion Streamer and a Slow Wide-angle Outflow around FUOri...
Sérgio Sacani
 
Pests of mustard_Identification_Management_Dr.UPR.pdf
Pests of mustard_Identification_Management_Dr.UPR.pdfPests of mustard_Identification_Management_Dr.UPR.pdf
Pests of mustard_Identification_Management_Dr.UPR.pdf
PirithiRaju
 
Biopesticide (2).pptx .This slides helps to know the different types of biop...
Biopesticide (2).pptx  .This slides helps to know the different types of biop...Biopesticide (2).pptx  .This slides helps to know the different types of biop...
Biopesticide (2).pptx .This slides helps to know the different types of biop...
RohitNehra6
 
GUIDELINES ON SIMILAR BIOLOGICS Regulatory Requirements for Marketing Authori...
GUIDELINES ON SIMILAR BIOLOGICS Regulatory Requirements for Marketing Authori...GUIDELINES ON SIMILAR BIOLOGICS Regulatory Requirements for Marketing Authori...
GUIDELINES ON SIMILAR BIOLOGICS Regulatory Requirements for Marketing Authori...
Lokesh Kothari
 
Pests of cotton_Sucking_Pests_Dr.UPR.pdf
Pests of cotton_Sucking_Pests_Dr.UPR.pdfPests of cotton_Sucking_Pests_Dr.UPR.pdf
Pests of cotton_Sucking_Pests_Dr.UPR.pdf
PirithiRaju
 
Biogenic Sulfur Gases as Biosignatures on Temperate Sub-Neptune Waterworlds
Biogenic Sulfur Gases as Biosignatures on Temperate Sub-Neptune WaterworldsBiogenic Sulfur Gases as Biosignatures on Temperate Sub-Neptune Waterworlds
Biogenic Sulfur Gases as Biosignatures on Temperate Sub-Neptune Waterworlds
Sérgio Sacani
 
Seismic Method Estimate velocity from seismic data.pptx
Seismic Method Estimate velocity from seismic  data.pptxSeismic Method Estimate velocity from seismic  data.pptx
Seismic Method Estimate velocity from seismic data.pptx
AlMamun560346
 
Labelling Requirements and Label Claims for Dietary Supplements and Recommend...
Labelling Requirements and Label Claims for Dietary Supplements and Recommend...Labelling Requirements and Label Claims for Dietary Supplements and Recommend...
Labelling Requirements and Label Claims for Dietary Supplements and Recommend...
Lokesh Kothari
 

Recently uploaded (20)

9654467111 Call Girls In Raj Nagar Delhi Short 1500 Night 6000
9654467111 Call Girls In Raj Nagar Delhi Short 1500 Night 60009654467111 Call Girls In Raj Nagar Delhi Short 1500 Night 6000
9654467111 Call Girls In Raj Nagar Delhi Short 1500 Night 6000
 
Zoology 4th semester series (krishna).pdf
Zoology 4th semester series (krishna).pdfZoology 4th semester series (krishna).pdf
Zoology 4th semester series (krishna).pdf
 
Discovery of an Accretion Streamer and a Slow Wide-angle Outflow around FUOri...
Discovery of an Accretion Streamer and a Slow Wide-angle Outflow around FUOri...Discovery of an Accretion Streamer and a Slow Wide-angle Outflow around FUOri...
Discovery of an Accretion Streamer and a Slow Wide-angle Outflow around FUOri...
 
High Class Escorts in Hyderabad ₹7.5k Pick Up & Drop With Cash Payment 969456...
High Class Escorts in Hyderabad ₹7.5k Pick Up & Drop With Cash Payment 969456...High Class Escorts in Hyderabad ₹7.5k Pick Up & Drop With Cash Payment 969456...
High Class Escorts in Hyderabad ₹7.5k Pick Up & Drop With Cash Payment 969456...
 
Pests of mustard_Identification_Management_Dr.UPR.pdf
Pests of mustard_Identification_Management_Dr.UPR.pdfPests of mustard_Identification_Management_Dr.UPR.pdf
Pests of mustard_Identification_Management_Dr.UPR.pdf
 
Biopesticide (2).pptx .This slides helps to know the different types of biop...
Biopesticide (2).pptx  .This slides helps to know the different types of biop...Biopesticide (2).pptx  .This slides helps to know the different types of biop...
Biopesticide (2).pptx .This slides helps to know the different types of biop...
 
❤Jammu Kashmir Call Girls 8617697112 Personal Whatsapp Number 💦✅.
❤Jammu Kashmir Call Girls 8617697112 Personal Whatsapp Number 💦✅.❤Jammu Kashmir Call Girls 8617697112 Personal Whatsapp Number 💦✅.
❤Jammu Kashmir Call Girls 8617697112 Personal Whatsapp Number 💦✅.
 
Creating and Analyzing Definitive Screening Designs
Creating and Analyzing Definitive Screening DesignsCreating and Analyzing Definitive Screening Designs
Creating and Analyzing Definitive Screening Designs
 
GUIDELINES ON SIMILAR BIOLOGICS Regulatory Requirements for Marketing Authori...
GUIDELINES ON SIMILAR BIOLOGICS Regulatory Requirements for Marketing Authori...GUIDELINES ON SIMILAR BIOLOGICS Regulatory Requirements for Marketing Authori...
GUIDELINES ON SIMILAR BIOLOGICS Regulatory Requirements for Marketing Authori...
 
Isotopic evidence of long-lived volcanism on Io
Isotopic evidence of long-lived volcanism on IoIsotopic evidence of long-lived volcanism on Io
Isotopic evidence of long-lived volcanism on Io
 
Stunning ➥8448380779▻ Call Girls In Panchshil Enclave Delhi NCR
Stunning ➥8448380779▻ Call Girls In Panchshil Enclave Delhi NCRStunning ➥8448380779▻ Call Girls In Panchshil Enclave Delhi NCR
Stunning ➥8448380779▻ Call Girls In Panchshil Enclave Delhi NCR
 
GBSN - Biochemistry (Unit 1)
GBSN - Biochemistry (Unit 1)GBSN - Biochemistry (Unit 1)
GBSN - Biochemistry (Unit 1)
 
Pests of cotton_Sucking_Pests_Dr.UPR.pdf
Pests of cotton_Sucking_Pests_Dr.UPR.pdfPests of cotton_Sucking_Pests_Dr.UPR.pdf
Pests of cotton_Sucking_Pests_Dr.UPR.pdf
 
Chemistry 4th semester series (krishna).pdf
Chemistry 4th semester series (krishna).pdfChemistry 4th semester series (krishna).pdf
Chemistry 4th semester series (krishna).pdf
 
Recombinant DNA technology (Immunological screening)
Recombinant DNA technology (Immunological screening)Recombinant DNA technology (Immunological screening)
Recombinant DNA technology (Immunological screening)
 
COST ESTIMATION FOR A RESEARCH PROJECT.pptx
COST ESTIMATION FOR A RESEARCH PROJECT.pptxCOST ESTIMATION FOR A RESEARCH PROJECT.pptx
COST ESTIMATION FOR A RESEARCH PROJECT.pptx
 
Biogenic Sulfur Gases as Biosignatures on Temperate Sub-Neptune Waterworlds
Biogenic Sulfur Gases as Biosignatures on Temperate Sub-Neptune WaterworldsBiogenic Sulfur Gases as Biosignatures on Temperate Sub-Neptune Waterworlds
Biogenic Sulfur Gases as Biosignatures on Temperate Sub-Neptune Waterworlds
 
Hire 💕 9907093804 Hooghly Call Girls Service Call Girls Agency
Hire 💕 9907093804 Hooghly Call Girls Service Call Girls AgencyHire 💕 9907093804 Hooghly Call Girls Service Call Girls Agency
Hire 💕 9907093804 Hooghly Call Girls Service Call Girls Agency
 
Seismic Method Estimate velocity from seismic data.pptx
Seismic Method Estimate velocity from seismic  data.pptxSeismic Method Estimate velocity from seismic  data.pptx
Seismic Method Estimate velocity from seismic data.pptx
 
Labelling Requirements and Label Claims for Dietary Supplements and Recommend...
Labelling Requirements and Label Claims for Dietary Supplements and Recommend...Labelling Requirements and Label Claims for Dietary Supplements and Recommend...
Labelling Requirements and Label Claims for Dietary Supplements and Recommend...
 

Spectrophotometry In Biology

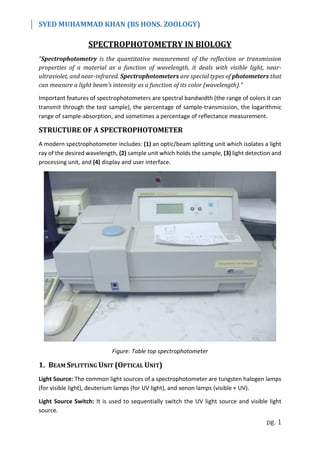
  • 1. SYED MUHAMMAD KHAN (BS HONS. ZOOLOGY) pg. 1 SPECTROPHOTOMETRY IN BIOLOGY “Spectrophotometry is the quantitative measurement of the reflection or transmission properties of a material as a function of wavelength, it deals with visible light, near- ultraviolet, and near-infrared. Spectrophotometers are special types of photometers that can measure a light beam's intensity as a function of its color (wavelength).” Important features of spectrophotometers are spectral bandwidth (the range of colors it can transmit through the test sample), the percentage of sample-transmission, the logarithmic range of sample-absorption, and sometimes a percentage of reflectance measurement. STRUCTURE OF A SPECTROPHOTOMETER A modern spectrophotometer includes: (1) an optic/beam splitting unit which isolates a light ray of the desired wavelength, (2) sample unit which holds the sample, (3) light detection and processing unit, and (4) display and user interface. Figure: Table top spectrophotometer 1. BEAM SPLITTING UNIT (OPTICAL UNIT) Light Source: The common light sources of a spectrophotometer are tungsten halogen lamps (for visible light), deuterium lamps (for UV light), and xenon lamps (visible + UV). Light Source Switch: It is used to sequentially switch the UV light source and visible light source.
  • 2. SYED MUHAMMAD KHAN (BS HONS. ZOOLOGY) pg. 2 Collimating Mirror (Reflector & Light-in Slit): Before the light been spitted into a single color beam, the original light from the lamps can be preprocessed into a straight parallel light rays by these optic devices. Grating: The surface of a grating is a jagged mirror. It is used to disperse the original color- mixed “white light” into several individual color light (it has replaced prisms). Collimating Mirror (Light-out Slit): After the white light is dispersed into pure individual colors, the light is unfolded like a folding fan. By rotating the angle of a collimating mirror, a specific wavelength of the color light can be aligned on the light-out slit. After the color light passing through the slit, the unwanted wavelengths are filtered out, and a single pure light (of the desired wavelength) is produced. 2. SAMPLE UNIT Cuvette: A cuvette is a container for liquid samples, with an opened square hole on the top, for pouring into the sample. The general materials of a cuvette can be glass, quartz (for UV), or plastic, and so on. The width of a cuvette affects the path length of the beam getting through the sample, resulting in different absorbance. The most common cuvettes are 10mm (1cm) wide. Some "micro cuvettes" are designed for a tiny amount of samples, such as DNA and RNA samples. Or some long optical path, 10cm wide cuvette for low concentration samples. Cuvette Holder: The cuvette is placed on the cuvette holder, which is usually a four-channel manual pull-push holder with a rod for four cuvettes. There are hollowed-out holes on the sides of the holder, which allow the beam to pass through the sample. There are also automatic cuvette holder in some higher-end spectrophotometer, which switches the cuvettes one by one automatically, by the preset program. 3. LIGHT DETECTION & PROCESSING UNIT Light Detector: The most common light detector is silicon photodiodes. The signal outputs from the photodiode is voltage, which is an analog signal. So, it will need an analog to digital converter (A/D converter), to digitalize the intensity of the light. Digital Signal Processor: The processor can process the digital signals from the light sensor, and simultaneously control the step motors and moving parts in the instrument. The result received from the light detector is processed a series of absorbance values that the user can read. 4. DISPLAY & USER INTERFACE LCD Screen & Keyboard: LCD screen has different sizes and resolutions on a spectrophotometer. On a high-end spectrophotometer, the resolution of the screen accepts the spectrum to be displayed directly. And the operation can be down via the touch screen.
  • 3. SYED MUHAMMAD KHAN (BS HONS. ZOOLOGY) pg. 3 USB Connection: It allows the users to connect the spectrophotometer to a computer, or one can insert a USB stick to export measurement results. Via this feature, one can use a computer to draw a spectrum, or export a report to a PDF file, etc. SINGLE BEAM & DOUBLE BEAM SPECTROPHOTOMETERS Spectrophotometers can either use a single beam or two beams: 1. DOUBLE BEAM SPECTROPHOTOMETER: It compares the light intensity between two light paths, one path containing a reference sample and the other the test sample. 2. SINGLE BEAM SPECTROPHOTOMETER: It measures the relative light intensity of the beam before and after a test sample is inserted. Figure: Single Beam Spectrophotometer Although comparison measurements from double-beam instruments are easier and more stable, single-beam instruments can have a larger dynamic range and are optically simpler and more compact. Additionally, some specialized instruments, such as spectrophotometers built onto microscopes or telescopes, are single-beam instruments due to practicality. TRANSMISSION & REFLECTANCE MEASUREMENTS The lights rays may be measured either after they have passed through a sample or reflected off its surface: 1. TRANSMISSION MEASUREMENTS: The spectrophotometer quantitatively compares the fraction of light that passes through a reference solution and a test solution, then electronically compares the intensities of the two signals and computes the percentage of transmission of the sample compared to the reference standard. 2. REFLECTANCE MEASUREMENTS: The spectrophotometer quantitatively compares the fraction of light that reflects from the reference and test samples.
  • 4. SYED MUHAMMAD KHAN (BS HONS. ZOOLOGY) pg. 4 WORKING OF A SPECTROPHOTOMETER Light from the source lamp is passed through a monochromator, which diffracts the light into a "rainbow" of wavelengths through a rotating prism and outputs narrow bandwidths of this diffracted spectrum through a mechanical slit on the output side of the monochromator. These bandwidths are transmitted through the test sample. The transmittance or reflectance value for each wavelength of the test sample is then compared with the transmission or reflectance values from the reference sample. Most instruments will apply a logarithmic function to the linear transmittance ratio to calculate the 'absorbency' of the sample, a value which is proportional to the 'concentration' of the chemical being measured. In short, the sequence of events in a scanning spectrophotometer is as follows:  The light source is shone into a monochromator, diffracted into a rainbow, and split into two beams. It is then scanned through the sample and the reference solutions.  Fractions of the incident wavelengths are transmitted through, or reflected from, the sample and the reference.  The resultant light strikes the photodetector device, which compares the relative intensity of the two beams.  Electronic circuits convert the relative currents into linear transmission percentages and/or absorbance/concentration values. ABSORBANCE & OPTICAL DENSITY Absorbance measures the ability of a refractive medium or optical component to absorb light. It measures how much light is lost during the light's passage through the given medium. It is given by the following formula: Where: A is absorbance, Io is the intensity of the light entering the specimen and I is the intensity of the light leaving the sample. The optical density of a substance is the logarithmic ratio of the intensity of transmitted light to the intensity of the incident light passing through the substance. It is otherwise measured as the absorbed radiation of the corresponding wavelength. Optical density refers to the absorbance of a substance. It is given by the following formula: Where, OD is optical density and T is transmittance (the ratio of the light energy falling on a body to that transmitted through it). APPLICATIONS IN BIOCHEMISTRY Spectrophotometry is an important technique used in many biochemical experiments that involve DNA, RNA, and protein isolation, enzyme kinetics, and biochemical analyses. Since samples in these applications are not readily available in large quantities, they are especially
  • 5. SYED MUHAMMAD KHAN (BS HONS. ZOOLOGY) pg. 5 suited to being analyzed in this non-destructive technique. Also, precious samples can be saved by utilizing a micro-volume platform, where, as little as 1µL of sample is required for complete analyses. A brief explanation of the procedure of spectrophotometry includes comparing the absorbency of a blank sample that does not contain a colored compound to a sample that contains a colored compound. This coloring can be accomplished by either a dye such as Coomassie Brilliant Blue G-250 dye measured at 595 nm or by an enzymatic reaction as seen between β-galactosidase and ONPG (turns sample yellow) measured at 420 nm. Some important applications of spectrophotometry in biochemistry are as follows:  In biochemical experiments, a chemical and/or physical property is chosen and the procedure that is used is specific to that property to derive more information about the sample, such as the quantity, purity, enzyme activity, etc.  Spectrophotometry can be used for several techniques such as determining optimal wavelength absorbance of samples, determining optimal pH for absorbance of samples, determining concentrations of unknown samples, and determining the pKa of various samples.  Spectrophotometry is also a helpful process for protein purification.  It can also be used as a method to create optical assays of a compound.  Spectrophotometric data can also be used in conjunction with the Beer-Lambert Equation to determine various relationships between transmittance and concentration, and absorbance and concentration. TURBIDIMETRY The turbidimetric method uses spectrophotometers or colorimeters to measure the number of bacterial cells in a solution based on the turbidity of the solution, due to their presence. Microbiologists use turbidity as a measure of cell density within a culture sample. Microbiologists use photometers and spectrophotometers that shine different types of light through culture samples to determine turbidity. The general assumption is that the higher the turbidity, the higher number of cells within the culture. It is one of the most popular methods for estimating microbial population of a medium and also to note the rate of growth. But it does have some limitations:  The culture to be measured must be dense enough to register some turbidity on the instrument.  It may not be possible to measure cultures grown on a deeply colored media.  It may not be possible to measure cultures that contain suspended material other than bacteria.  Both dead and living cells contribute to the turbidity. UV-VISIBLE & IR SPECTROPHOTOMETRY
  • 6. SYED MUHAMMAD KHAN (BS HONS. ZOOLOGY) pg. 6 The details of the two most common types of spectrophotometric techniques, UV-Visible spectrophotometry and Infrared Spectrophotometry, are as follows: 1. UV-VISIBLE SPECTROPHOTOMETRY: Many spectrophotometers are used in the UV and visible regions of the spectrum. Ultraviolet-Visible (UV-VIS) spectroscopy involves energy levels that excite electronic transitions. Absorption of UV-VIS light excites molecules that are in ground-states to their excited-states. Visible region 400 – 700 nm spectrophotometry is used extensively in colorimetry science. Scientists use this instrument to measure the amount of compounds in a sample. If the compound is more concentrated more light will be absorbed by the sample. Samples are usually prepared in cuvettes; depending on the region of interest, they may be constructed of glass, plastic (visible spectrum region of interest), or quartz (Far UV spectrum region of interest). Some applications require small volume measurements which can be performed with micro- volume platforms. 2. IR SPECTROPHOTOMETRY: Spectrophotometers designed for the infrared region are quite different because of the technical requirements of measurement in that region. One major factor is the type of photo-sensors that are available for different spectral regions, but the infrared measurement is also challenging because virtually everything emits IR light as thermal radiation. Another complication is that quite a few materials such as glass and plastic absorb infrared light, making it incompatible as an optical medium. Ideal optical materials are salts, which do not absorb strongly. Samples for IR spectrophotometry may be smeared between two discs of potassium bromide or ground with potassium bromide and pressed into a pellet. Where aqueous solutions are to be measured, insoluble silver chloride is used to construct the cell.