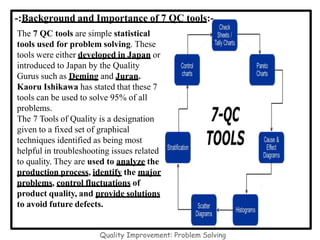
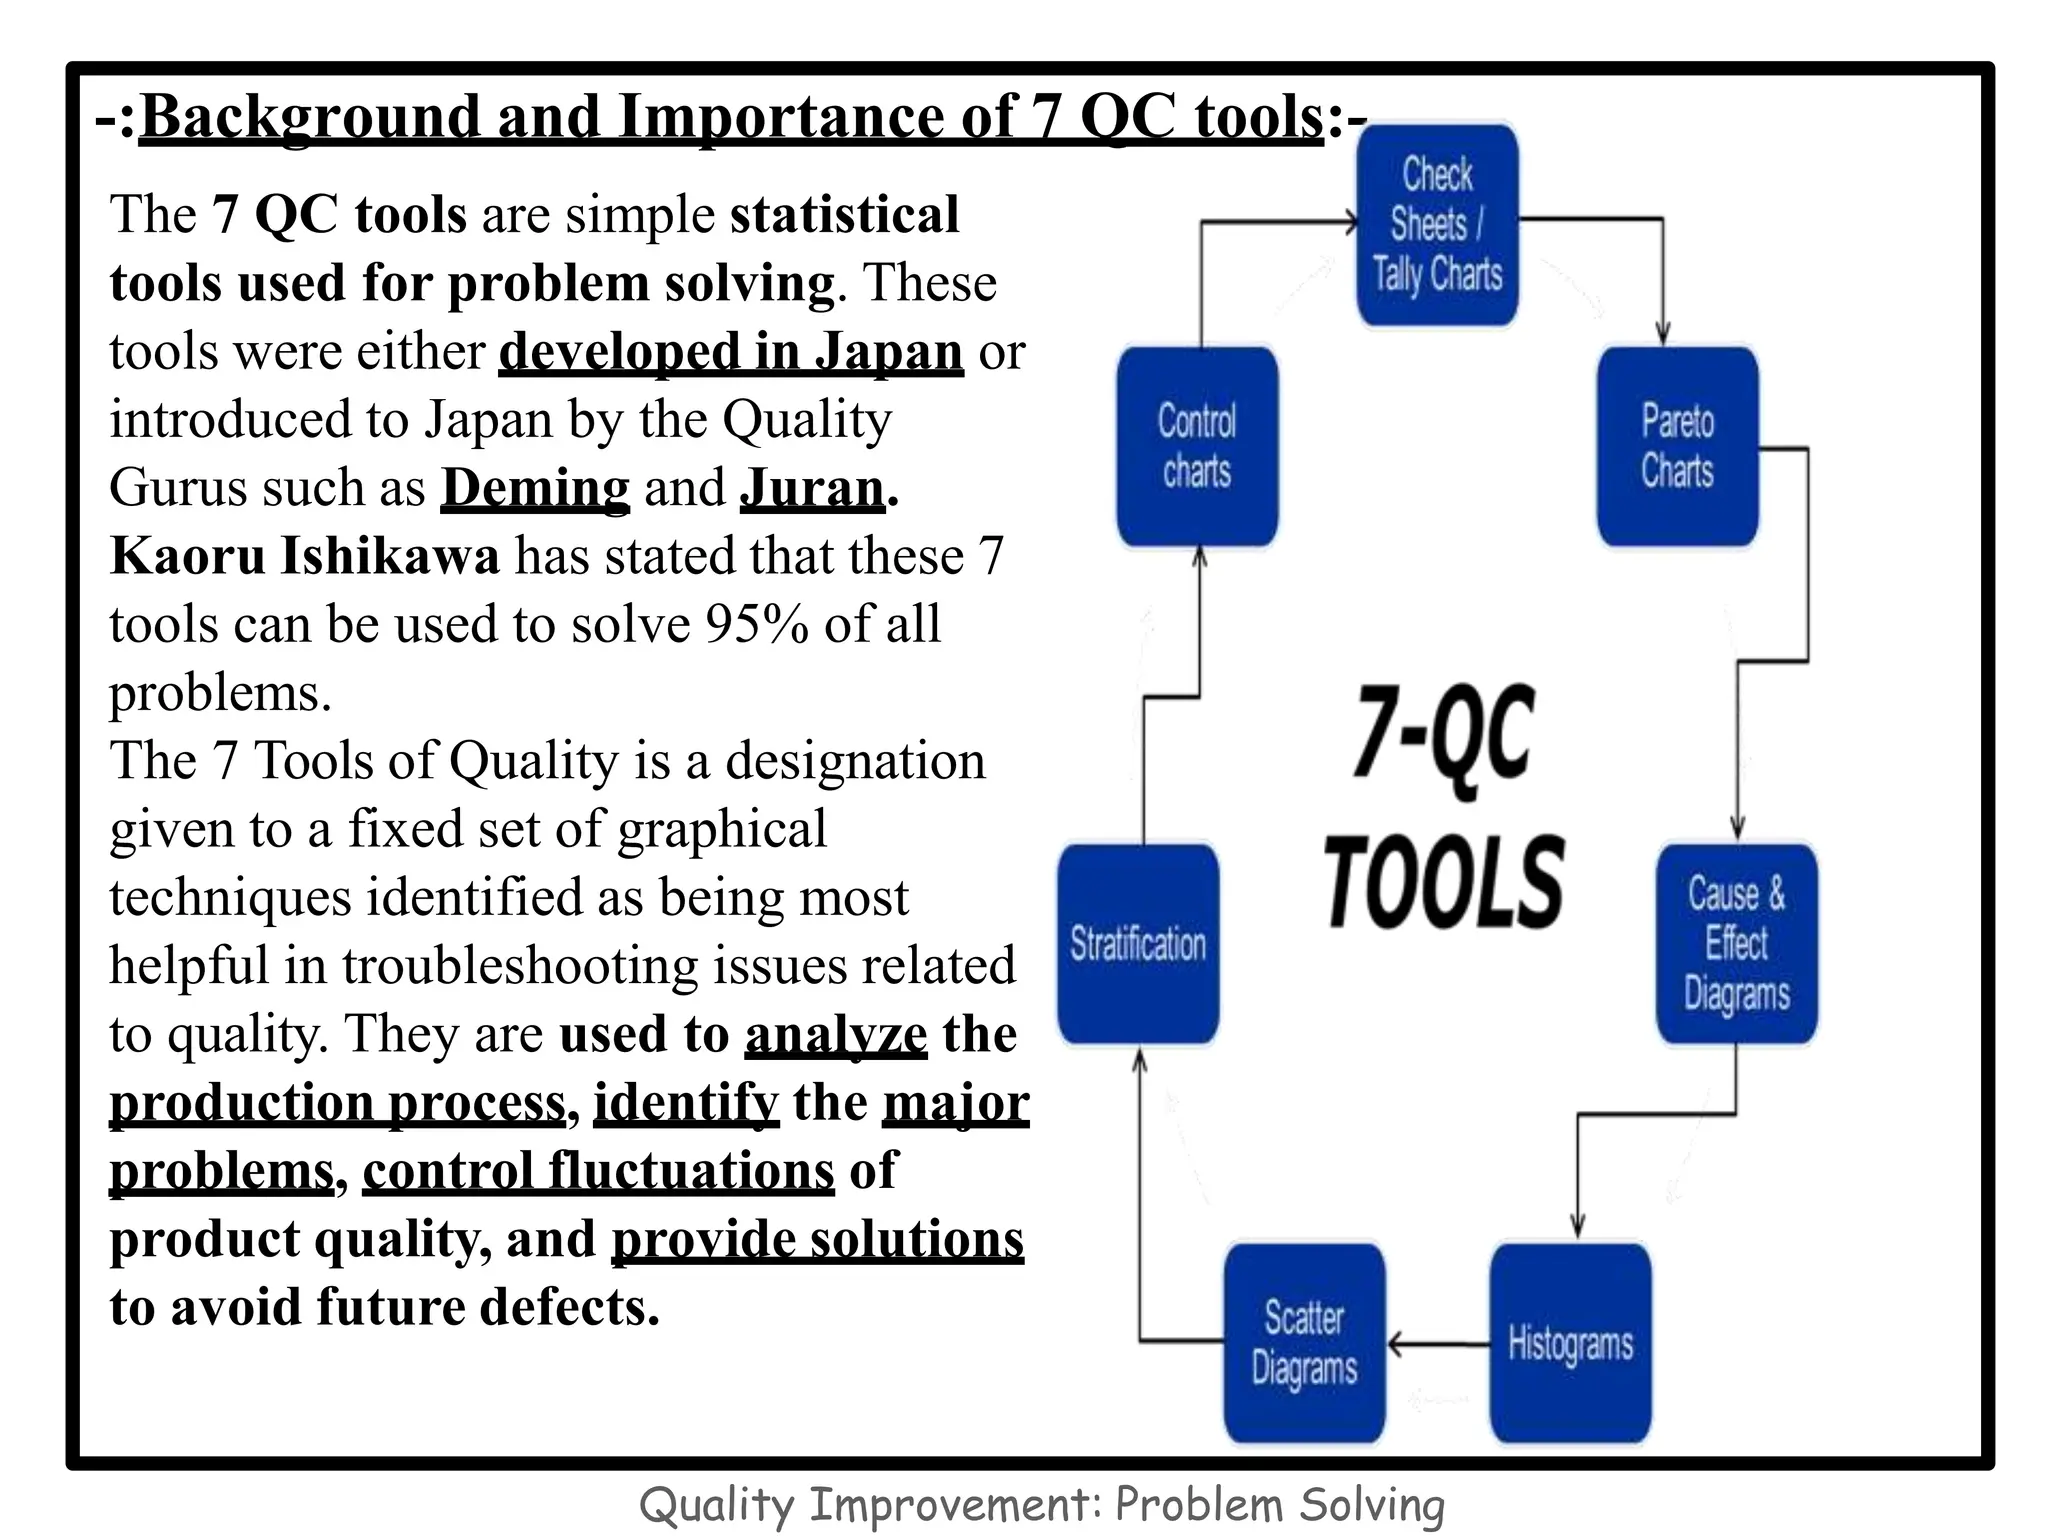
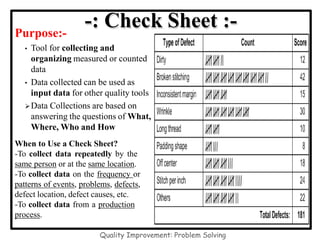
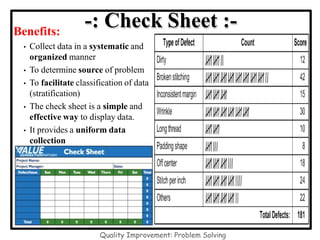
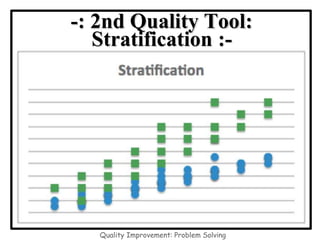
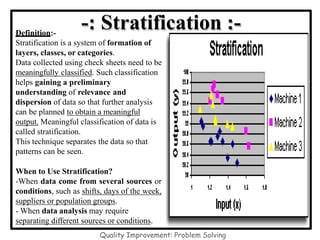
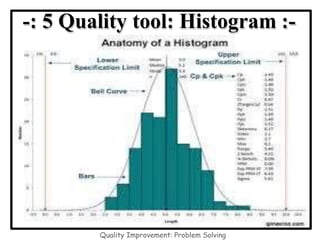
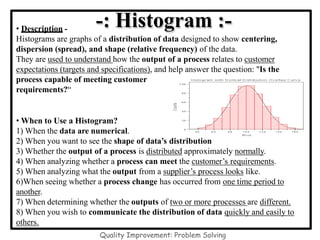
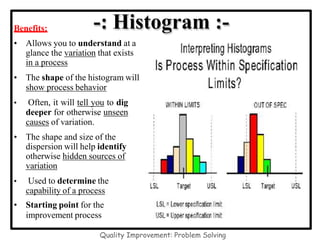
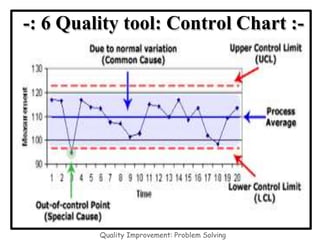
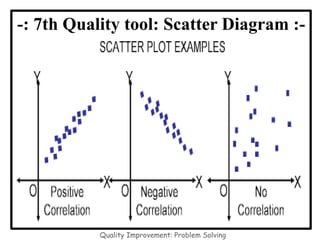
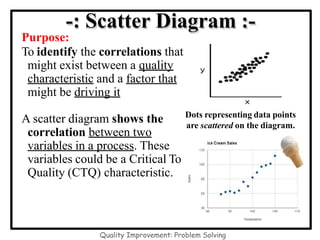
-:Background and Importance of 7 QC tools:-
The 7 QC tools are simple statistical
tools used for problem solving. These
tools were either developed in Japan or
introduced to Japan by the Quality
Gurus such as Deming and Juran.
Kaoru Ishikawa has stated that these 7
tools can be used to solve 95% of all
problems.
The 7 Tools of Quality is a designation
given to a fixed set of graphical
techniques identified as being most
helpful in troubleshooting issues related
to quality. They are used to analyze the
production process, identify the major
problems, control fluctuations of
product quality, and provide solutions
to avoid future defects.
Quality Improvement: Problem Solving
-: 7 Quality Control Tools:-
1. Check sheets
2. Stratification
3. Pareto chart
4. Cause and
effect diagram
5. Histogram
6. Control chart
7. Scatter diagram
Quality Improvement: Problem Solving
-: PDCA APPROACH :-
Definition of problem
Analysis of problem
Identification of causes
Planning countermeasure
Implementation
Confirming effectiveness
Standardizations
WHAT
HOW
WHY
PLAN
DO
CHECK
ACT
Q U A L I T Y
Purpose:-
• Tool for collecting and
organizing measured or counted
data
• Data collected can be used as
input data for other quality tools
Data Collections are based on
answering the questions of What,
Where, Who and How
When to Use a Check Sheet?
-To collect data repeatedly by the
same person or at the same location.
-To collect data on the frequency or
patterns of events, problems, defects,
defect location, defect causes, etc.
-To collect data from a production
process.
-: Check Sheet :-
Quality Improvement: Problem Solving
Benefits:
• Collect data in a systematic and
organized manner
• To determine source of problem
• To facilitate classification of data
(stratification)
• The check sheet is a simple and
effective way to display data.
• It provides a uniform data
collection
-: Check Sheet :-
Quality Improvement: Problem Solving
-: 2nd Quality Tool:
Stratification :-
Quality Improvement: Problem Solving
-: Stratification :-
Definition:-
Stratification is a system of formation of
layers, classes, or categories.
Data collected using check sheets need to be
meaningfully classified. Such classification
helps gaining a preliminary
understanding of relevance and
dispersion of data so that further analysis
can be planned to obtain a meaningful
output. Meaningful classification of data is
called stratification.
This technique separates the data so that
patterns can be seen.
When to Use Stratification?
-When data come from several sources or
conditions, such as shifts, days of the week,
suppliers or population groups.
- When data analysis may require
separating different sources or conditions.
Quality Improvement: Problem Solving
-: Pareto Principle :-
 Vilfredo Pareto (1848-1923) Italian
economist developed this principle.
• 20% of the population has 80% of
the wealth
 Juran used the term “vital few, trivial
many”. He noted that 20% of the quality
problems caused 80% of the dollar loss.
 Purpose: The purpose of a Pareto
diagram is to separate the significant
aspects of a problem from the trivial
ones.
7QualityT
ools
Quality Improvement: Problem Solving
-:Use of Pareto Chart :-
 Pareto charts help teams focus on the
small number of really important
problems or their causes.
 They are useful for establishing
priorities by showing which are the
most critical problems to be tackled or
causes to be addressed.
 Pareto chart helps teams to focus their
efforts where they can have the
greatest potential impact.
 When communicating with others
about your data.
Quality Improvement: Problem Solving
-: Fishbone diagram :-
The cause and effect diagram analysis was first developed by Professor Kaoru Ishikawa of the
University of Tokyo in the 1940s’, is also known as the ‘Fishbone Diagram’ or the ‘Ishikawa
Diagram’or the ‘Cause-and-Effect Diagram’.
Description - The fishbone diagram identifies many possible causes for an effect or problem.
It can be used to structure a brainstorming session. It immediately sorts ideas into useful
categories.
When to use a Fishbone Diagram?
- When identifying possible causes for a problem.
Especially when a team’s thinking tends to fall
into ruts.
Fishbone Diagram Procedure -
1)Brainstorm the major categories of causes
of the problem.
2) It can be identify by ‘6M’techniques:
i) Methods
ii) Machines (Equipment)
iii) Manpower(People)
iv) Materials
v) Measurement
vi) Management, Environment… etc,
Quality Improvement: Problem Solving
Benefits: -: Fishbone Diagram :-
 Breaks problems down into bite-size
pieces to find root cause
 Fosters/Encourage team
work/participation
 Common understanding of factors causing
the problem
 Road map to verify picture of the process
 Follows brainstorming relationship
 Indicates possible causes of variation
 Increases process knowledge
 Diagram demonstrates knowledge of
problem solving team
 Diagram is a guide for data collection
-: 5 Quality tool: Histogram :-
Quality Improvement: Problem Solving
-: Histogram :-
• Description -
Histograms are graphs of a distribution of data designed to show centering,
dispersion (spread), and shape (relative frequency) of the data.
They are used to understand how the output of a process relates to customer
expectations (targets and specifications), and help answer the question: "Is the
process capable of meeting customer
requirements?“
• When to Use a Histogram?
1) When the data are numerical.
2) When you want to see the shape of data’s distribution
3) Whether the output of a process is distributed approximately normally.
4) When analyzing whether a process can meet the customer’s requirements.
5) When analyzing what the output from a supplier’s process looks like.
6)When seeing whether a process change has occurred from one time period to
another.
7) When determining whether the outputs of two or more processes are different.
8) When you wish to communicate the distribution of data quickly and easily to
others.
Quality Improvement: Problem Solving
-: Histogram :-
Benefits:
• Allows you to understand at a
glance the variation that exists
in a process
• The shape of the histogram will
show process behavior
• Often, it will tell you to dig
deeper for otherwise unseen
causes of variation.
• The shape and size of the
dispersion will help identify
otherwise hidden sources of
variation
• Used to determine the
capability of a process
• Starting point for the
improvement process
Quality Improvement: Problem Solving
-: 6 Quality tool: Control Chart :-
Quality Improvement: Problem Solving
-: 7th Quality tool: Scatter Diagram :-
Quality Improvement: Problem Solving
Purpose:
To identify the correlations that
might exist between a quality
characteristic and a factor that
might be driving it
A scatter diagram shows the
correlation between two
variables in a process. These
variables could be a Critical To
Quality (CTQ) characteristic.
-: Scatter Diagram :-
Dots representing data points
are scattered on the diagram.
Quality Improvement: Problem Solving
Jurons Trilogy
5 S

TQM UNIT 2.pptx presentation with images

  • 1.
    -:Background and Importanceof 7 QC tools:- The 7 QC tools are simple statistical tools used for problem solving. These tools were either developed in Japan or introduced to Japan by the Quality Gurus such as Deming and Juran. Kaoru Ishikawa has stated that these 7 tools can be used to solve 95% of all problems. The 7 Tools of Quality is a designation given to a fixed set of graphical techniques identified as being most helpful in troubleshooting issues related to quality. They are used to analyze the production process, identify the major problems, control fluctuations of product quality, and provide solutions to avoid future defects. Quality Improvement: Problem Solving
  • 2.
    -: 7 QualityControl Tools:- 1. Check sheets 2. Stratification 3. Pareto chart 4. Cause and effect diagram 5. Histogram 6. Control chart 7. Scatter diagram Quality Improvement: Problem Solving
  • 3.
    -: PDCA APPROACH:- Definition of problem Analysis of problem Identification of causes Planning countermeasure Implementation Confirming effectiveness Standardizations WHAT HOW WHY PLAN DO CHECK ACT Q U A L I T Y
  • 4.
    Purpose:- • Tool forcollecting and organizing measured or counted data • Data collected can be used as input data for other quality tools Data Collections are based on answering the questions of What, Where, Who and How When to Use a Check Sheet? -To collect data repeatedly by the same person or at the same location. -To collect data on the frequency or patterns of events, problems, defects, defect location, defect causes, etc. -To collect data from a production process. -: Check Sheet :- Quality Improvement: Problem Solving
  • 5.
    Benefits: • Collect datain a systematic and organized manner • To determine source of problem • To facilitate classification of data (stratification) • The check sheet is a simple and effective way to display data. • It provides a uniform data collection -: Check Sheet :- Quality Improvement: Problem Solving
  • 6.
    -: 2nd QualityTool: Stratification :- Quality Improvement: Problem Solving
  • 7.
    -: Stratification :- Definition:- Stratificationis a system of formation of layers, classes, or categories. Data collected using check sheets need to be meaningfully classified. Such classification helps gaining a preliminary understanding of relevance and dispersion of data so that further analysis can be planned to obtain a meaningful output. Meaningful classification of data is called stratification. This technique separates the data so that patterns can be seen. When to Use Stratification? -When data come from several sources or conditions, such as shifts, days of the week, suppliers or population groups. - When data analysis may require separating different sources or conditions. Quality Improvement: Problem Solving
  • 8.
    -: Pareto Principle:-  Vilfredo Pareto (1848-1923) Italian economist developed this principle. • 20% of the population has 80% of the wealth  Juran used the term “vital few, trivial many”. He noted that 20% of the quality problems caused 80% of the dollar loss.  Purpose: The purpose of a Pareto diagram is to separate the significant aspects of a problem from the trivial ones. 7QualityT ools Quality Improvement: Problem Solving
  • 9.
    -:Use of ParetoChart :-  Pareto charts help teams focus on the small number of really important problems or their causes.  They are useful for establishing priorities by showing which are the most critical problems to be tackled or causes to be addressed.  Pareto chart helps teams to focus their efforts where they can have the greatest potential impact.  When communicating with others about your data. Quality Improvement: Problem Solving
  • 10.
    -: Fishbone diagram:- The cause and effect diagram analysis was first developed by Professor Kaoru Ishikawa of the University of Tokyo in the 1940s’, is also known as the ‘Fishbone Diagram’ or the ‘Ishikawa Diagram’or the ‘Cause-and-Effect Diagram’. Description - The fishbone diagram identifies many possible causes for an effect or problem. It can be used to structure a brainstorming session. It immediately sorts ideas into useful categories. When to use a Fishbone Diagram? - When identifying possible causes for a problem. Especially when a team’s thinking tends to fall into ruts. Fishbone Diagram Procedure - 1)Brainstorm the major categories of causes of the problem. 2) It can be identify by ‘6M’techniques: i) Methods ii) Machines (Equipment) iii) Manpower(People) iv) Materials v) Measurement vi) Management, Environment… etc, Quality Improvement: Problem Solving
  • 11.
    Benefits: -: FishboneDiagram :-  Breaks problems down into bite-size pieces to find root cause  Fosters/Encourage team work/participation  Common understanding of factors causing the problem  Road map to verify picture of the process  Follows brainstorming relationship  Indicates possible causes of variation  Increases process knowledge  Diagram demonstrates knowledge of problem solving team  Diagram is a guide for data collection
  • 12.
    -: 5 Qualitytool: Histogram :- Quality Improvement: Problem Solving
  • 13.
    -: Histogram :- •Description - Histograms are graphs of a distribution of data designed to show centering, dispersion (spread), and shape (relative frequency) of the data. They are used to understand how the output of a process relates to customer expectations (targets and specifications), and help answer the question: "Is the process capable of meeting customer requirements?“ • When to Use a Histogram? 1) When the data are numerical. 2) When you want to see the shape of data’s distribution 3) Whether the output of a process is distributed approximately normally. 4) When analyzing whether a process can meet the customer’s requirements. 5) When analyzing what the output from a supplier’s process looks like. 6)When seeing whether a process change has occurred from one time period to another. 7) When determining whether the outputs of two or more processes are different. 8) When you wish to communicate the distribution of data quickly and easily to others. Quality Improvement: Problem Solving
  • 14.
    -: Histogram :- Benefits: •Allows you to understand at a glance the variation that exists in a process • The shape of the histogram will show process behavior • Often, it will tell you to dig deeper for otherwise unseen causes of variation. • The shape and size of the dispersion will help identify otherwise hidden sources of variation • Used to determine the capability of a process • Starting point for the improvement process Quality Improvement: Problem Solving
  • 15.
    -: 6 Qualitytool: Control Chart :- Quality Improvement: Problem Solving
  • 16.
    -: 7th Qualitytool: Scatter Diagram :- Quality Improvement: Problem Solving
  • 17.
    Purpose: To identify thecorrelations that might exist between a quality characteristic and a factor that might be driving it A scatter diagram shows the correlation between two variables in a process. These variables could be a Critical To Quality (CTQ) characteristic. -: Scatter Diagram :- Dots representing data points are scattered on the diagram. Quality Improvement: Problem Solving
  • 18.
  • 19.