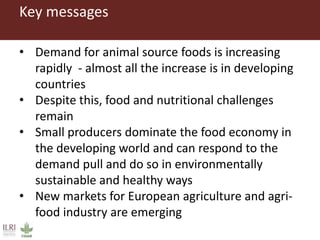
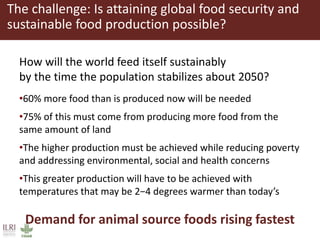
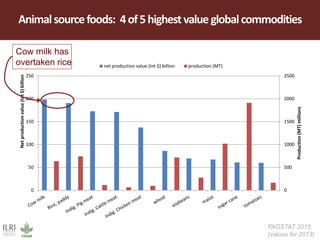
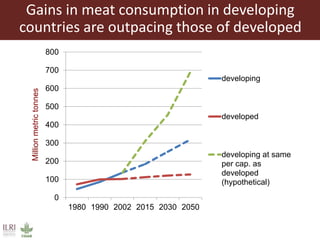
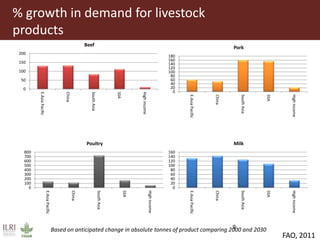
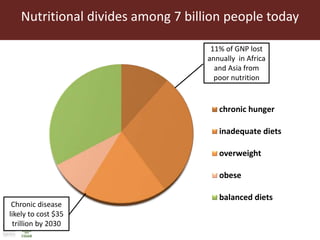
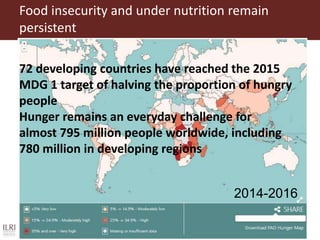
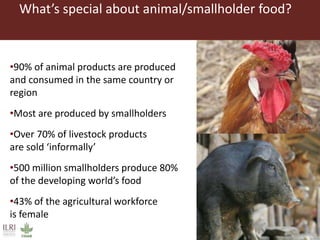
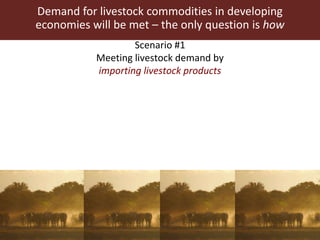
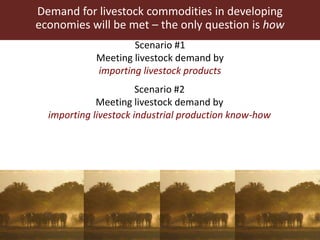
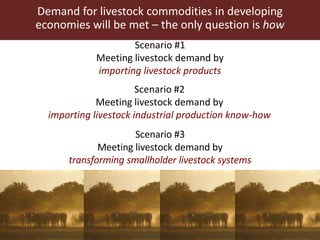
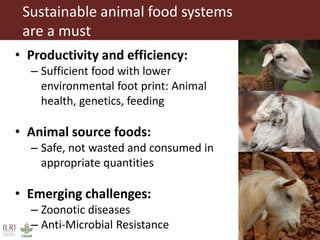
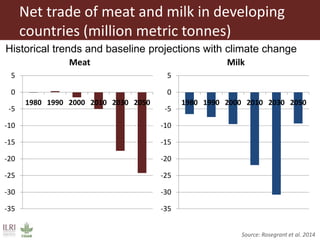
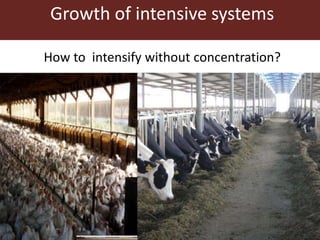
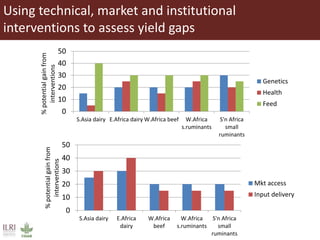
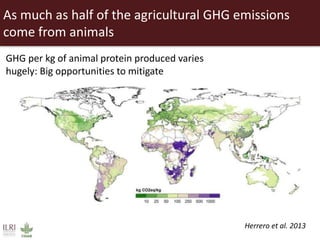
Food security and animal production –
what does the future hold?
Jimmy Smith, Director General, ILRI, Kenya
With: Dieter Schillinger, Delia Grace, Tim Robinson, Shirley Tarawali
IFAH Europe sustainability conference, Brussels, 11 June 2015
Key messages
• Demand for animal source foods is increasing
rapidly - almost all the increase is in developing
countries
• Despite this, food and nutritional challenges
remain
• Small producers dominate the food economy in
the developing world and can respond to the
demand pull and do so in environmentally
sustainable and healthy ways
• New markets for European agriculture and agri-
food industry are emerging
The challenge: Is attaining global food security and
sustainable food production possible?
How will the world feed itself sustainably
by the time the population stabilizes about 2050?
•60% more food than is produced now will be needed
•75% of this must come from producing more food from the
same amount of land
•The higher production must be achieved while reducing poverty
and addressing environmental, social and health concerns
•This greater production will have to be achieved with
temperatures that may be 2−4 degrees warmer than today’s
Demand for animal source foods rising fastest
Animalsourcefoods: 4of5highestvalueglobalcommodities
FAOSTAT 2015
(values for 2013)
0
500
1000
1500
2000
2500
0
50
100
150
200
250
Production(MT)millions
Netproductionvalue(Int$)billion
net production value (Int $) billion production (MT)
Cow milk has
overtaken rice
Drivers of change: population
Anticipated change 2013 – 2050
Asia: +20%
Africa: +113%
Europe: -4%
2015 GDP growth forecast
Percentage urban, 2014
Gains in meat consumption in developing
countries are outpacing those of developed
0
100
200
300
400
500
600
700
800
1980 1990 2002 2015 2030 2050
Millionmetrictonnes
developing
developed
developing at same
per cap. as
developed
(hypothetical)
% growth in demand for livestock
products
2000 - 2030
9
0
50
100
150
200
E.AsiaPacific
China
SouthAsia
SSA
Highincome
Beef
0
20
40
60
80
100
120
140
160
180
E.AsiaPacific
China
SouthAsia
SSA
Highincome
Pork
0
100
200
300
400
500
600
700
800
E.AsiaPacific
China
SouthAsia
SSA
Highincome
Poultry
0
20
40
60
80
100
120
140
160
E.AsiaPacific
China
SouthAsia
SSA
Highincome
Milk
FAO, 2011
Based on anticipated change in absolute tonnes of product comparing 2000 and 2030
Nutritional divides among 7 billion people today
chronic hunger
inadequate diets
overweight
obese
balanced diets
Chronic disease
likely to cost $35
trillion by 2030
11% of GNP lost
annually in Africa
and Asia from
poor nutrition
Food insecurity and under nutrition remain
persistent
72 developing countries have reached the 2015
MDG 1 target of halving the proportion of hungry
people
Hunger remains an everyday challenge for
almost 795 million people worldwide, including
780 million in developing regions
2014-2016
What’s special about animal/smallholder food?
•90% of animal products are produced
and consumed in the same country or
region
•Most are produced by smallholders
•Over 70% of livestock products
are sold ‘informally’
•500 million smallholders produce 80%
of the developing world’s food
•43% of the agricultural workforce
is female
Demand for livestock commodities in developing
economies will be met – the only question is how
Scenario #1
Meeting livestock demand by
importing livestock products
Demand for livestock commodities in developing
economies will be met – the only question is how
Scenario #1
Meeting livestock demand by
importing livestock products
Scenario #2
Meeting livestock demand by
importing livestock industrial production know-how
Demand for livestock commodities in developing
economies will be met – the only question is how
Scenario #1
Meeting livestock demand by
importing livestock products
Scenario #2
Meeting livestock demand by
importing livestock industrial production know-how
Scenario #3
Meeting livestock demand by
transforming smallholder livestock systems
Sustainable animal food systems
are a must
• Productivity and efficiency:
– Sufficient food with lower
environmental foot print: Animal
health, genetics, feeding
• Animal source foods:
– Safe, not wasted and consumed in
appropriate quantities
• Emerging challenges:
– Zoonotic diseases
– Anti-Microbial Resistance
-35
-30
-25
-20
-15
-10
-5
0
5
1980 1990 2000 2010 2030 2050
Meat
-35
-30
-25
-20
-15
-10
-5
0
5
1980 1990 2000 2010 2030 2050
Milk
Net trade of meat and milk in developing
countries (million metric tonnes)
Source: Rosegrant et al. 2014
Historical trends and baseline projections with climate change
18
Growth of intensive systems
How to intensify without concentration?
Replacing the 90% of locally produced
animal commodities is not feasible
Economically
Africa’s food import bill (2013): US $ 44
billion
About one fifth is livestock (highest after
cereals):
Meat: US $ 5 billion; Milk: US $ 4 billion
Business as usual: the import bill doubles
Or for livelihoods
Almost 1 billion rely on livestock for
livelihoods
43% of the agricultural workforce is female
Using technical, market and institutional
interventions to assess yield gaps
0
10
20
30
40
50
S.Asia dairy E.Africa dairy W.Africa beef W.Africa
s.ruminants
S'n Africa
small
ruminants
%potentialgainfrom
interventions
Genetics
Health
Feed
0
10
20
30
40
50
S.Asia dairy E.Africa
dairy
W.Africa
beef
W.Africa
s.ruminants
S'n Africa
small
ruminants
%potentialgainfrom
interventions
Mkt access
Input delivery
As much as half of the agricultural GHG emissions
come from animals
GHG per kg of animal protein produced varies
hugely: Big opportunities to mitigate
Herrero et al. 2013
Most (75%) emerging diseases come from
animals and cost up to US $ 6 billion annually
ILRI report to DFID: Mapping of Poverty and Likely Zoonoses Hotspots, 2012
Emerging zoonotic disease events, 1940−2012
Costs of emerging zoonotic disease outbreaks
(US$ billion)
Period
Cost
(conservative estimates)
6 outbreaks excluding SARS
− Nipah virus (Malaysia)
− West Nile fever (USA)
− HPAI (Asia, Europe)
− BSE (US)
− Rift Valley fever (Tanzania, Kenya, Somalia)
− BSE (UK) costs 1997−09 only
1998−2009 38.7
SARS 2002−2004 41.5
Total over 12 years 1998−2009 80.2
World Bank 2012Giving an annual average of US$6.7 billion
Antimicrobial resistance
Source: Van Boeckel et al. 2015
Global antimicrobial use in food animals
(mg per 10km pixel)
Global antimicrobial consumption will rise by 67% by
2030
Antibiotic use in Africa: 418 tonnes annually
Average OECD country: 864 tonnes annually
AMR information lacking: CVOs in Africa
66% had no information on AMR in animals
21% considered it was occasional
4% common
9% not present in their country
AMR in developing countries – varied causes:
• resistance the result of the animal being treated with
antimicrobials,
• the result of antimicrobials in the environment originally
used to treat people
• other pathways
A valuable market: examples
• Market value of animal source foods
in Africa in 2050 estimated as US $
151 billion
• Globally disease reduces livestock
productivity by 25% - valued at US
$300 billion per year
• Livestock diseases cost Africa
between US $ 9 – 35 billion per year
• Annual global investment of US $ 25
billion in one health approaches
could save as much as US $100
billion annually
Herrero et al. 2014
Developing world - New market opportunities
 Animal source food products –cold dressed and
processed
 Pharma industries
 Genetics
 Feeds
-Be on the ground
-Combine proprietary and open access
approaches
-Public-Private Partnerships
The presentation has a Creative Commons licence. You are free to re-use or distribute this work, provided credit is given to ILRI.
better lives through livestock
ilri.org

Food security and animal production—What does the future hold?

  • 1.
    Food security andanimal production – what does the future hold? Jimmy Smith, Director General, ILRI, Kenya With: Dieter Schillinger, Delia Grace, Tim Robinson, Shirley Tarawali IFAH Europe sustainability conference, Brussels, 11 June 2015
  • 2.
    Key messages • Demandfor animal source foods is increasing rapidly - almost all the increase is in developing countries • Despite this, food and nutritional challenges remain • Small producers dominate the food economy in the developing world and can respond to the demand pull and do so in environmentally sustainable and healthy ways • New markets for European agriculture and agri- food industry are emerging
  • 3.
    The challenge: Isattaining global food security and sustainable food production possible? How will the world feed itself sustainably by the time the population stabilizes about 2050? •60% more food than is produced now will be needed •75% of this must come from producing more food from the same amount of land •The higher production must be achieved while reducing poverty and addressing environmental, social and health concerns •This greater production will have to be achieved with temperatures that may be 2−4 degrees warmer than today’s Demand for animal source foods rising fastest
  • 4.
    Animalsourcefoods: 4of5highestvalueglobalcommodities FAOSTAT 2015 (valuesfor 2013) 0 500 1000 1500 2000 2500 0 50 100 150 200 250 Production(MT)millions Netproductionvalue(Int$)billion net production value (Int $) billion production (MT) Cow milk has overtaken rice
  • 5.
    Drivers of change:population Anticipated change 2013 – 2050 Asia: +20% Africa: +113% Europe: -4%
  • 6.
  • 7.
  • 8.
    Gains in meatconsumption in developing countries are outpacing those of developed 0 100 200 300 400 500 600 700 800 1980 1990 2002 2015 2030 2050 Millionmetrictonnes developing developed developing at same per cap. as developed (hypothetical)
  • 9.
    % growth indemand for livestock products 2000 - 2030 9 0 50 100 150 200 E.AsiaPacific China SouthAsia SSA Highincome Beef 0 20 40 60 80 100 120 140 160 180 E.AsiaPacific China SouthAsia SSA Highincome Pork 0 100 200 300 400 500 600 700 800 E.AsiaPacific China SouthAsia SSA Highincome Poultry 0 20 40 60 80 100 120 140 160 E.AsiaPacific China SouthAsia SSA Highincome Milk FAO, 2011 Based on anticipated change in absolute tonnes of product comparing 2000 and 2030
  • 10.
    Nutritional divides among7 billion people today chronic hunger inadequate diets overweight obese balanced diets Chronic disease likely to cost $35 trillion by 2030 11% of GNP lost annually in Africa and Asia from poor nutrition
  • 11.
    Food insecurity andunder nutrition remain persistent 72 developing countries have reached the 2015 MDG 1 target of halving the proportion of hungry people Hunger remains an everyday challenge for almost 795 million people worldwide, including 780 million in developing regions 2014-2016
  • 12.
    What’s special aboutanimal/smallholder food? •90% of animal products are produced and consumed in the same country or region •Most are produced by smallholders •Over 70% of livestock products are sold ‘informally’ •500 million smallholders produce 80% of the developing world’s food •43% of the agricultural workforce is female
  • 13.
    Demand for livestockcommodities in developing economies will be met – the only question is how Scenario #1 Meeting livestock demand by importing livestock products
  • 14.
    Demand for livestockcommodities in developing economies will be met – the only question is how Scenario #1 Meeting livestock demand by importing livestock products Scenario #2 Meeting livestock demand by importing livestock industrial production know-how
  • 15.
    Demand for livestockcommodities in developing economies will be met – the only question is how Scenario #1 Meeting livestock demand by importing livestock products Scenario #2 Meeting livestock demand by importing livestock industrial production know-how Scenario #3 Meeting livestock demand by transforming smallholder livestock systems
  • 16.
    Sustainable animal foodsystems are a must • Productivity and efficiency: – Sufficient food with lower environmental foot print: Animal health, genetics, feeding • Animal source foods: – Safe, not wasted and consumed in appropriate quantities • Emerging challenges: – Zoonotic diseases – Anti-Microbial Resistance
  • 17.
    -35 -30 -25 -20 -15 -10 -5 0 5 1980 1990 20002010 2030 2050 Meat -35 -30 -25 -20 -15 -10 -5 0 5 1980 1990 2000 2010 2030 2050 Milk Net trade of meat and milk in developing countries (million metric tonnes) Source: Rosegrant et al. 2014 Historical trends and baseline projections with climate change
  • 18.
    18 Growth of intensivesystems How to intensify without concentration?
  • 19.
    Replacing the 90%of locally produced animal commodities is not feasible Economically Africa’s food import bill (2013): US $ 44 billion About one fifth is livestock (highest after cereals): Meat: US $ 5 billion; Milk: US $ 4 billion Business as usual: the import bill doubles Or for livelihoods Almost 1 billion rely on livestock for livelihoods 43% of the agricultural workforce is female
  • 20.
    Using technical, marketand institutional interventions to assess yield gaps 0 10 20 30 40 50 S.Asia dairy E.Africa dairy W.Africa beef W.Africa s.ruminants S'n Africa small ruminants %potentialgainfrom interventions Genetics Health Feed 0 10 20 30 40 50 S.Asia dairy E.Africa dairy W.Africa beef W.Africa s.ruminants S'n Africa small ruminants %potentialgainfrom interventions Mkt access Input delivery
  • 21.
    As much ashalf of the agricultural GHG emissions come from animals GHG per kg of animal protein produced varies hugely: Big opportunities to mitigate Herrero et al. 2013
  • 22.
    Most (75%) emergingdiseases come from animals and cost up to US $ 6 billion annually ILRI report to DFID: Mapping of Poverty and Likely Zoonoses Hotspots, 2012 Emerging zoonotic disease events, 1940−2012
  • 23.
    Costs of emergingzoonotic disease outbreaks (US$ billion) Period Cost (conservative estimates) 6 outbreaks excluding SARS − Nipah virus (Malaysia) − West Nile fever (USA) − HPAI (Asia, Europe) − BSE (US) − Rift Valley fever (Tanzania, Kenya, Somalia) − BSE (UK) costs 1997−09 only 1998−2009 38.7 SARS 2002−2004 41.5 Total over 12 years 1998−2009 80.2 World Bank 2012Giving an annual average of US$6.7 billion
  • 24.
    Antimicrobial resistance Source: VanBoeckel et al. 2015 Global antimicrobial use in food animals (mg per 10km pixel)
  • 25.
    Global antimicrobial consumptionwill rise by 67% by 2030 Antibiotic use in Africa: 418 tonnes annually Average OECD country: 864 tonnes annually AMR information lacking: CVOs in Africa 66% had no information on AMR in animals 21% considered it was occasional 4% common 9% not present in their country AMR in developing countries – varied causes: • resistance the result of the animal being treated with antimicrobials, • the result of antimicrobials in the environment originally used to treat people • other pathways
  • 26.
    A valuable market:examples • Market value of animal source foods in Africa in 2050 estimated as US $ 151 billion • Globally disease reduces livestock productivity by 25% - valued at US $300 billion per year • Livestock diseases cost Africa between US $ 9 – 35 billion per year • Annual global investment of US $ 25 billion in one health approaches could save as much as US $100 billion annually Herrero et al. 2014
  • 27.
    Developing world -New market opportunities  Animal source food products –cold dressed and processed  Pharma industries  Genetics  Feeds -Be on the ground -Combine proprietary and open access approaches -Public-Private Partnerships
  • 28.
    The presentation hasa Creative Commons licence. You are free to re-use or distribute this work, provided credit is given to ILRI. better lives through livestock ilri.org