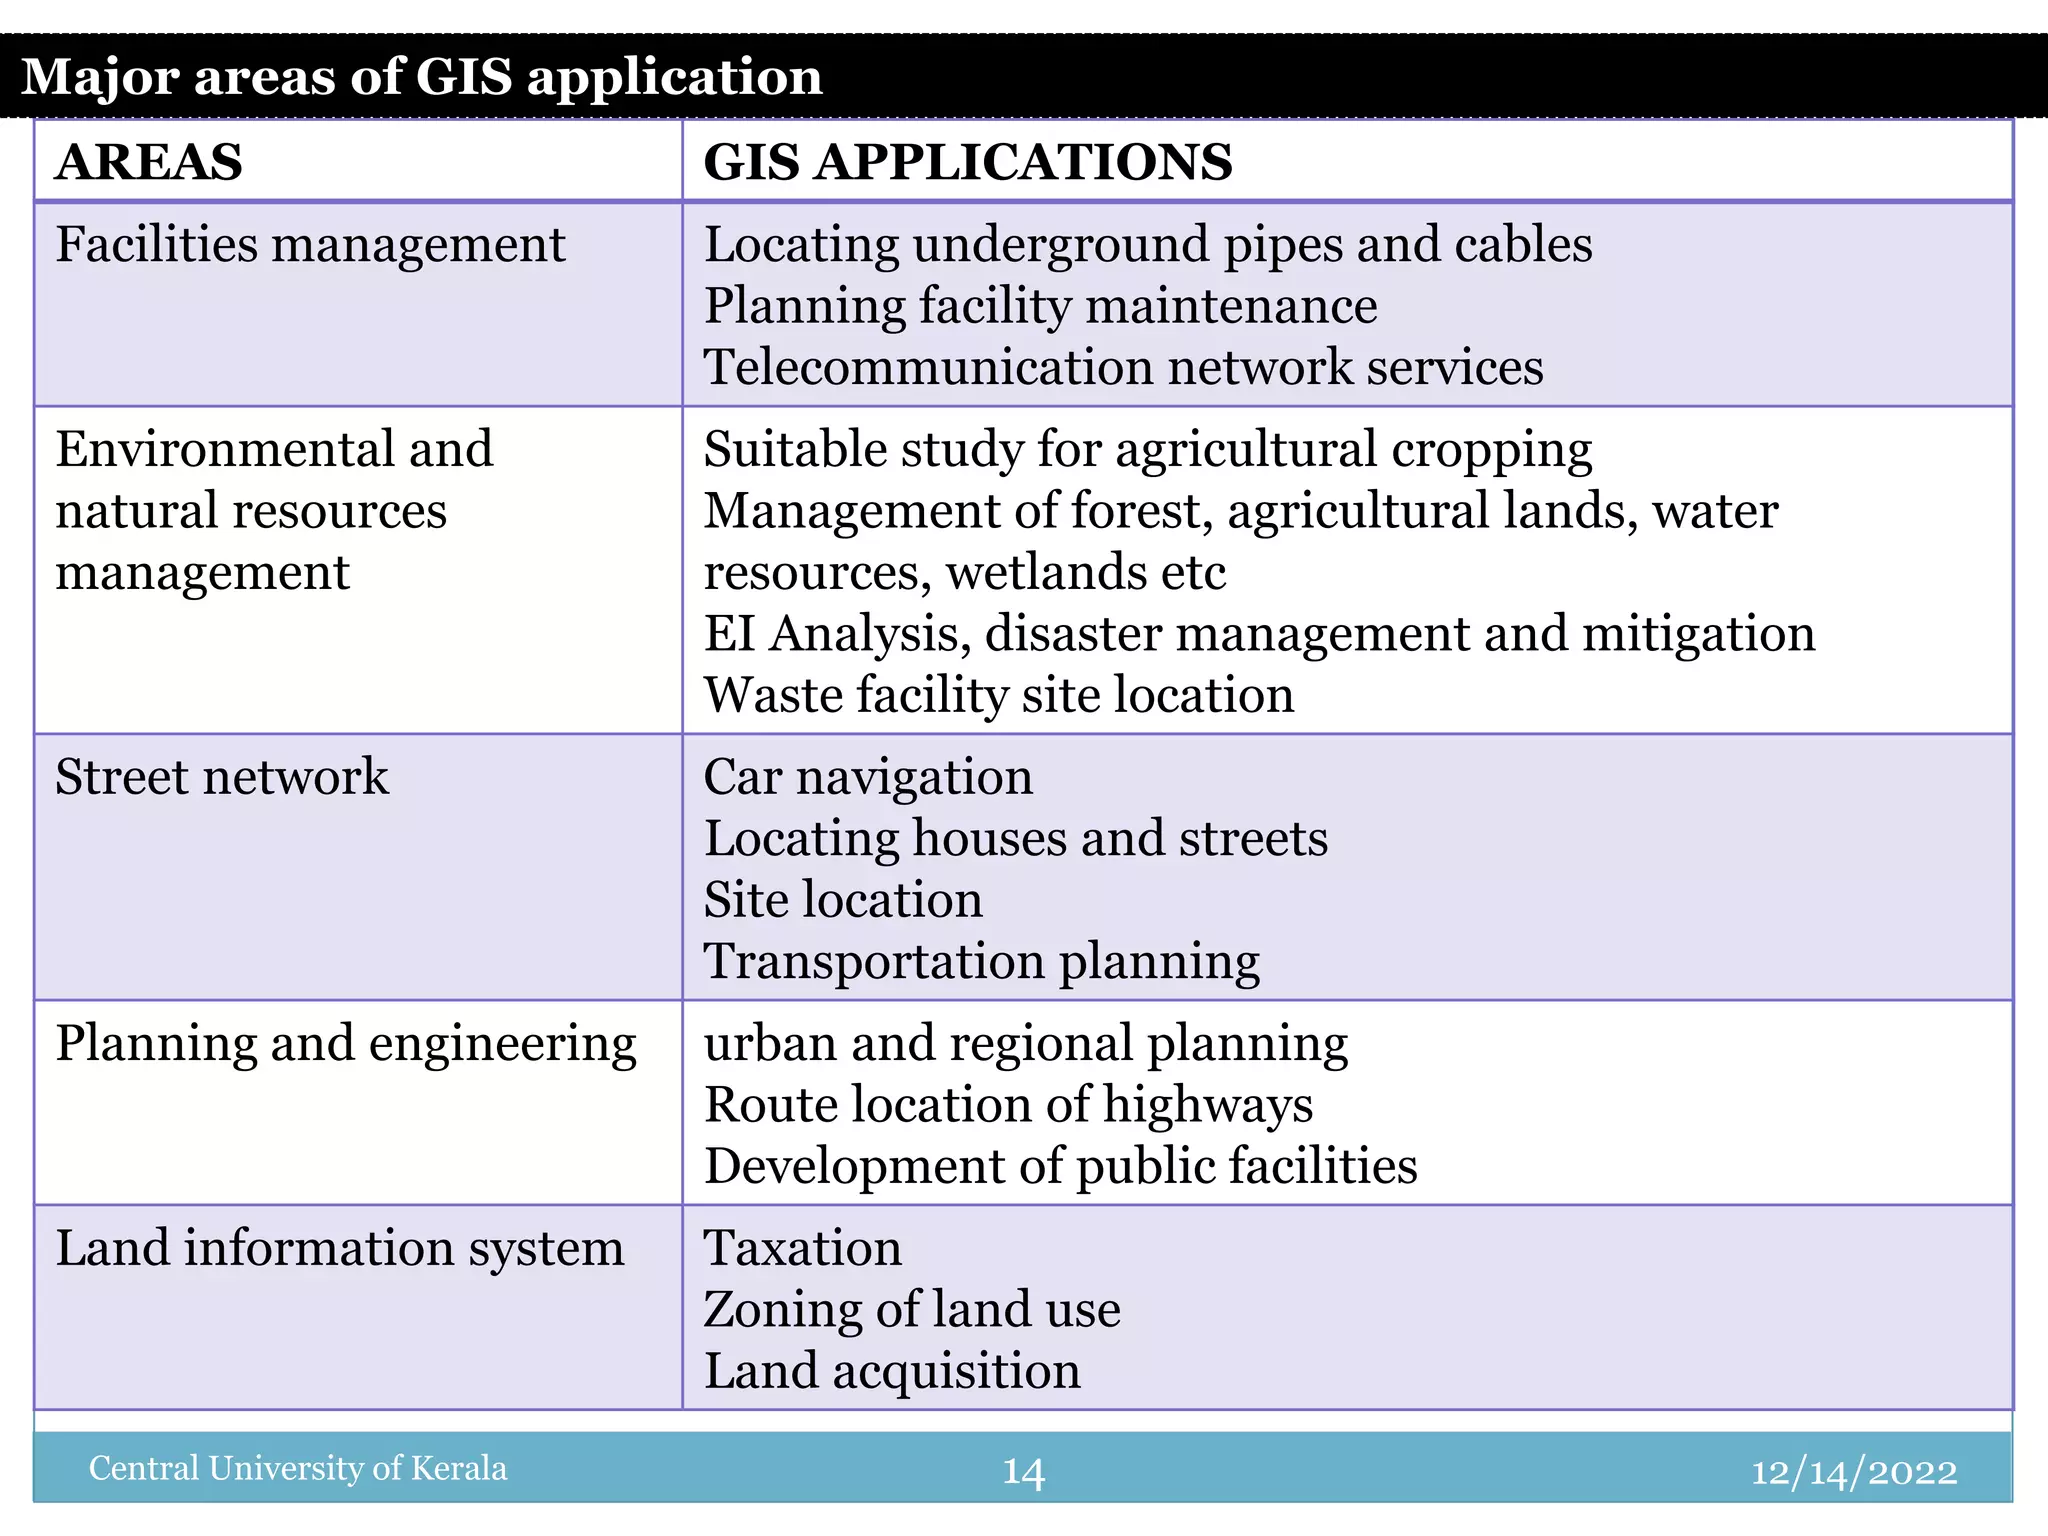
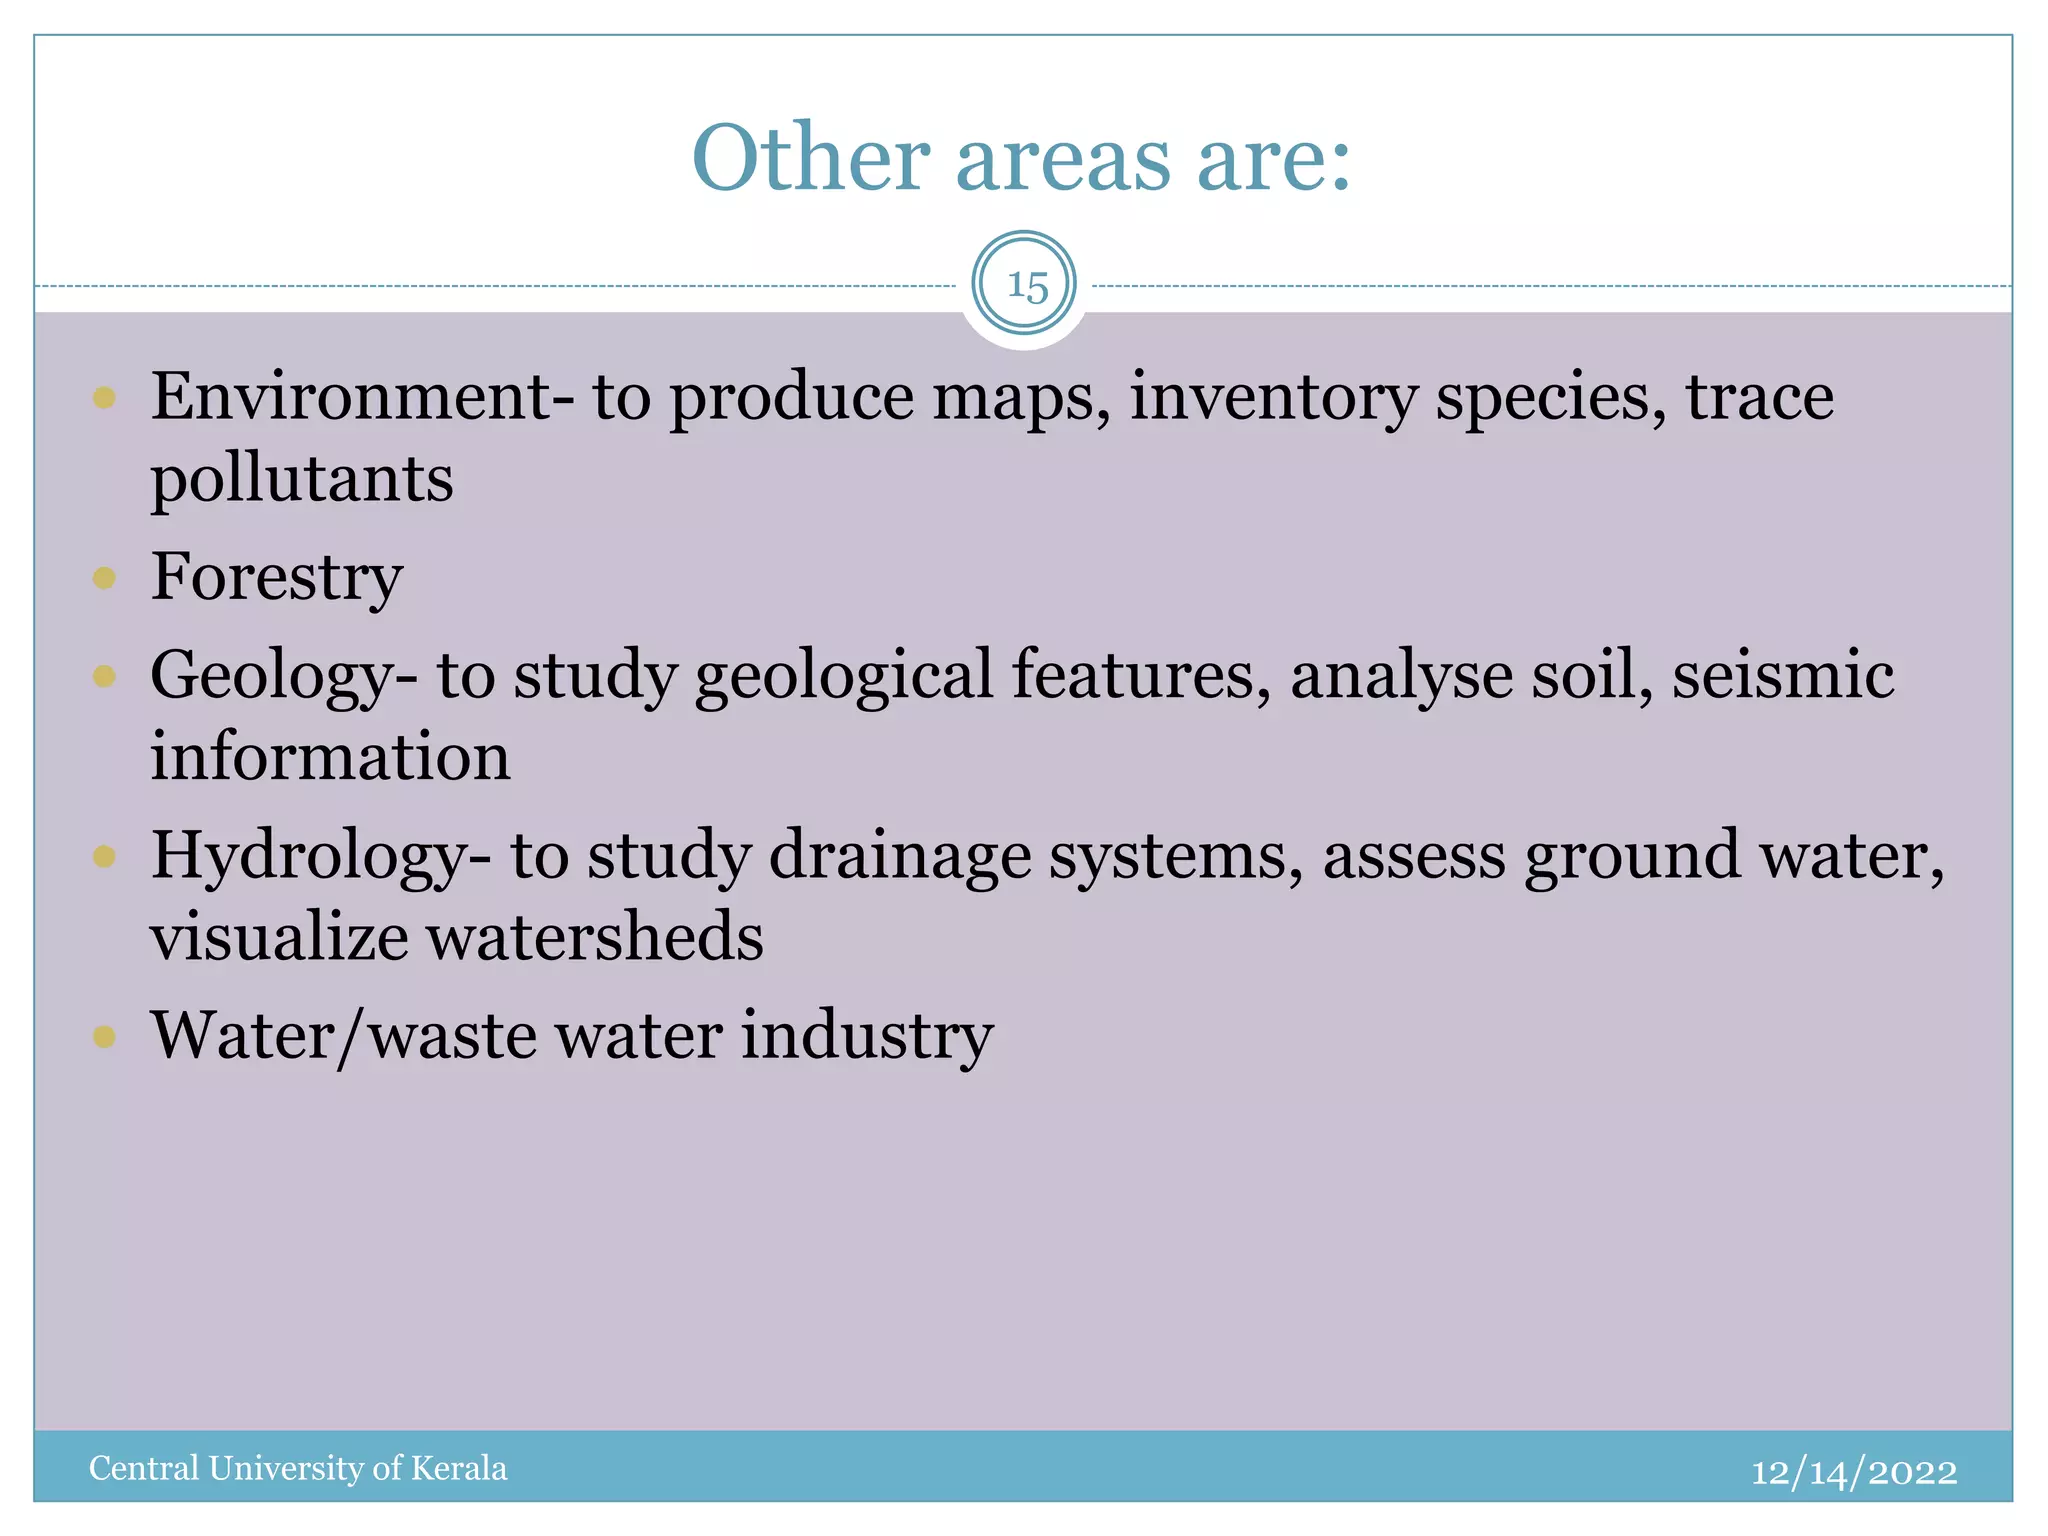
1. 1
12/14/2022
Central University of Kerala
Environmental Applications of GIS: Impact
Assessment - Pollution Monitoring - Water, Air,
Ocean Pollution, Land Degradation,
Desertification, Industry, Mining, Ground
Water Modeling, Damage Assessment, Coastal
and Marine applications.
2. Introduction
12/14/2022
Central University of Kerala
2
A geographic information system, (Geospatial information
systems) is a computer-based tool for mapping and
analyzing spatial data.
A system designed to capture, store, manipulate, analyze,
manage, and present all types of geological data by
computer software and hardware systems
GIS technology integrates common database operations
such as query and statistical analysis
3. 12/14/2022
Central University of Kerala
3
GIS is considered to be one of the most important new
technologies, with the potential to revolutionize many
aspects of society through increased ability to make
decisions and solve problems
GIS is the merging of cartography, statistical analysis, and
computer science technology.
4. 12/14/2022
Central University of Kerala
4
It is to solve complex problems regarding planning and
management of resources.
Functions of GIS include data entry, data display, data
management, information retrieval and analysis.
The applications of GIS include mapping locations,
quantities and densities, finding distances and mapping
and monitoring change.
5. 12/14/2022
Central University of Kerala
5
GISs have transformed the way spatial data, relationships
and patterns in the world are able to be interactively
queried, processed, analysed, mapped, modelled,
visualised, and displayed for an increasingly large range of
users, for a multitude of purposes.
Uses of GIS range from indigenous people, communities,
research institutions, environmental scientists, health
organisations, land use planners, businesses, and
government agencies at all levels.
6. 12/14/2022
Central University of Kerala
6
Uses range from
information storage;
spatial pattern identification;
visual presentation of spatial relationships;
involving large numbers of users,
data collectors,
specialists and/or
community participants.
7. Application of GIS
12/14/2022
Central University of Kerala
7
A GIS is an information system that is designed to work
with data referenced to spatial or geographic coordinates.
GIS is both a database system with specific capabilities for
spatially referenced data, as well as a set of operation for
working with data.
There are three basic types of GIS applications which might
also represent stages of development of a single GIS
application.
9. Inventory Application
12/14/2022
Central University of Kerala
9
Many times the first step in developing a GIS application is
making an inventory of the features for a given geographic
area.
These features are represented in GIS as layers or themes of
data.
The emphasis at this stage of application development
consists of updating and simple data retrieval.
10. Analysis Application
12/14/2022
Central University of Kerala
10
Upon completion of the inventory stage, complex queries
on multiple layers can be performed using spatial and
aspatial analysis techniques.
11. Management Application
12/14/2022
Central University of Kerala
11
More advanced spatial and modeling techniques are
required to support the decisions of managers and policy
makers.
This involves shifting of emphasis from basic geographic
data handling to manipulation, analysis and modeling in
order to solve real world problems.
12. 12/14/2022
Central University of Kerala
12
The major challenges that we face in the world today are
overpopulation, pollution, deforestation, natural
disasters, all have a critical geographic dimension.
Local problems also have a geographic component that
can be visualized using GIS technology, whether finding
the best soil for growing crops, determining the home
range for an endangered species, or discovering the best
way to dispose of hazardous waste
And, before GIS technology, only a few people had the
skills necessary to use geographic information to help
with decision making and problem solving.
13. 12/14/2022
Central University of Kerala
13
A GIS enables us to understand and evaluate our data by
creating graphic displays using information stored in our
database.
With a GIS, we can change the display of our geographic
data by changing the symbols, colours, or values of
database tables.
14. 12/14/2022
Central University of Kerala 14
AREAS GIS APPLICATIONS
Facilities management Locating underground pipes and cables
Planning facility maintenance
Telecommunication network services
Environmental and
natural resources
management
Suitable study for agricultural cropping
Management of forest, agricultural lands, water
resources, wetlands etc
EI Analysis, disaster management and mitigation
Waste facility site location
Street network Car navigation
Locating houses and streets
Site location
Transportation planning
Planning and engineering urban and regional planning
Route location of highways
Development of public facilities
Land information system Taxation
Zoning of land use
Land acquisition
Major areas of GIS application
15. Other areas are:
12/14/2022
Central University of Kerala
15
Environment- to produce maps, inventory species, trace
pollutants
Forestry
Geology- to study geological features, analyse soil, seismic
information
Hydrology- to study drainage systems, assess ground water,
visualize watersheds
Water/waste water industry
16. Contamination
12/14/2022
Central University of Kerala
16
major problem due to scarcity of land.
It is mainly due to disposal of waste on land surface without
treatment.
The liquid waste and lechates generated from the solid
waste percolate in to the ground and causing problem like
ground water contamination, degradation of vegetation,
modification of soil properties etc.
Contamination of soil causes failure of foundation, land
subsidence, landslides, pollution ground water quality etc.,
17. 12/14/2022
Central University of Kerala
17
It is essential to know the contamination characteristics of
soil to have safe proposed structure and prevention of
failure of existing structure.
Contamination characteristics of soil can be inferred from
the Physical , chemical , index and Engineering properties.
Manual analysis, interpolation and generating the spatial
models are difficult and tedious process.
18. 12/14/2022
Central University of Kerala
18
In such cases, GIS can effectively used, where data collected
as discrete form, interpolation techniques can be used to
obtain continues data.
GIS in environmental contamination is the use of
GIS software in mapping out the contaminants in soil and
water using the spatial interpolation tools from GIS.
Soil and water contamination by metals and other
contaminants have become a major environmental problem
after the industrialization across many parts of the world.
19. 12/14/2022
Central University of Kerala
19
GIS is used to monitor the sites for metal contaminants in
the soil, and based on the GIS analysis, highest risk sites
are identified in which majority of the remediation and
monitoring takes place.
GIS is used in making spatial interpolations of
contaminants in the soil and water.
Spatial interpolation allows for more efficient approach to
remediation and monitoring of soil and water
contaminants.
20. GIS In Soil Contamination
12/14/2022
Central University of Kerala
20
Soil contamination from heavy elements can be found in
the urban environments, which can be attributed to the
transportation and industries along with the background
levels.
In a study area, GIS is used for the analysis of spatial
relationship of the contaminants within the soil.
21. 12/14/2022
Central University of Kerala
21
Xiangdong (2003) studied about variation of metal
contamination in soils. Sampling was done about 3- 5/km2.
Geo-chemical map developed using GIS. Spatial
interpolation was found for Ni, Cu, and Pb in soil using
spatial interpolation technique.
Chaosheng Zhang (2005), collected 166 surface samples
and analysed using ICP-AES and 26 chemical elements
were found.
GIS mapping is used to identify the pollutants.
22. Analysis of Soil Contamination Using GIS
12/14/2022
Central University of Kerala
22
The digitization is a process of obtaining latitude and
longitude of all points in a map by using GPS by setting out
reference point in field.
The digitization process involves encoding analog in the
logical data.
The accuracy of any GIS database is directly related to the
quality of the digitizing process.
Data coding is a process of jointing and relating the data’s
for various points.
23. GIS in Land Degradation & Desertification
12/14/2022
Central University of Kerala
23
Land degradation is one of the most serious ecological
problems in the world.
It entails two interrelated, complex systems: the natural
ecosystem and the human social system.
Causes of land degradation are not only biophysical, but
also socio-economic
Desertification is one of the fundamental problems that
threaten many arid and semi-arid areas.
24. GIS-Based Model Of Soil Loss
12/14/2022
Central University of Kerala
24
Soil erosion, considered as the most important land
degradation process, can be defined as a smoothing or
leveling process, in which soil and rock particles are
carried, rolled, or washed down-slope by the force of
gravity.
Soil loss is defined as the amount of soil lost in a specified
time period over an area of land which has experienced net
soil loss.
Recently, different models were developed to focus on the
quantitative approach of desertification assessment.
25. 12/14/2022
Central University of Kerala
25
Geoinformation technology (Remote Sensing , Geographic
Information Systems , and Global Positioning System) and
their integration are the basal and essential technical core
of the system of geospace information science that play an
important role for assessing and monitoring the
environment and its components.
Monitoring desertification and land changes over time is
required in order to determine land condition trends:
whether conditions are becoming worse, better, or staying
the same.
26. 12/14/2022
Central University of Kerala
26
Finding indicators that are unambiguously related to
certain land degradation process or to desertification in
general is important.
Baugh et. al. (2006) quantitatively evaluated fourteen
vegetation indices (VIs) using a Landsat TM dataset
spanning 17 years over the San Luis Valley, Colorado, USA
to find the best VI for use in sparsely vegetated arid regions.
His results showed that NDVIoffset index is effective.
27. 12/14/2022
Central University of Kerala
27
Landsat Thematic Mapper sub-scenes have been used to
map the type, extent and degree of degradation.
In an area of over 5000 km2, 42% was affected by wind
erosion and 50% by accelerated water erosion.
Begzsuren (2007) studied the land degradation and
desertification at Bulgan area, Mongolia using remote
sensing and GIS technique.
28. GIS in Coastal Ecosystem Management
12/14/2022
Central University of Kerala
28
• A variety of data pertaining to the coastal zone like,
• identification of plant community,
• biomass estimation,
• shoreline changes,
• delineation of coastal landforms and tidal boundary,
• qualitative estimation of suspended sediment
concentration,
• chlorophyll mapping,
• bathymetry of shallow waters, etc.
• can be collected and all these data will help in effective
coastal ecosystem management.
29. 12/14/2022
Central University of Kerala
29
The latest Indian satellites IRS – 1C, 1D, P4 and P6 with
their improved spatial resolution (PAN – 5.8 m, LISS III –
23.6 m, LISS IV – 5.8m, WiFS – 188 m and A WiFS – 56
m), extended spectral range (inclusion of middle infrared
band in LISS – III) and increased repetivity (5 days for
WiFS data) have opened up new applications in coastal
zone.
30. 12/14/2022
Central University of Kerala
30
Preliminary analysis of IRS – 1C, 1D data indicates that
coral reef zonation, identification of tree and shrub
mangroves, mudflats, beach, dune vegetation, saline
areas, etc as well as better understanding of suspended
sediment patterns are now possible.
The PAN data combined with the LISS – III and LISS- IV
data are extremely useful in providing detailed spatial
information about reclamation, construction activity and
ecologically sensitive areas, which are vital for the coastal
zone regulatory activities.
31. 12/14/2022
Central University of Kerala
31
The information available from merged PAN and LISS III,
IV data about coral reef zonation, especially for atolls, patch
reef and coral pinnacles, is valuable for coral reef
conservation plans.
The distinction between tree and shrub mangroves in FCC
(middle infrared, infrared and red bands) of LISS III
provides vital information on biodiversity studies .
The high temporal resolution provided by the WiFS data is
found to be a major improvement in studying the behavior
of suspended sediments in the coastal waters, which would
help in understanding the movement of sediments and
pollutants.
32. Mangroves
12/14/2022
Central University of Kerala
32
For detection of land cover change, multi temporal data of
Landsat TM were found to be more suitable for
identification of deforestation areas, mapping the
regeneration/ regrowth of forest area and tracing major
changes in land cover.
Further, multidated satellite data can be used effectively to
find out the changes in the aereal extent of mangroves.
Sequential nature of IRS data provide opportunity to
monitor changes in the land use activities in the mangroves.
IRS has been quite extensively used for Mangrove land use
pattern both the visual as well as the digital analysis of IRS
data provide useful information.
33. 12/14/2022
Central University of Kerala
33
GIS technology is an effective tool for studying the
environment, reporting on environmental phenomena,
and modeling how the environment is responding to
natural and man-made factors.
Environmental managers, scientists, regulators,
planners, and many others use GIS to visualize data
about Natural resources, Hazard control, Pollution
emissions, Ecosystem health, Climate change
Understanding relationships within the environment is
essential for creating environmental impact reports,
designing sustainable management plans, prioritizing
project areas and funding, and informing government
and the public about environmental concerns.
34. Ground Water Modeling
12/14/2022
Central University of Kerala
34
A groundwater model using a GIS has many
distinct advantages over traditional models.
The most important benefit of using GIS is that
everything is defined within a spatial context.
The distribution of precipitation, groundwater
recharge and pumping, and reservoirs can all be
seen on a single map.
Moreover, relationships between these
components are easily determined because GIS is
essentially a database that can combine this
information in an infinite number of ways.
35. 12/14/2022
Central University of Kerala
35
Traditional models are usually confined to a specific
process, location, or set of conditions.
In GIS, a single model can perform analyses for a
variety of situations by simply having a map of a
region and knowledge concerning its physical
parameters.
It shows how GIS can be used for groundwater
modeling.
36. Groundwater Movement
12/14/2022
Central University of Kerala
36
GIS has the ability to store parameters and manage
information using spatial references.
The database consists of several feature-attribute tables
(FTABs) with ID fields that link characteristics to specific
map features.
The data for a given feature defines its state, to be used in
modeling behaviors under OOP.
An FTAB usually contains one value for a parameter
associated with a given feature.
This regime works well for single-valued parameters such
as a groundwater cell’s bottom elevation or area.
37. Surface/Subsurface Interactions
12/14/2022
Central University of Kerala
37
In order to accurately represent groundwater processes,
an aquifer’s interactions with the surface must be
considered.
This can be accomplished by modifying the GIS database
to transfer and store information that the surface and
groundwater models have in common.
Data linkages must be established because the two
models generally utilize different conceptual and spatial
relationships.
In this manner, surface and groundwater models can be
integrated through a shared interface, the base map.
38. Hydrology
12/14/2022
Central University of Kerala
38
GISs have become a useful and important tool in
hydrology and to hydrologists in the scientific study and
management of water resources.
Climate change and greater demands on water resources
require a more knowledgeable disposition of arguably one
of our most vital resources.
As every hydrologist knows, water is constantly in motion.
Because water in its occurrence varies spatially and
temporally throughout the hydrologic cycle, its study using
GIS is especially practical.
39. 12/14/2022
Central University of Kerala
39
GIS systems previously were mostly static in their
geospatial representation of hydrologic features. Today,
GIS platforms have become increasingly dynamic,
narrowing the gap between historical data and current
hydrologic reality.
The characteristics of groundwater can readily be input into
GIS for further study and management of water resources.
GIS in hydrogeology
40. GIS in surface water
12/14/2022
Central University of Kerala
40
GIS is much more capable of displaying data spatially than
temporally. Within one GIS,ESRI’s ArcGIS for example, is it
possible to delineate a watershed.
Digital elevation model (DEM) data are layered with
hydrographic data so that the boundaries of a watershed may
be determined. Watershed delineation aids the hydrologist or
water resource manager in understanding where runoff from
precipitation or snowmelt will eventually drain.
In the case of snowmelt, snowpack coverage may be
determined from ground stations or remotely sensed
observers and input into GIS to determine or predict how
much water can be counted on to be available for use by cities,
agriculture, and environmental habitat.
41. 12/14/2022
Central University of Kerala
41
Another useful application for GIS regards precipitation,
but other hydrologic data (evapotranspiration,
infiltration, and groundwater) may be treated similarly.
Precipitation is an area event measured using data from
point locations.
The difficulty in using point data lies in extrapolating
these point measurements to areas.
One useful method to extrapolate data is to construct
Thiessen polygons which assess the distance and
geometry of points in a plane and determines
representative areas for which to assign precipitation
values.
42. 12/14/2022
Central University of Kerala
42
GIS applications like ArcGIS are capable of
constructing Thiessen polygons, and other methods of
determining area precipitation are viable with GIS as
well.
By synthesizing GIS technology with hydrologic data, it
has become possible to elucidate the effects of
watershed-scale land-use and land-cover changes.
43. GIS in groundwater
12/14/2022
Central University of Kerala
43
Although not as apparent as surface water flow,
groundwater can also be characterized spatially in a GIS
and analyzed by scientists and natural resource
managers.
Hydrogeology is especially well suited to GIS.
Groundwater flows from higher head to lower head at a
travel rate and flow path dictated by geology.
Head values, geology, groundwater flow direction, even
water table height and location of aquifers are among the
quantities which may be presented spatially in GIS and
used for analysis, management of water availability and
water quality, and land use practices.
44. 12/14/2022
Central University of Kerala
44
The volume of data can be managed in a GIS and manipulated to
display spatial characteristics for analysis and water resource
planning.
For example, in a simple application of GIS, the effect of a new well
can be studied on the existing groundwater and surface water.
The results of such a study can be used by decision makers to
determine whether or not to proceed with drilling.
An especially useful application of GIS concerns water quality in
groundwater.
For construction/situating of industrial plants, landfills, agricultural
activities, and other potential groundwater contamination sources,
it is useful to know how existing groundwater supplies could be
affected or would be at risk of impact
45. GIS In Oil Pollution
12/14/2022
Central University of Kerala
45
Spaceborne synthetic aperture radar (SAR) is proven to
be very useful in oil spill detection and monitoring.
Wide coverage provided by SAR-equipped satellites such
as European Envisat gives a good opportunity for
development of operational oil spill applications.
Recent use of SAR imagery in real-time oil spill detection
systems are associated with attempts to more fully
automate oil spill detection and identification.
Such systems usually combine hardware, software,
remote sensing technologies, geoinformation and
communication subsystems, and provide key information
for further analysis and decision making.
46. 12/14/2022
Central University of Kerala 46
Subscene of the Envisat ASAR WSM image acquired on 7.08.2006 at 18:30 UTC
over the North Caspian Sea
47. photo of the Astra oil drilling platform
12/14/2022
Central University of Kerala 47
48. 48
view of oil spill
monitoring system
based on Geographic
Information System
12/14/2022
Central University of Kerala
49. 12/14/2022
Central University of Kerala
49
GIS providing an efficient storage, retrieval, analysis
and visualization of geographic, environmental and
industrial information is considered to support oil
spill monitoring and identification.
50. Coastal and Marine applications
12/14/2022
Central University of Kerala
50
GIS enable you to better understand and represent the
systems at work in the seas and oceans.
From the coastal shoreline to the bathymetric bottom,
marine GIS has been adapted and implemented to help
to achieve goals in coastal zone management, research,
ocean industries, and navigation.
Esri's ArcGIS software provides tools for data storage
and access, analysis, and modeling ocean features.
GIS technology enables you to integrate coastline, depth,
channel, obstruction, and landmark information,
resulting in improvements in navigational efficiencies,
commerce, and safety and greater situational awareness.
51. Application Of GIS In EIA
12/14/2022
Central University of Kerala
51
Geographical information systems can be applied at all EIA
stages. EIA is a decision process, which aims to both identify
and anticipate impacts on the natural environment.
GIS can also be explored within the EIA process to improve
different features, mainly related to data storage and access,
to the analytical capabilities and to the communicability of the
results
GIS will bring to the EIA process a new way of analyzing and
manipulating spatial objects and an improved way of
communicating the results of the analysis, which can be of
great importance to the public participation process.
The use of GIS in the EIA process, where public participation
is of great importance, requires the development of
applications allowing a better understanding of spatial
phenomena.
52. 12/14/2022
Central University of Kerala
52
During the EIA process many different variables and
phenomena presenting complex interrelationships, which
vary in space and time are considered.
The capabilities of GIS in EIA are:
It is possible to store large amounts of different kinds of data.
The access to these rich databases allows the performance of
dynamic queries based on real world representations.
Concerning the analytical capabilities, some potential
functionality can be added such as the use of interactive video
and digital sound associated with zoning maps, to help
planners and decision-makers to visualize and better evaluate
the impact of a new infrastructure.
53. 12/14/2022
Central University of Kerala
53
The development of GIS for EIA requires the analysis of
this process in order to identify the tasks that will be
beneficial.
GIS offers a group of operations for the manipulation of
data to reveal complex inter-relationships that otherwise
would not be detected.
54. Simulation of Dynamic Models in the
Frame of the GIS
12/14/2022
Central University of Kerala
54
Environmental modelling has been growing up
separately for a long time, so simulation systems of
environmental models differ in data structures, functions
and methods for sharing spatial information.
Generally, a few levels of model integration exist in the
GIS.
The obstacles with a data exchange can be overcome by
rewriting environmental models into a form in which
they can directly use data from GIS data structures.
The vectors are in the GIS represented by points, lines
and polygons.
Spatial data structures describe their location, shape and
topology. The raster structures form regular grids
55. GIS Based Monitoring & Modelling Tools
12/14/2022
Central University of Kerala
55
The synthesis of GIS and dynamic modelling is realized by
programming modules inside the GIS.
Map layers are complemented with attribute tables, which
contain the experimental data and model outputs.
The environmental models and analysis are divided into a few
classes. The individual classes are focused on the air, surface
water, landscape, soil and groundwater phenomena.
Each class contains its modelling and analysis tools.
These data and modelling tools are complemented by other
information needed for decision-making process
The model solutions are aggregated and analysed together
with the raster algebra tools in the frame of the GIS.
58. GIS for Mining
12/14/2022
Central University of Kerala
58
Mineral exploration geoscientists use diverse types of
datasets to search for new economic deposits.
GIS is an ideal platform to bring them together in a
geoscientist’s computer and deliver meaningful
outcomes.
GIS is now able to help geoscientists in many aspects of
their activities: data collection, management, analysis,
and reporting.
Field geologists can now capture field data electronically
using ArcPad and GPS receivers.
All of these datasets can be integrated, manipulated, and
analyzed using GIS.
59. 12/14/2022
Central University of Kerala
59
Engineers and operations staff use GIS for facility planning
applications.
Keeping track of existing infrastructure and integrating it
with the mine plan and block models can be achieved with
GIS.
GIS can also be used to integrate recent survey data with
block models or mine design data from other mining
software packages such as GeoSoft, Vulcan, MineSight,
SURPAC Range, or Mining Visualization System (MVS).
Management and mineral economists are using GIS in their
evaluation of corporate and competitor assets.
60. 12/14/2022
Central University of Kerala
60
Mining companies also use GIS to actively monitor the
environmental impacts that may be caused by their
activities and conduct reclamation.
Various types of geologic datasets, such as geophysical
images, geochemistry, geologic maps, radiometric
measurements, boreholes, and mineral deposits, can be
displayed, interrogated, and analyzed simultaneously using
GIS.