Download to read offline
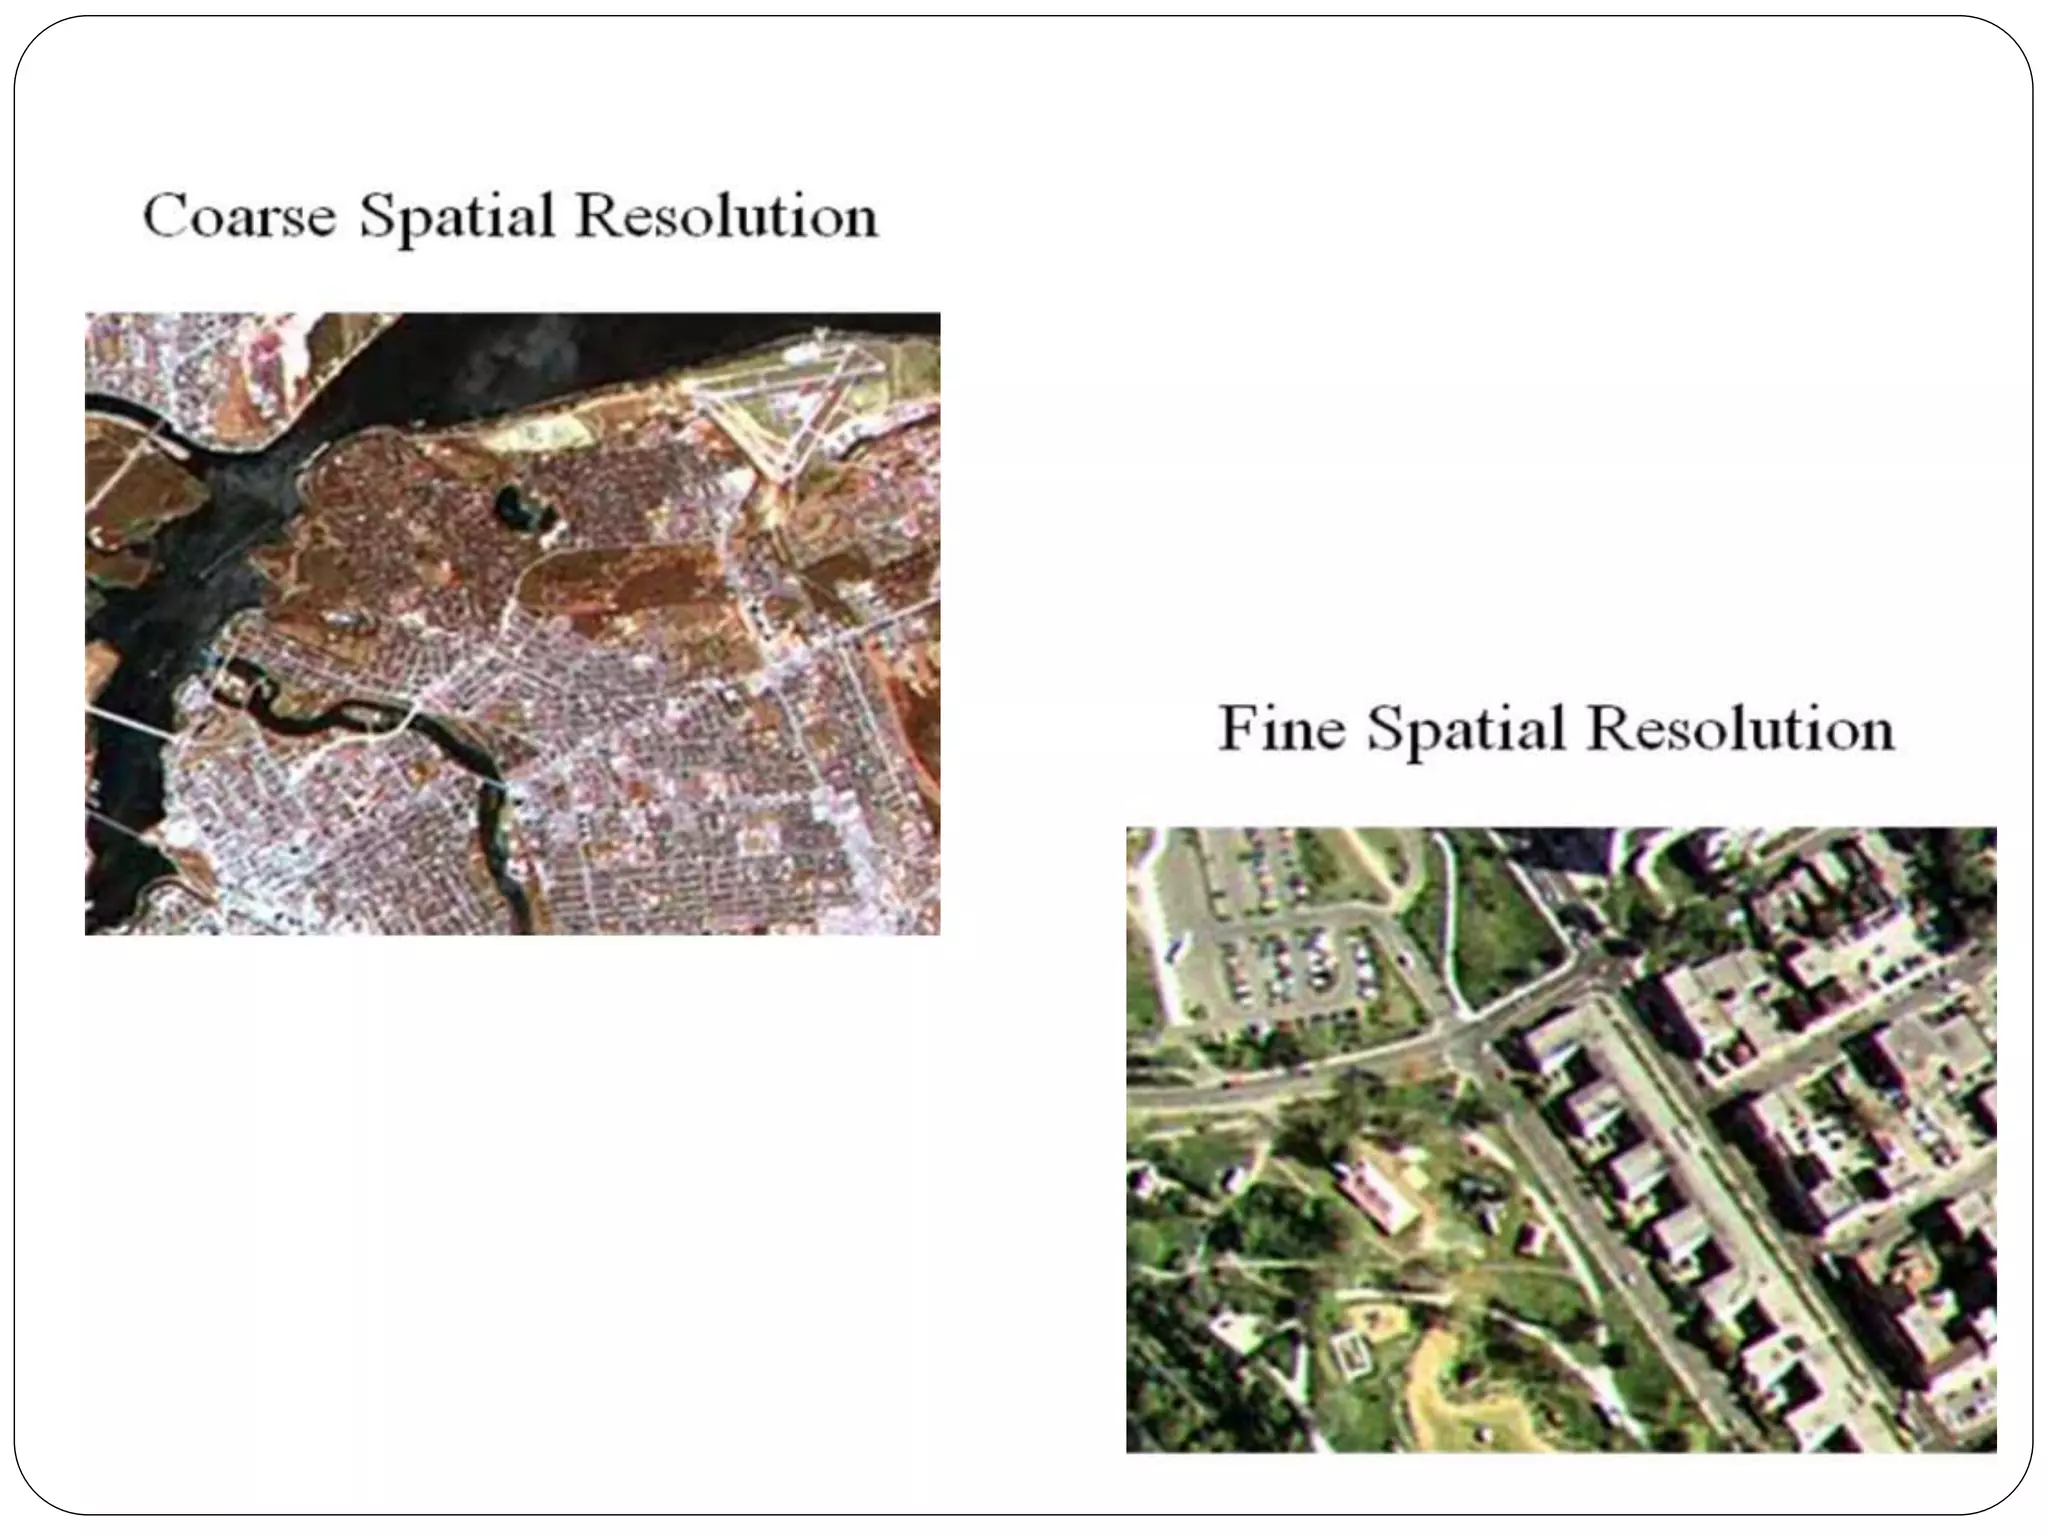
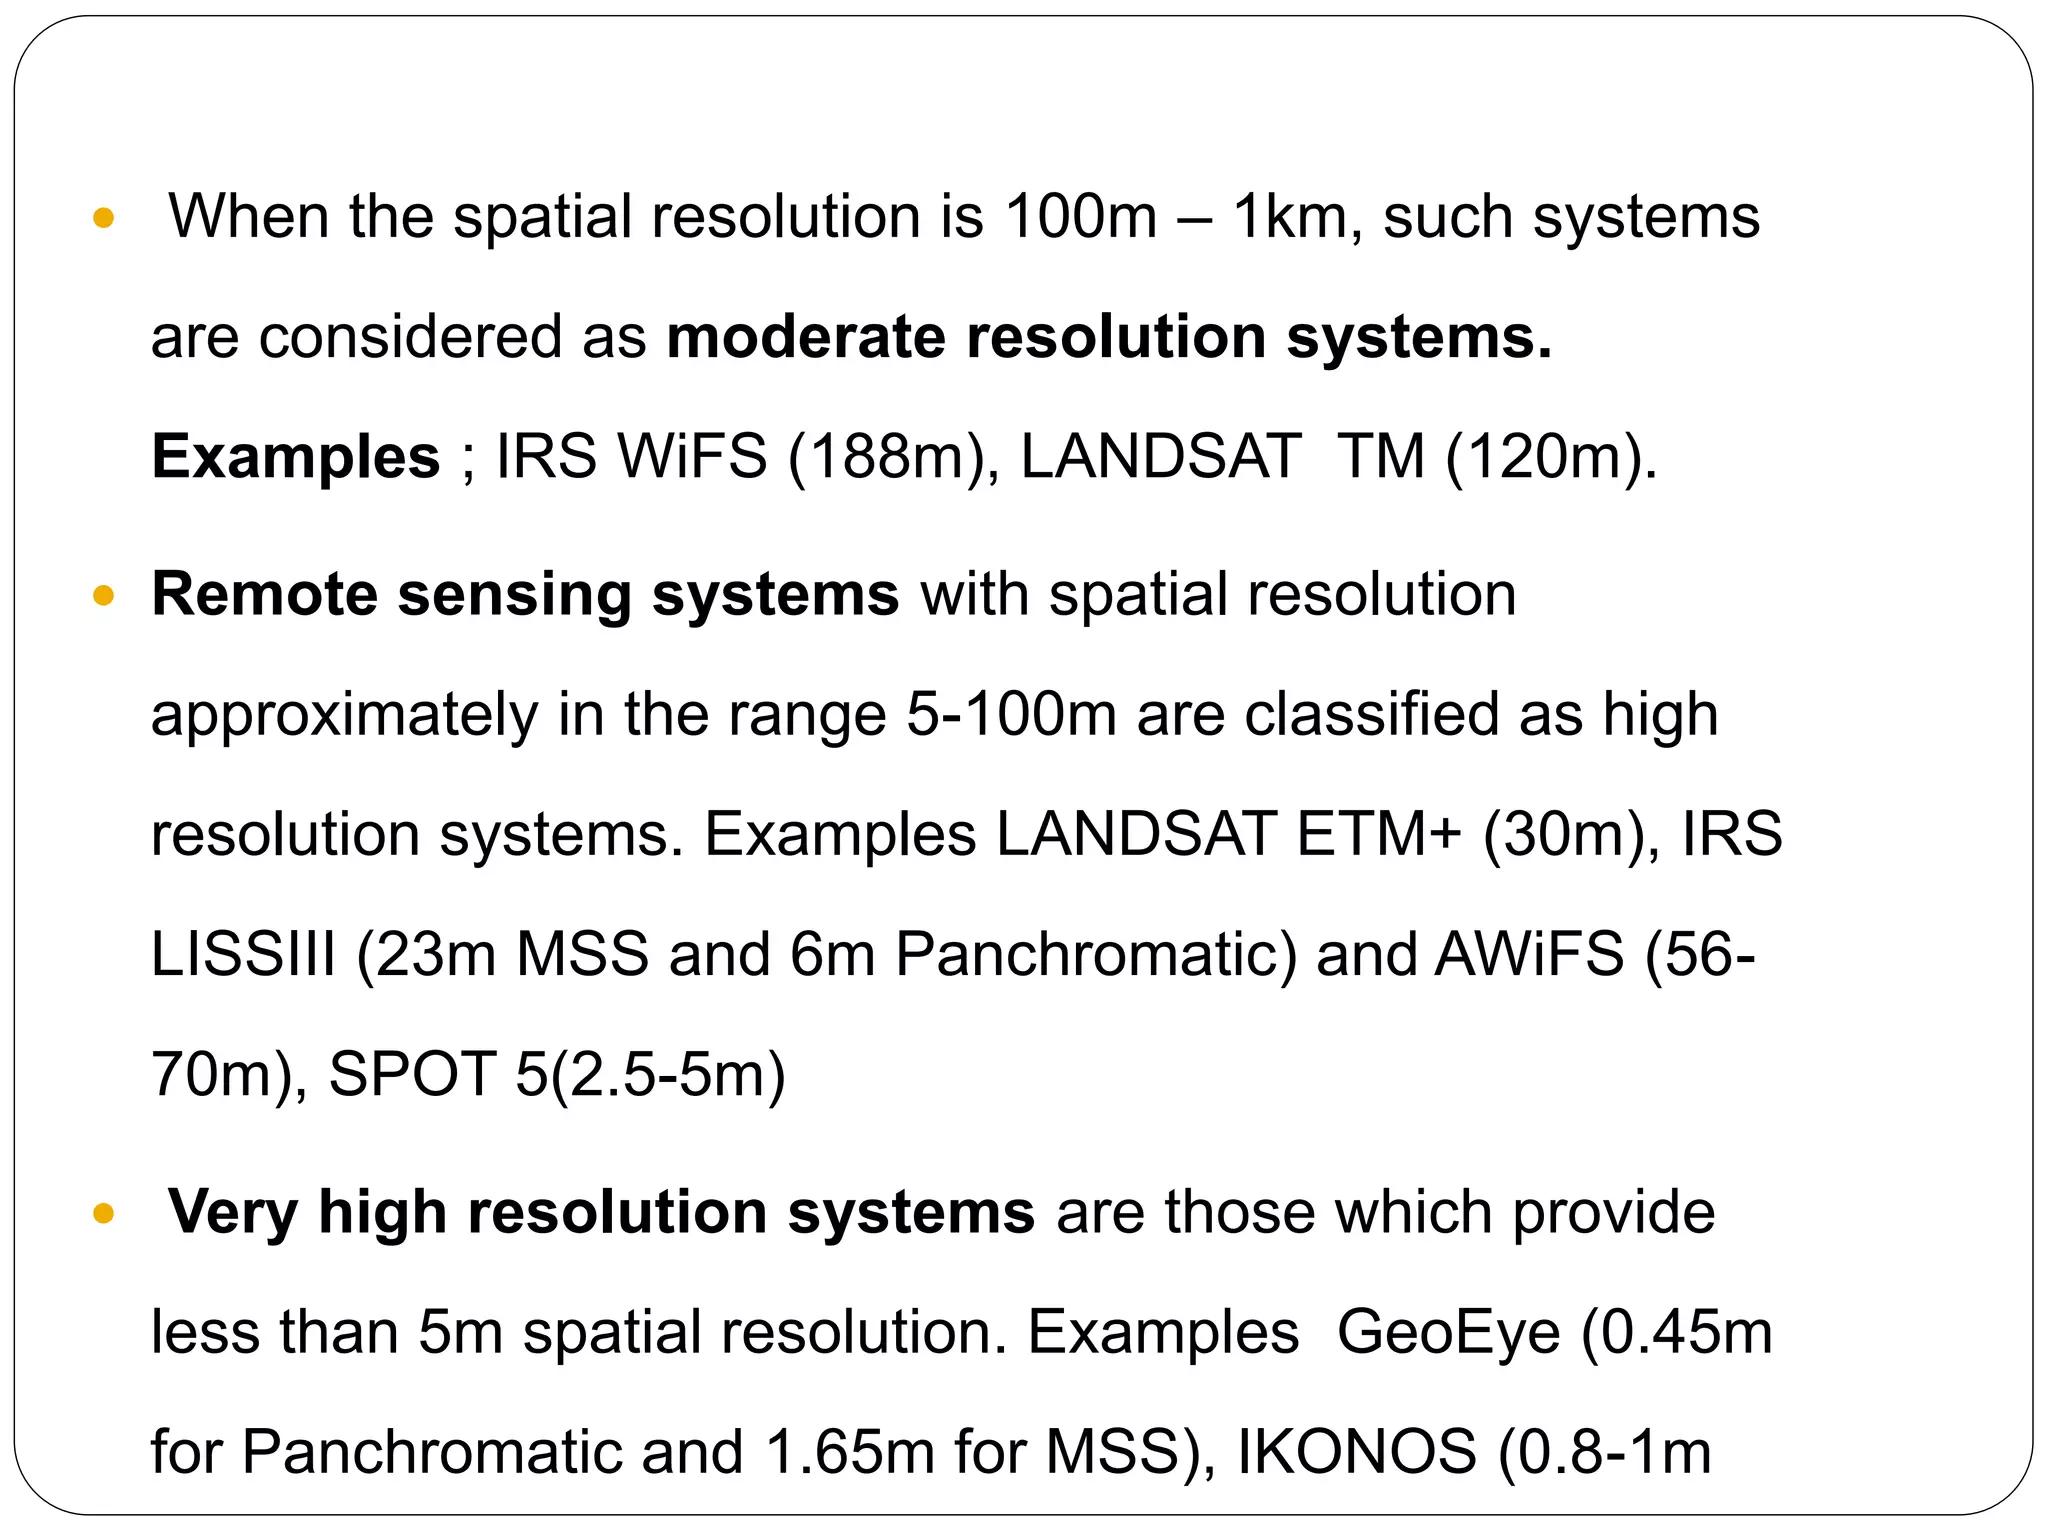
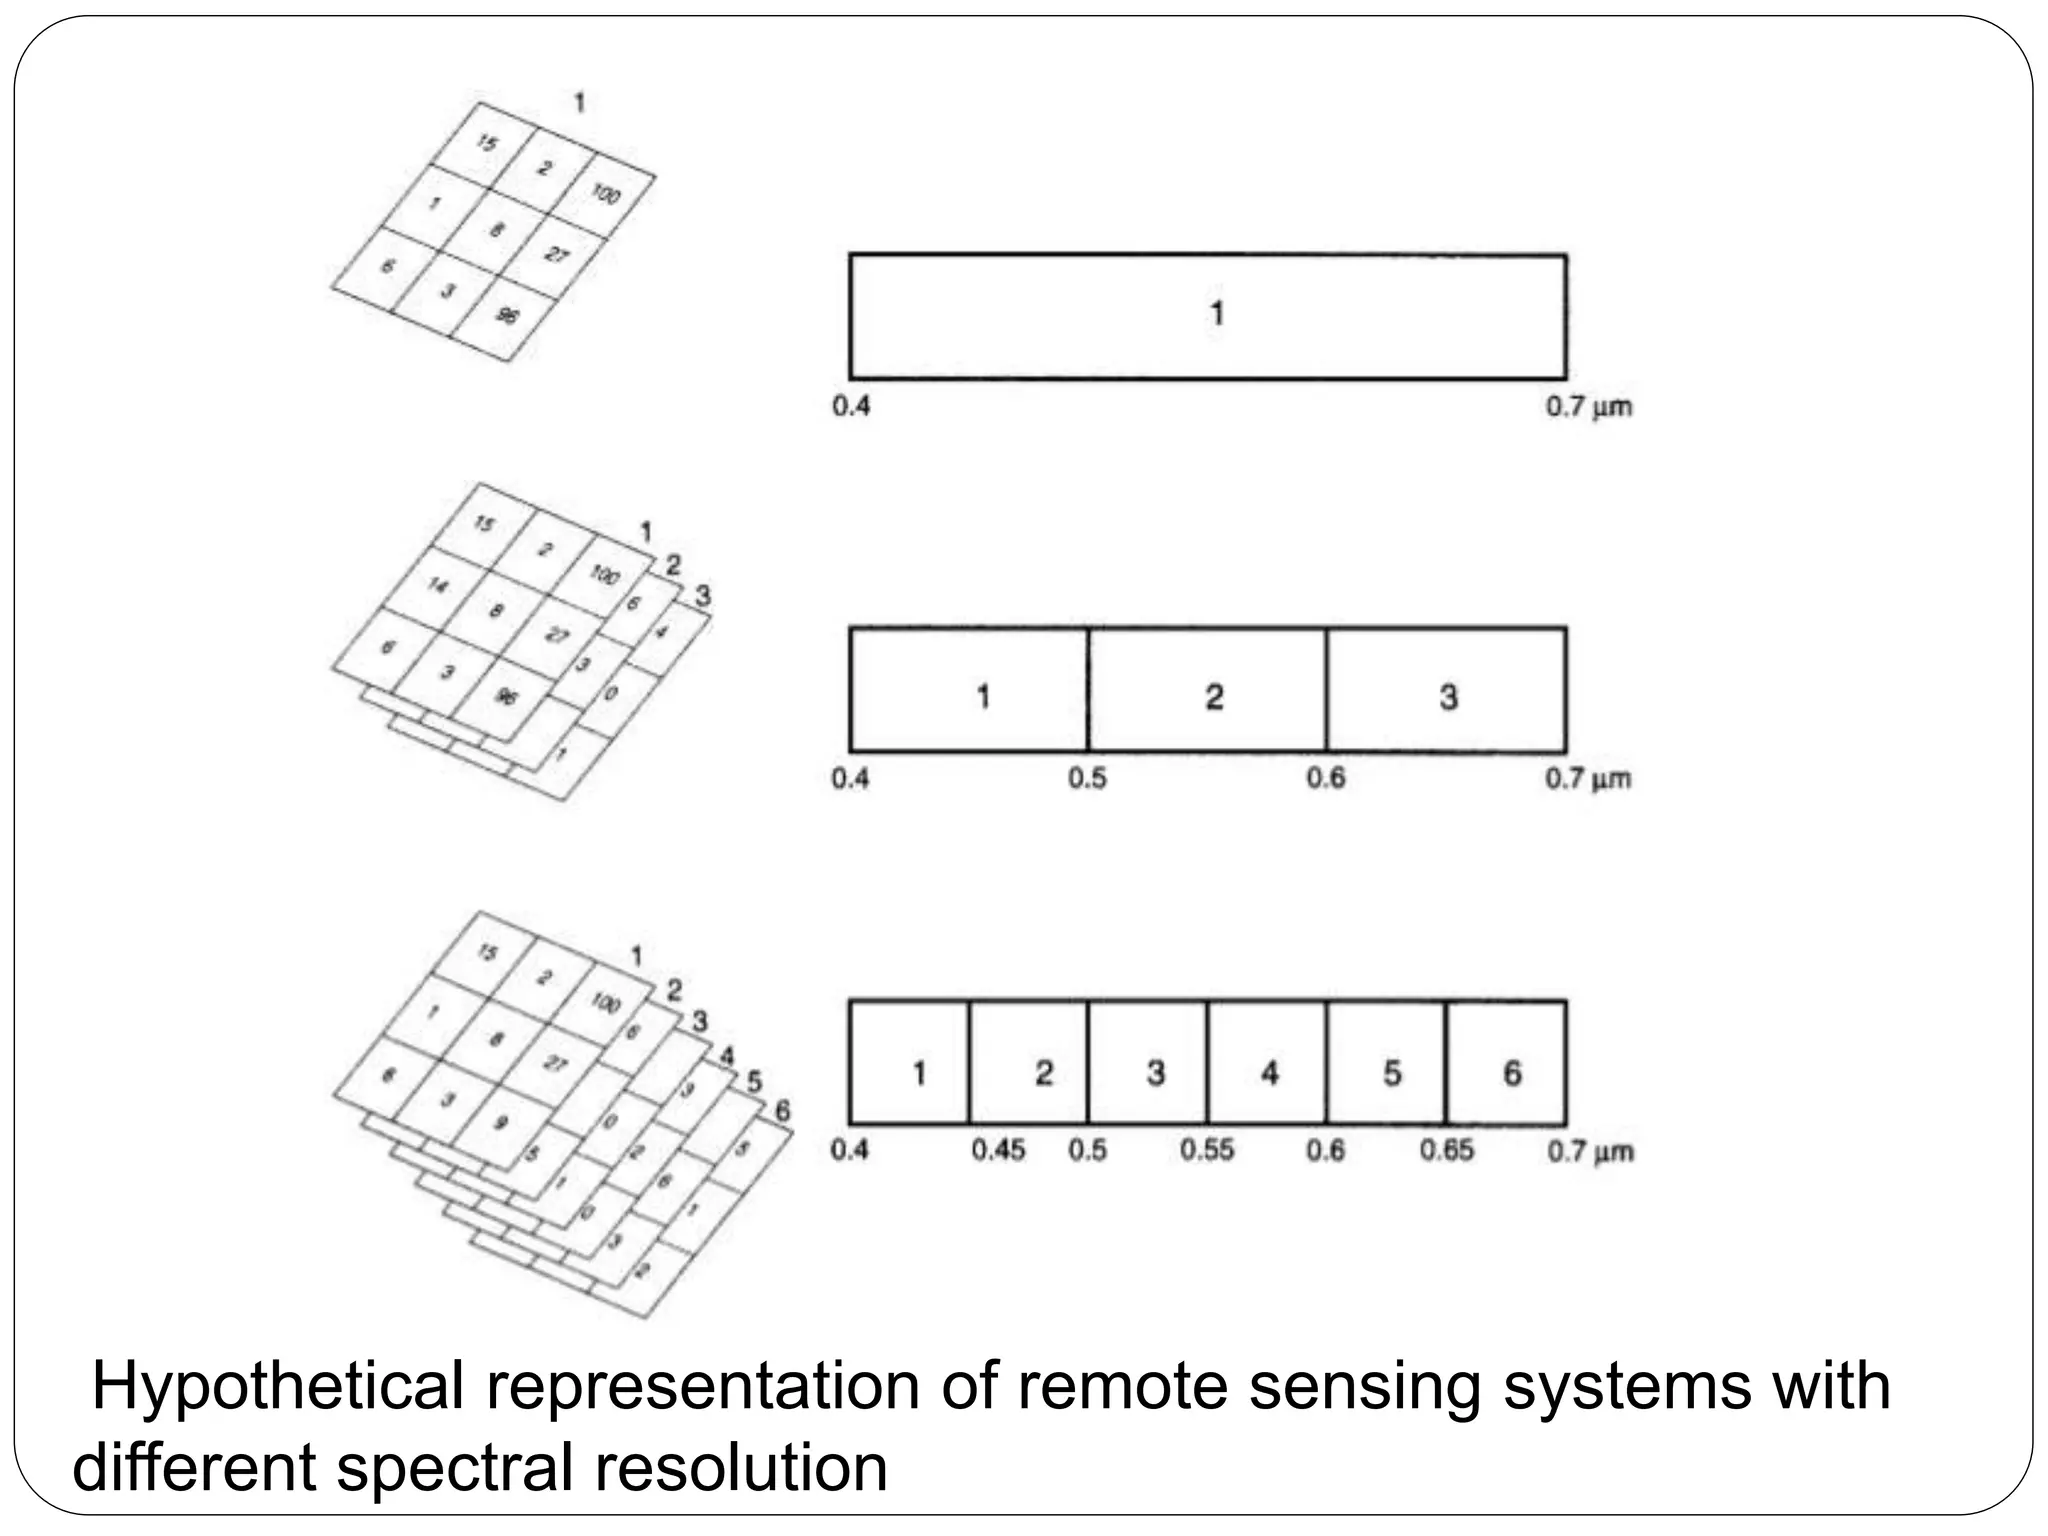
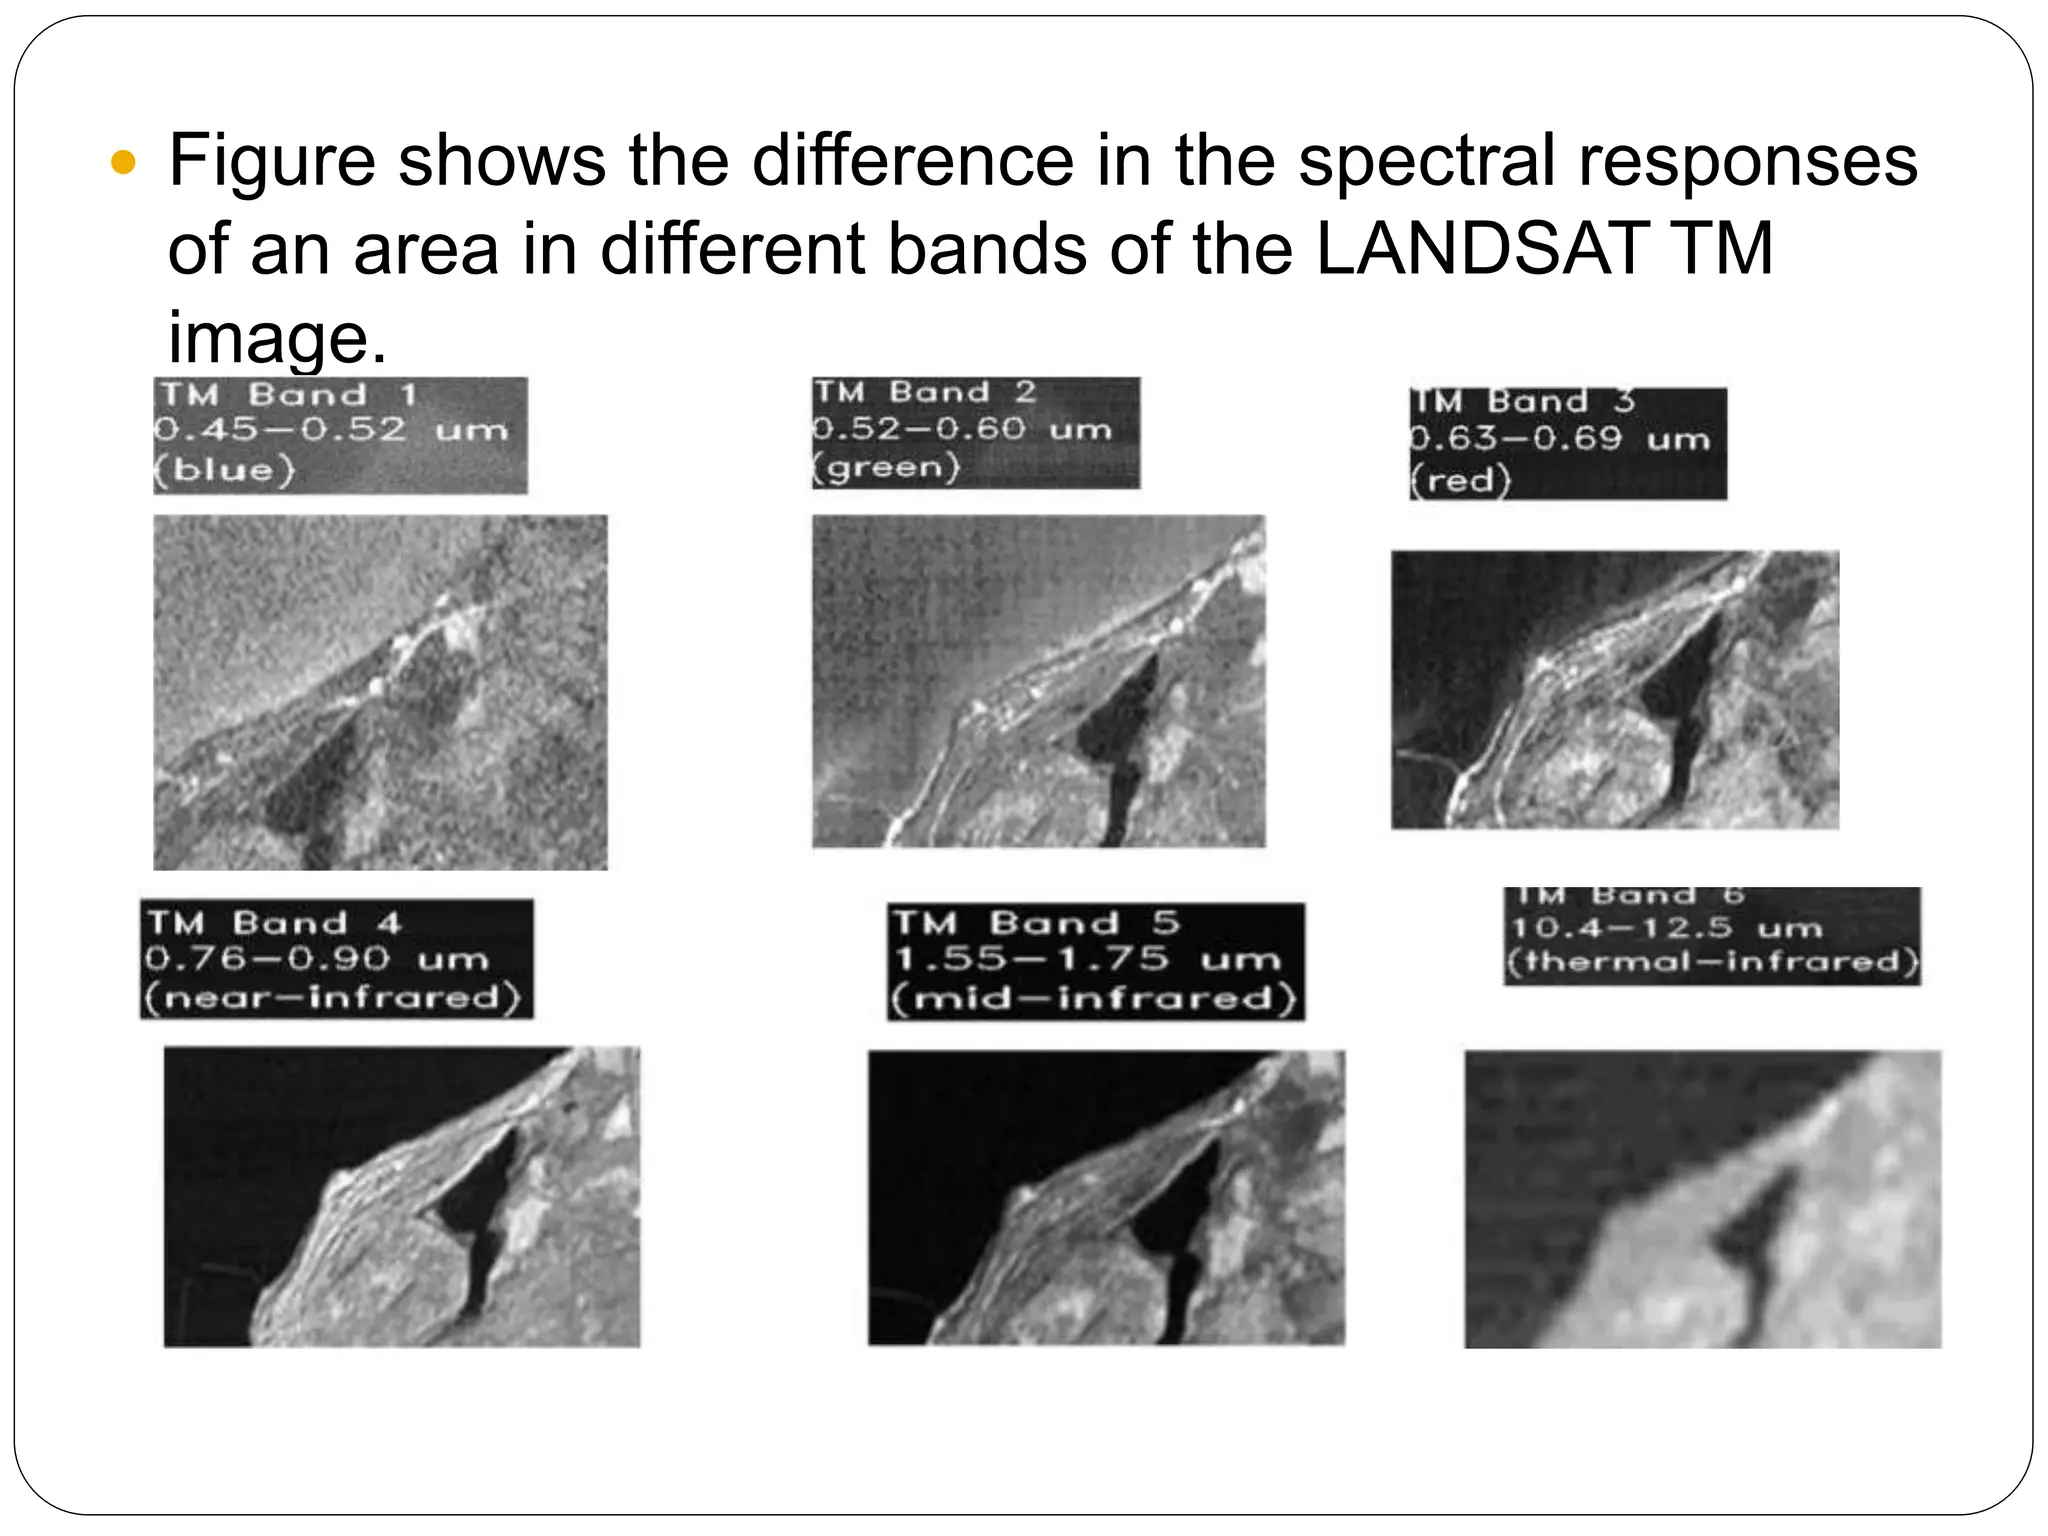
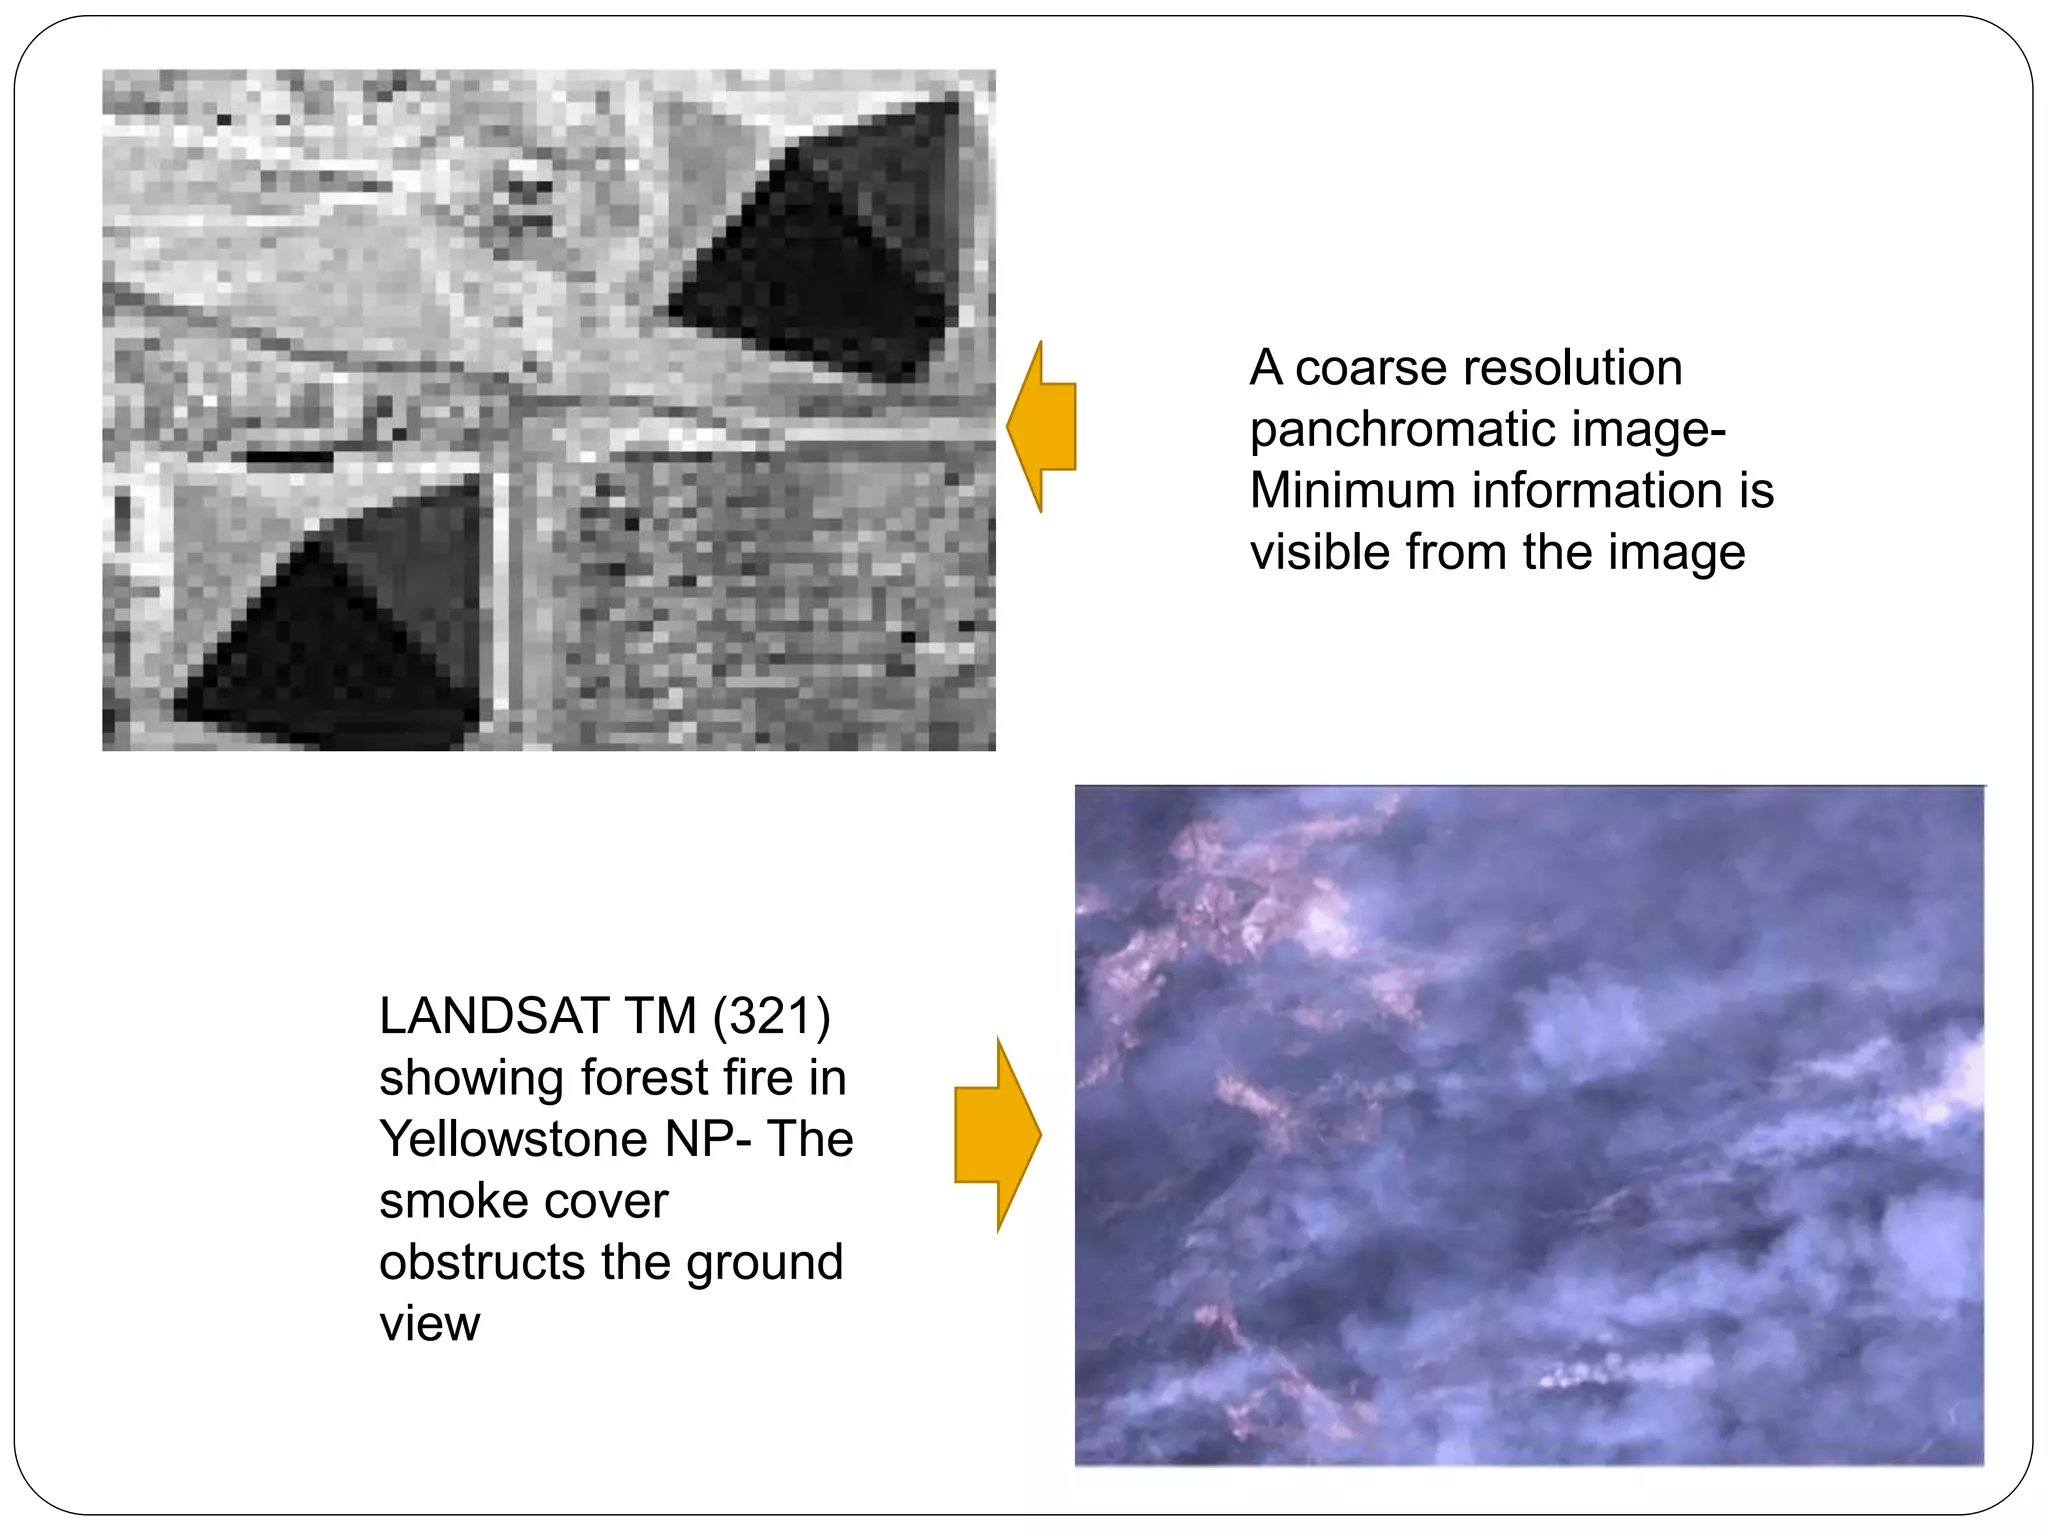
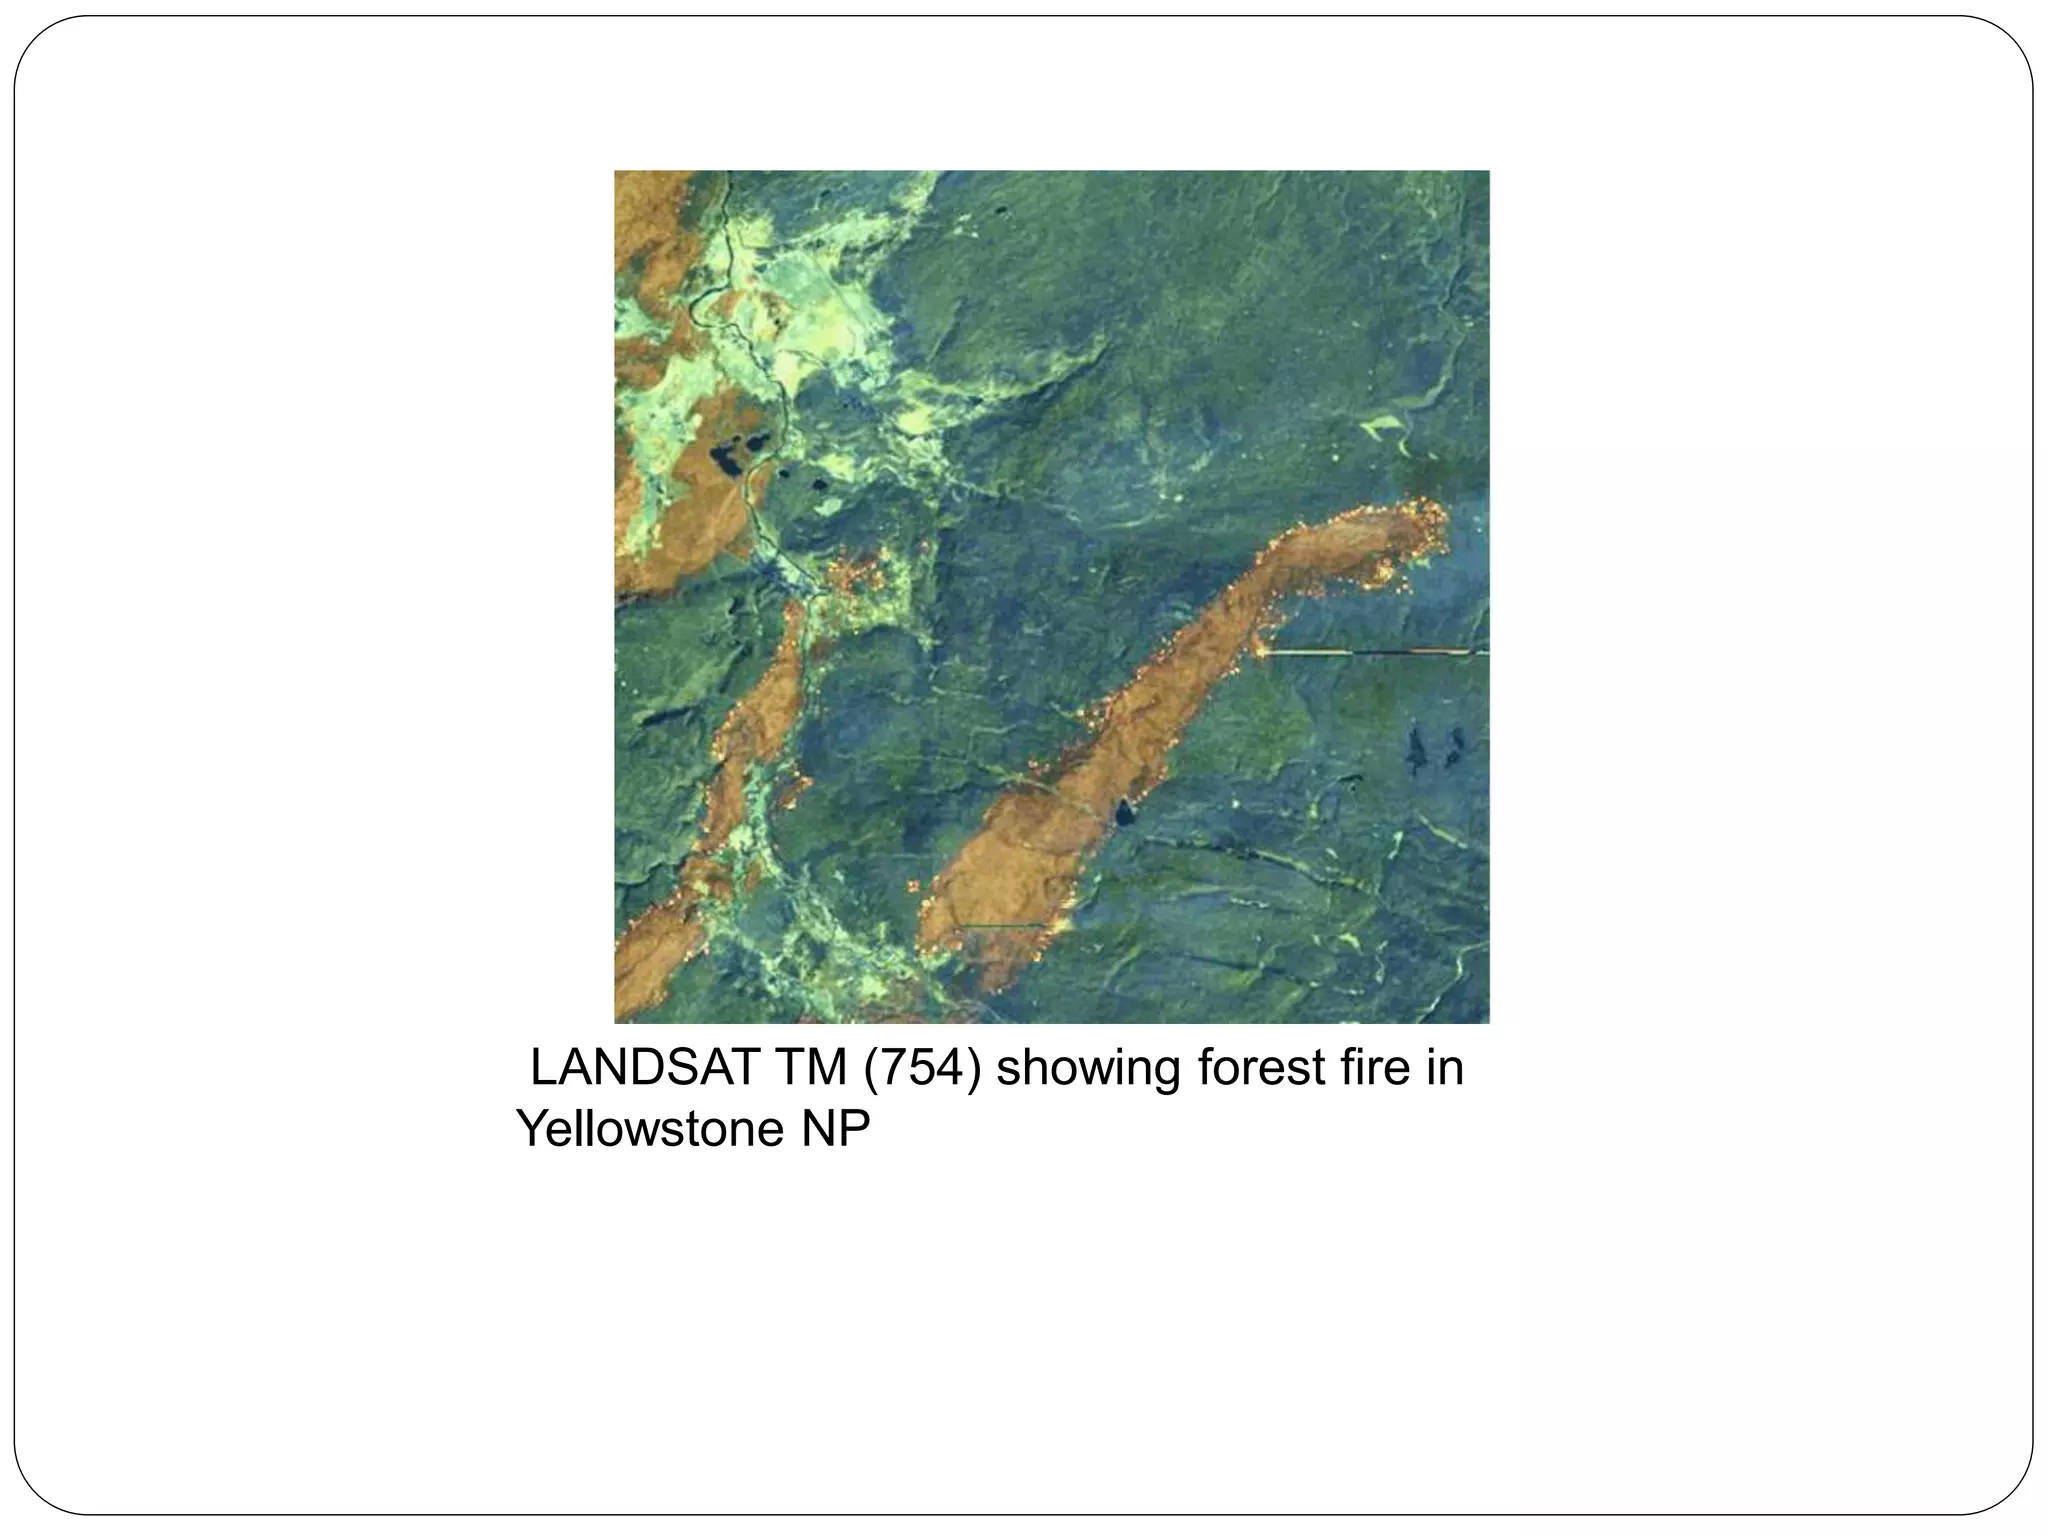

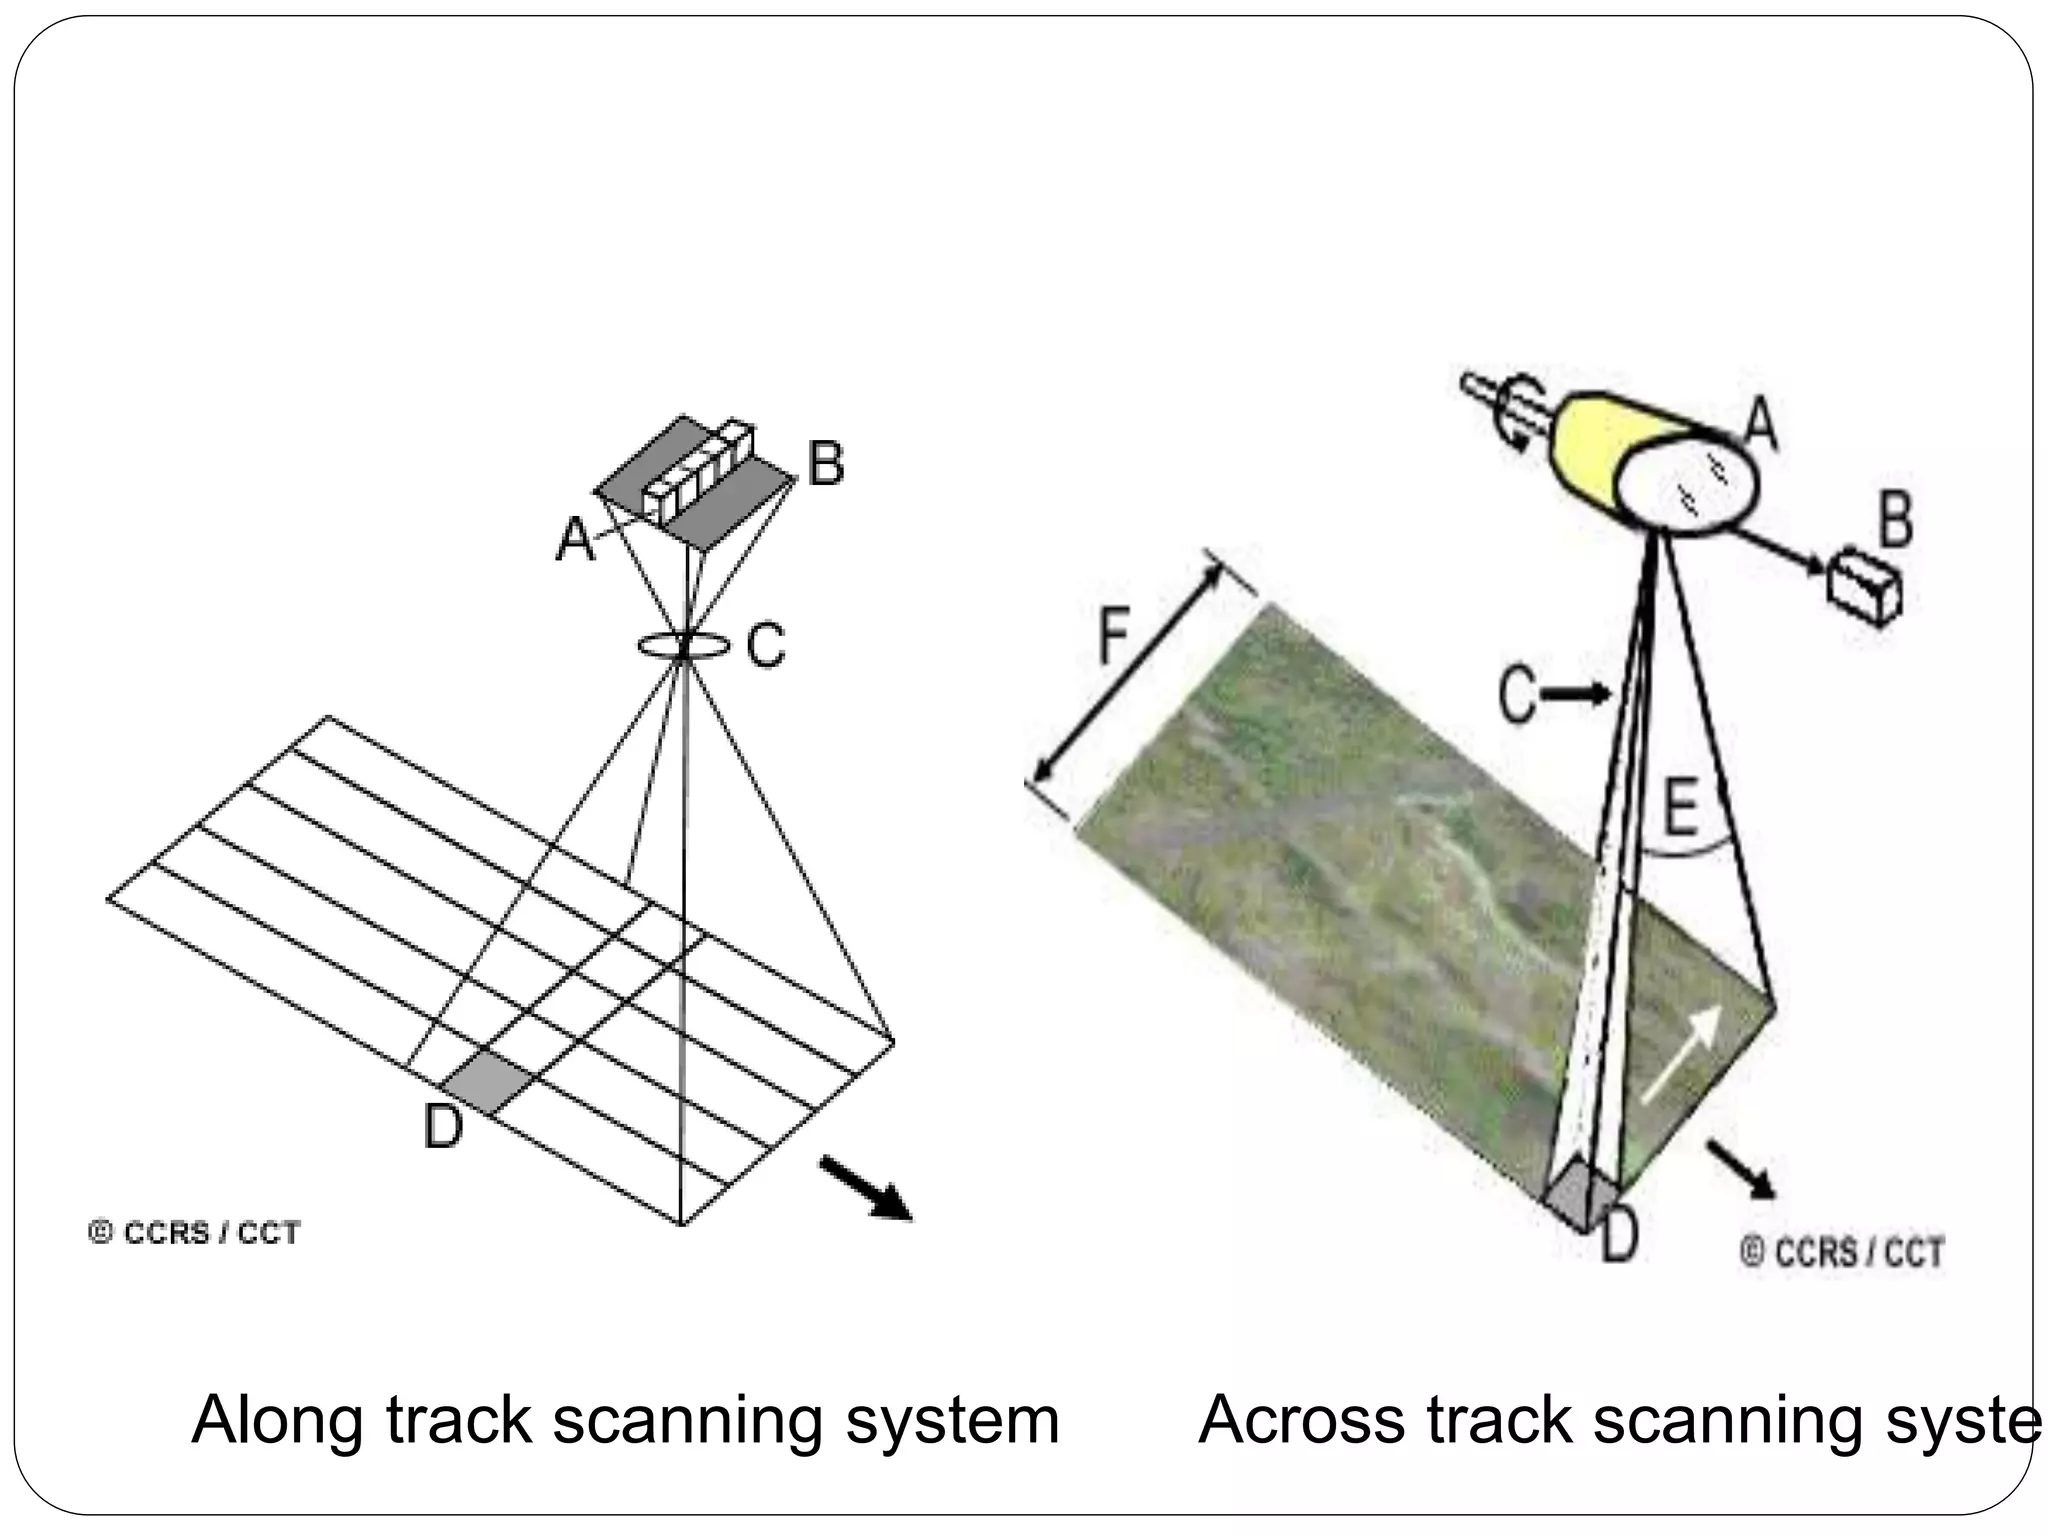


The document describes remote sensing instruments, particularly their spatial, spectral, temporal, and radiometric resolutions. It classifies satellite systems based on spatial resolution, ranging from low to very high resolution, and explains the significance of spectral resolution in distinguishing surface features. The document also elaborates on multispectral imaging sensor systems and their scanning methods, including along-track and across-track scanning.


