Downloaded 275 times
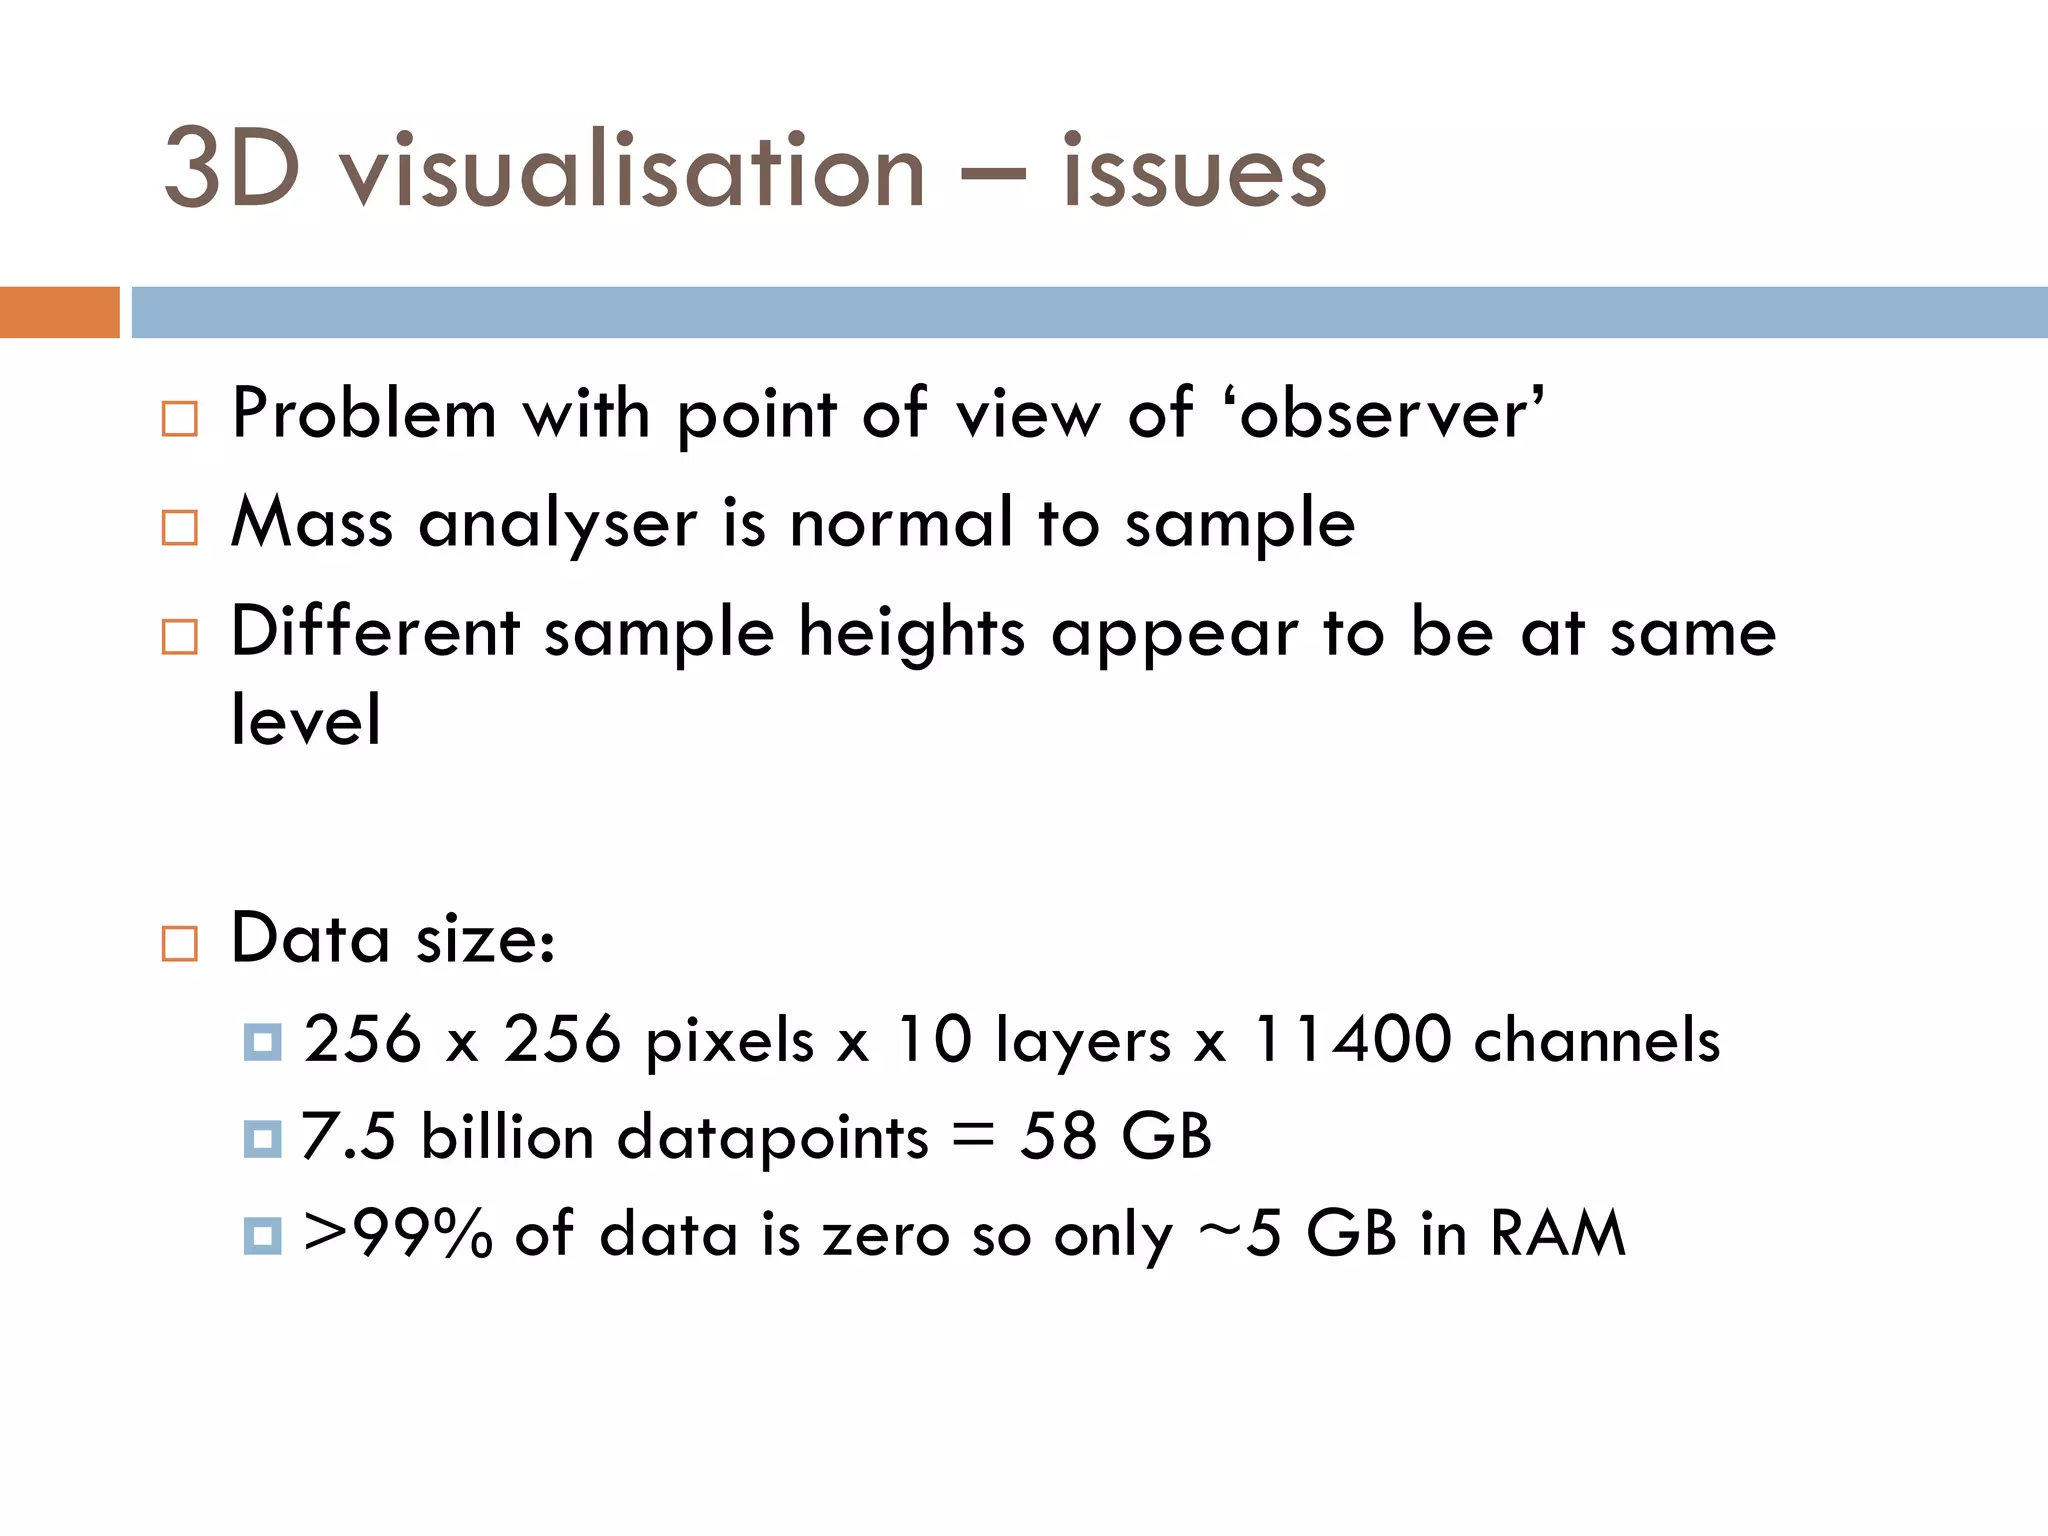
![High mass resolution required
Nominally all at m/z 86
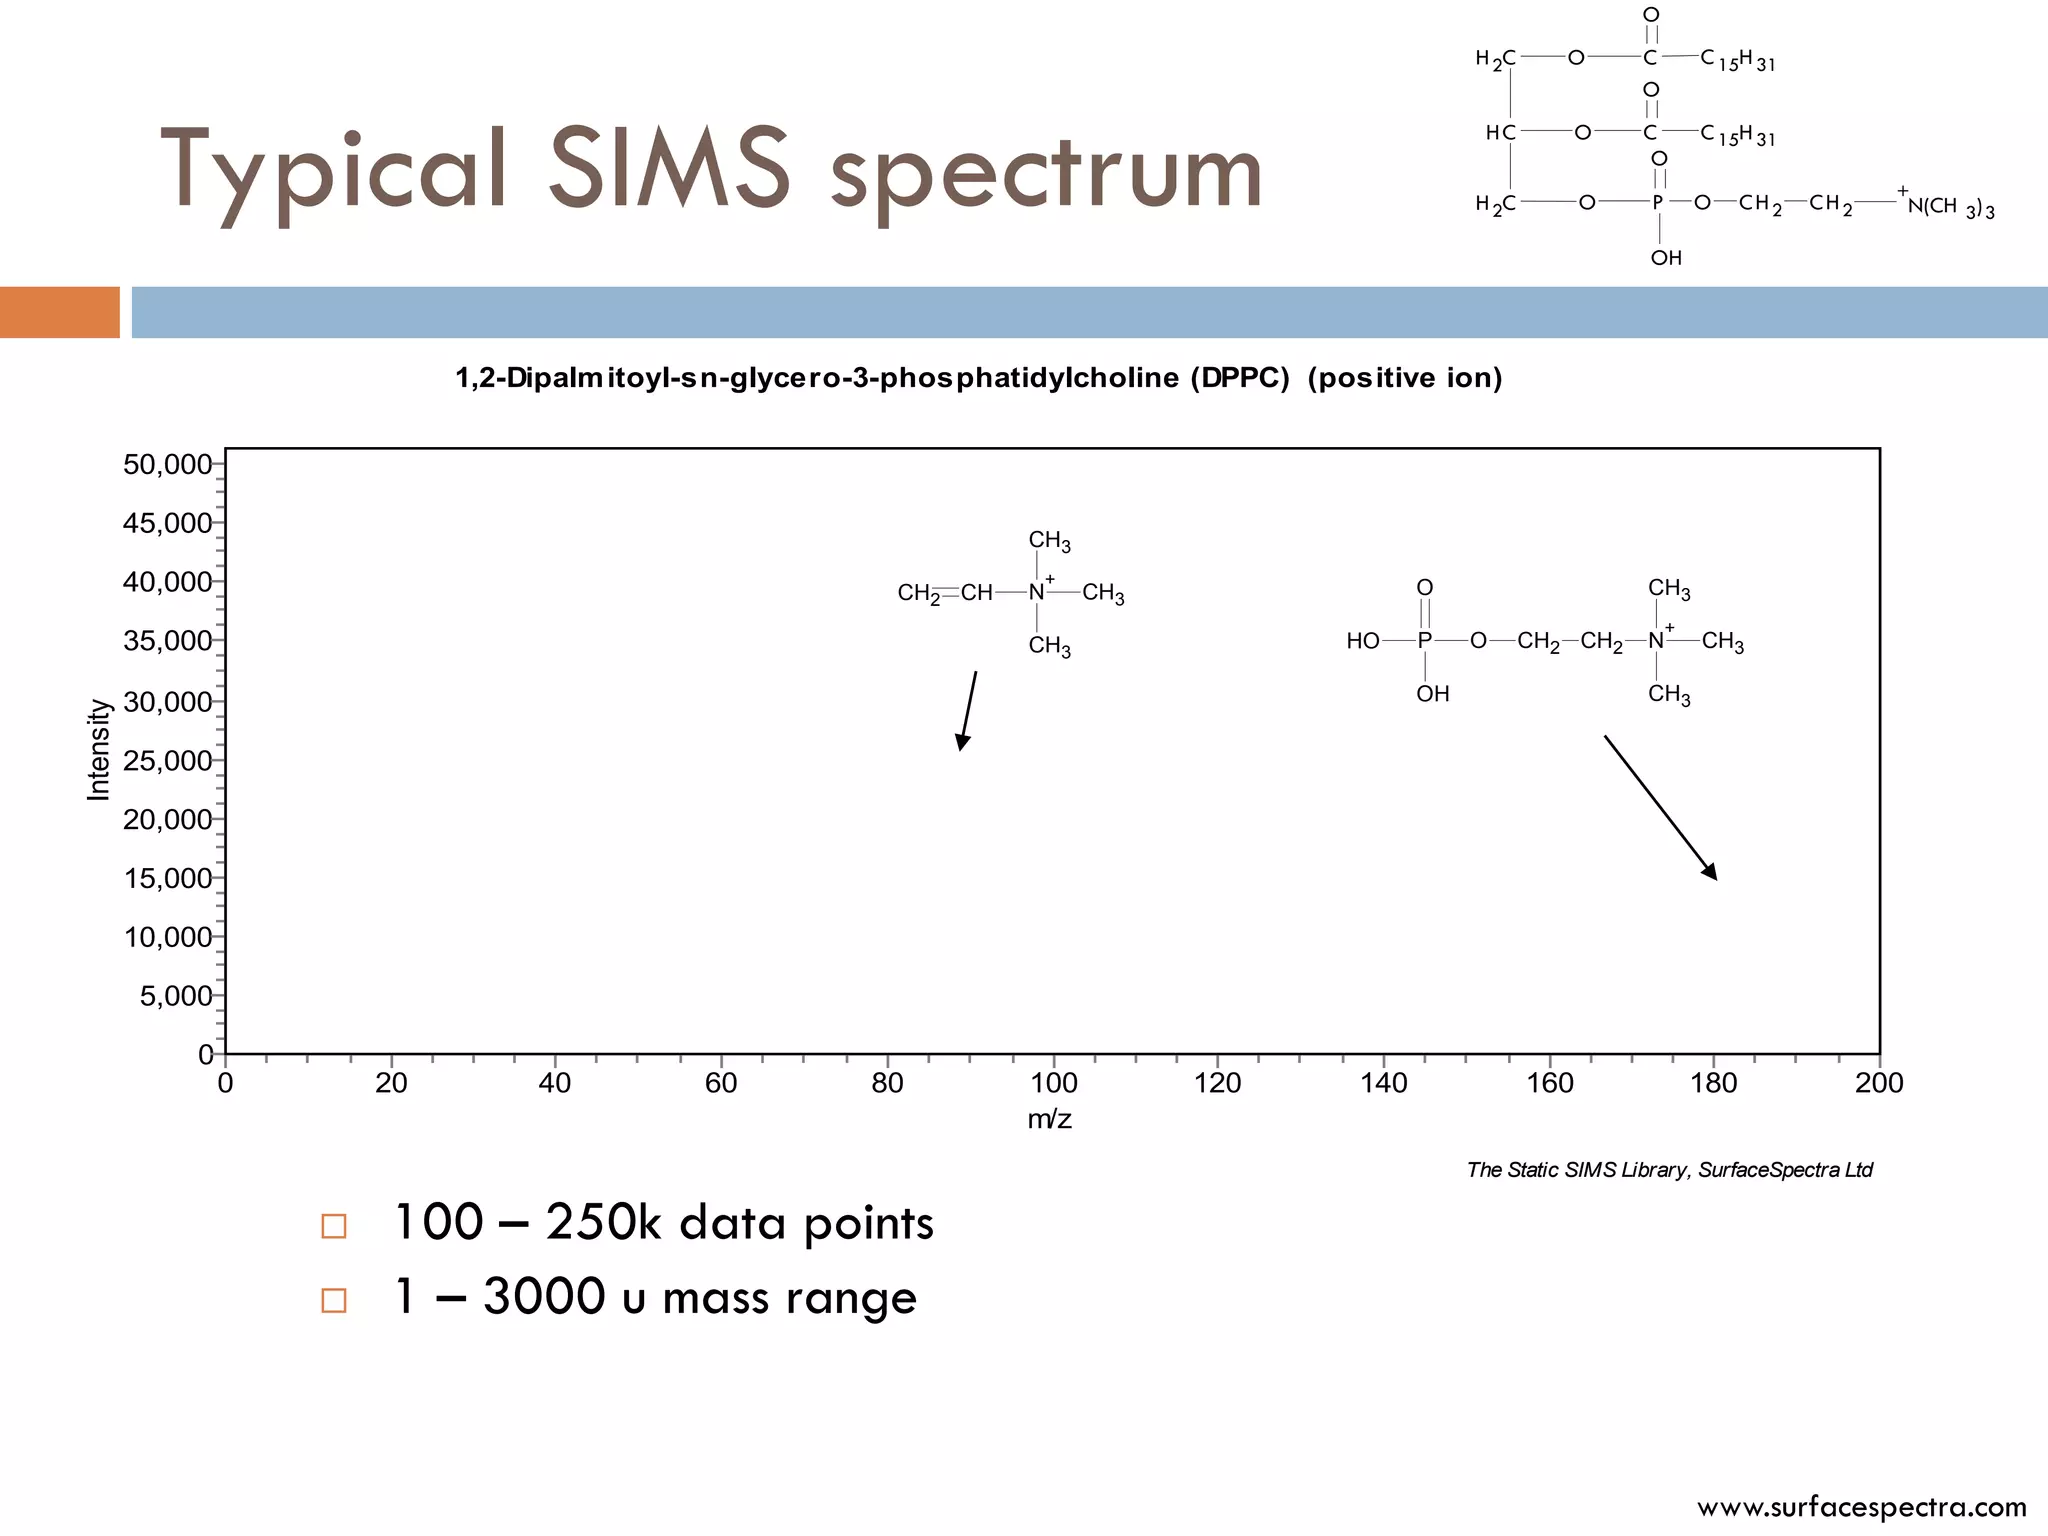
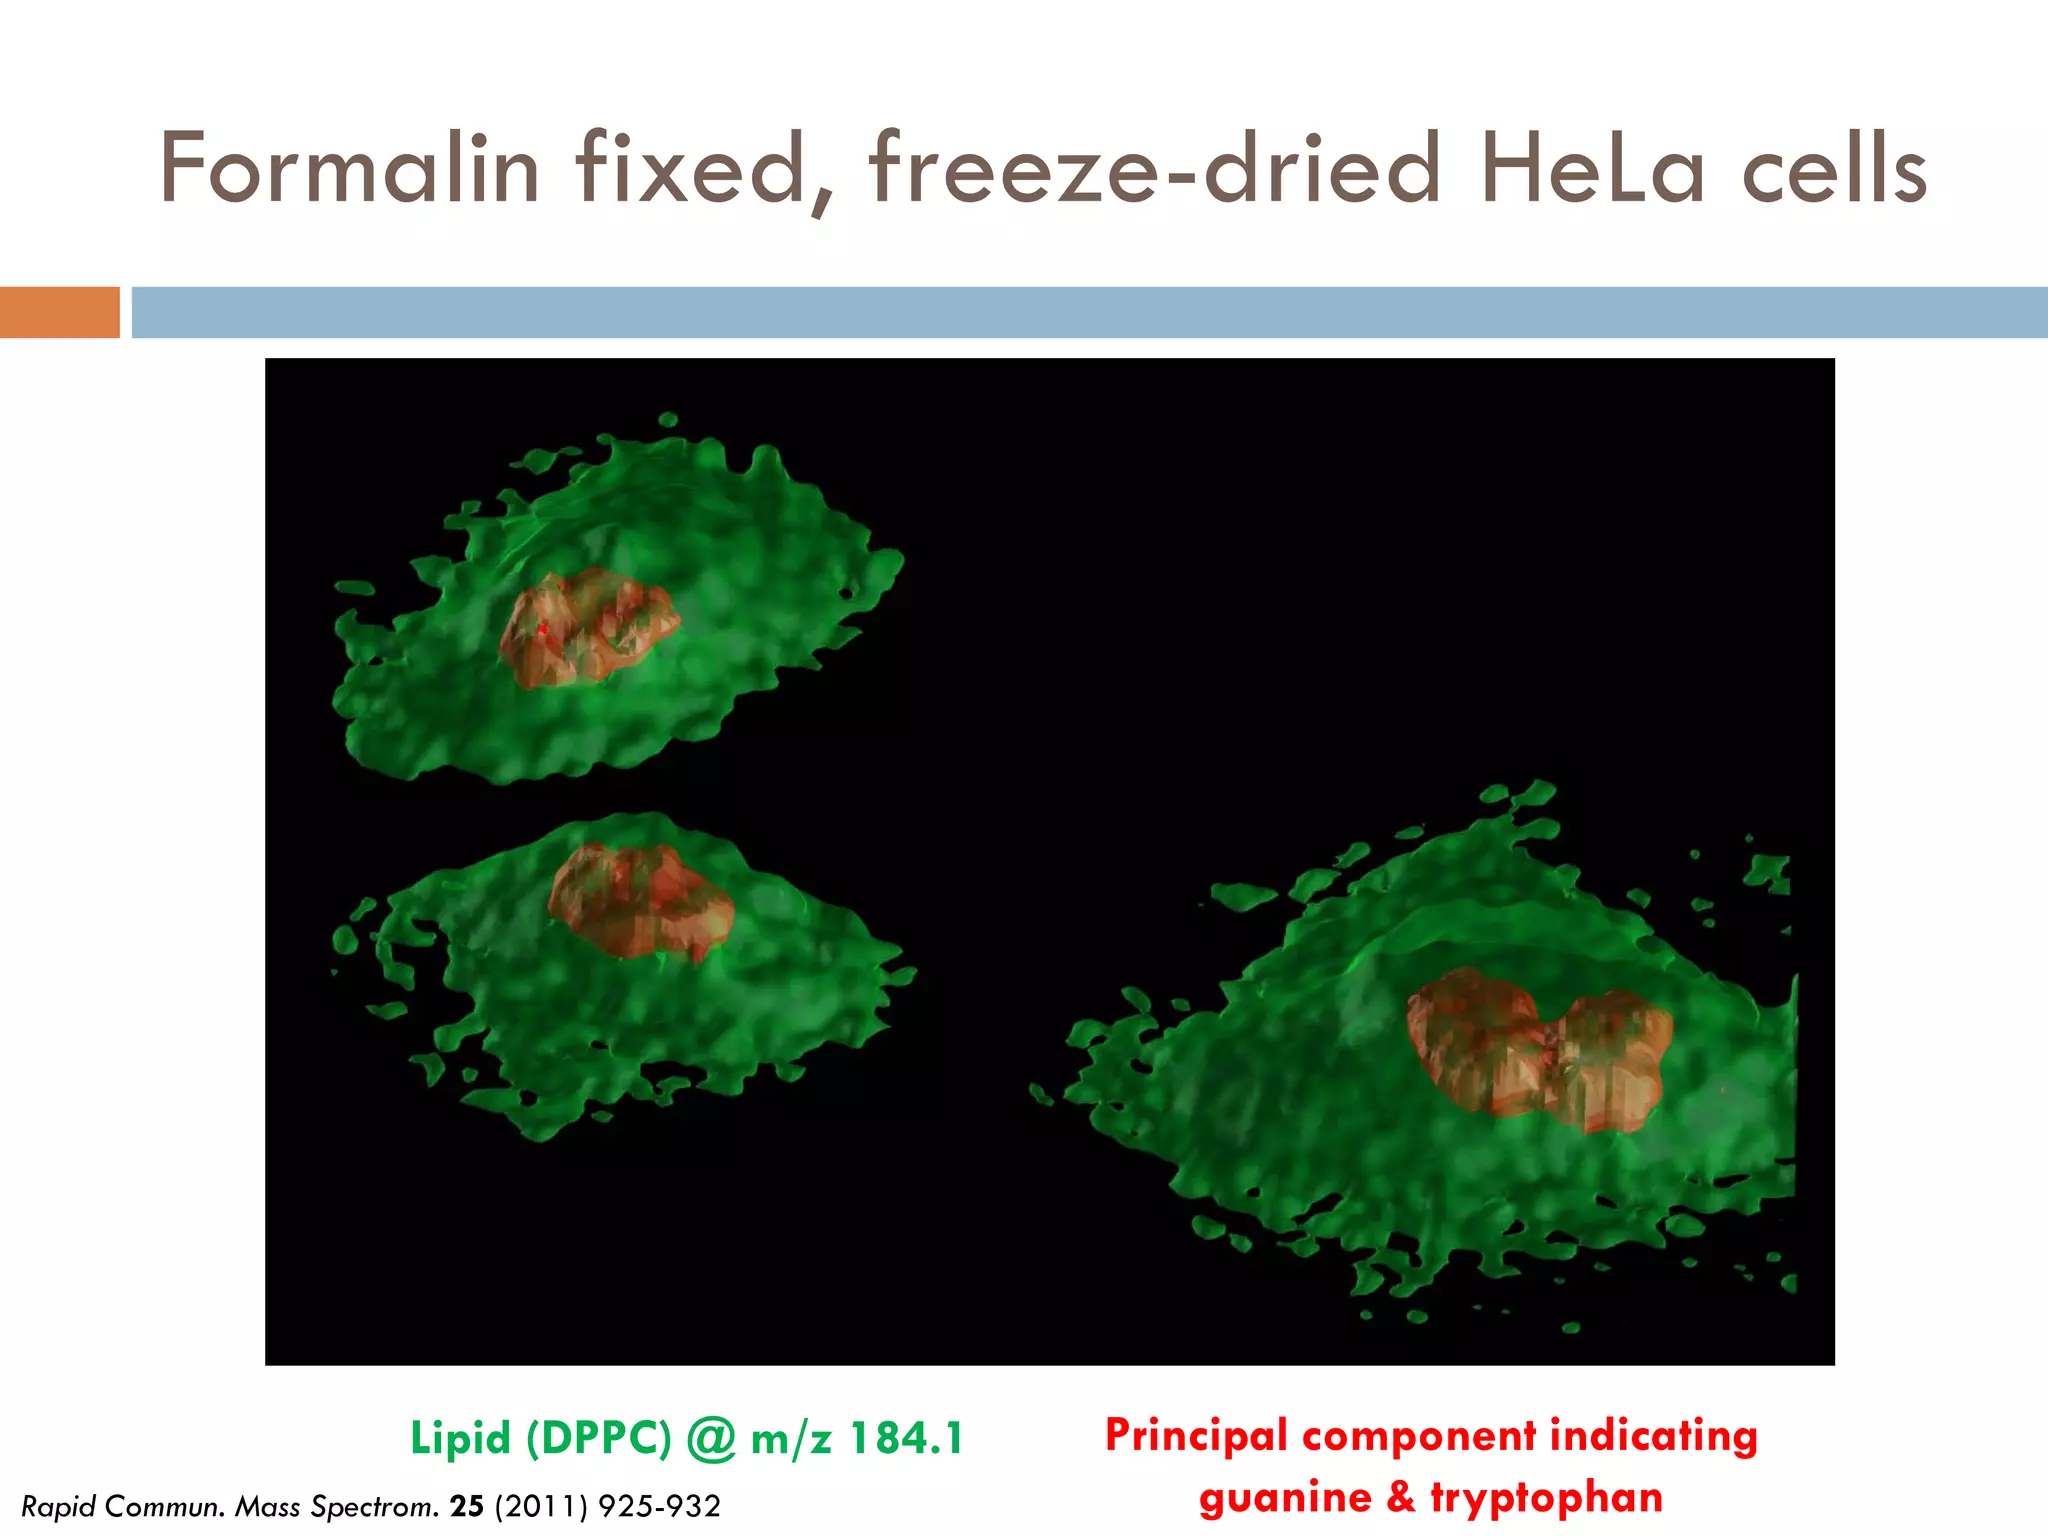
Lipid (DPPC)
m/z = 86.0969692
Unknown
Silicon substrate [Si3H2]+
m/z = 85.9464332
Separation = 0.15 u
m/z 86
Analytical chemistry 80 (2008) 9058-9064](https://image.slidesharecdn.com/hendersonms-at-mmay2012forslideshare-120509103001-phpapp02/75/Secondary-Ion-Mass-Spectrometry-19-2048.jpg)
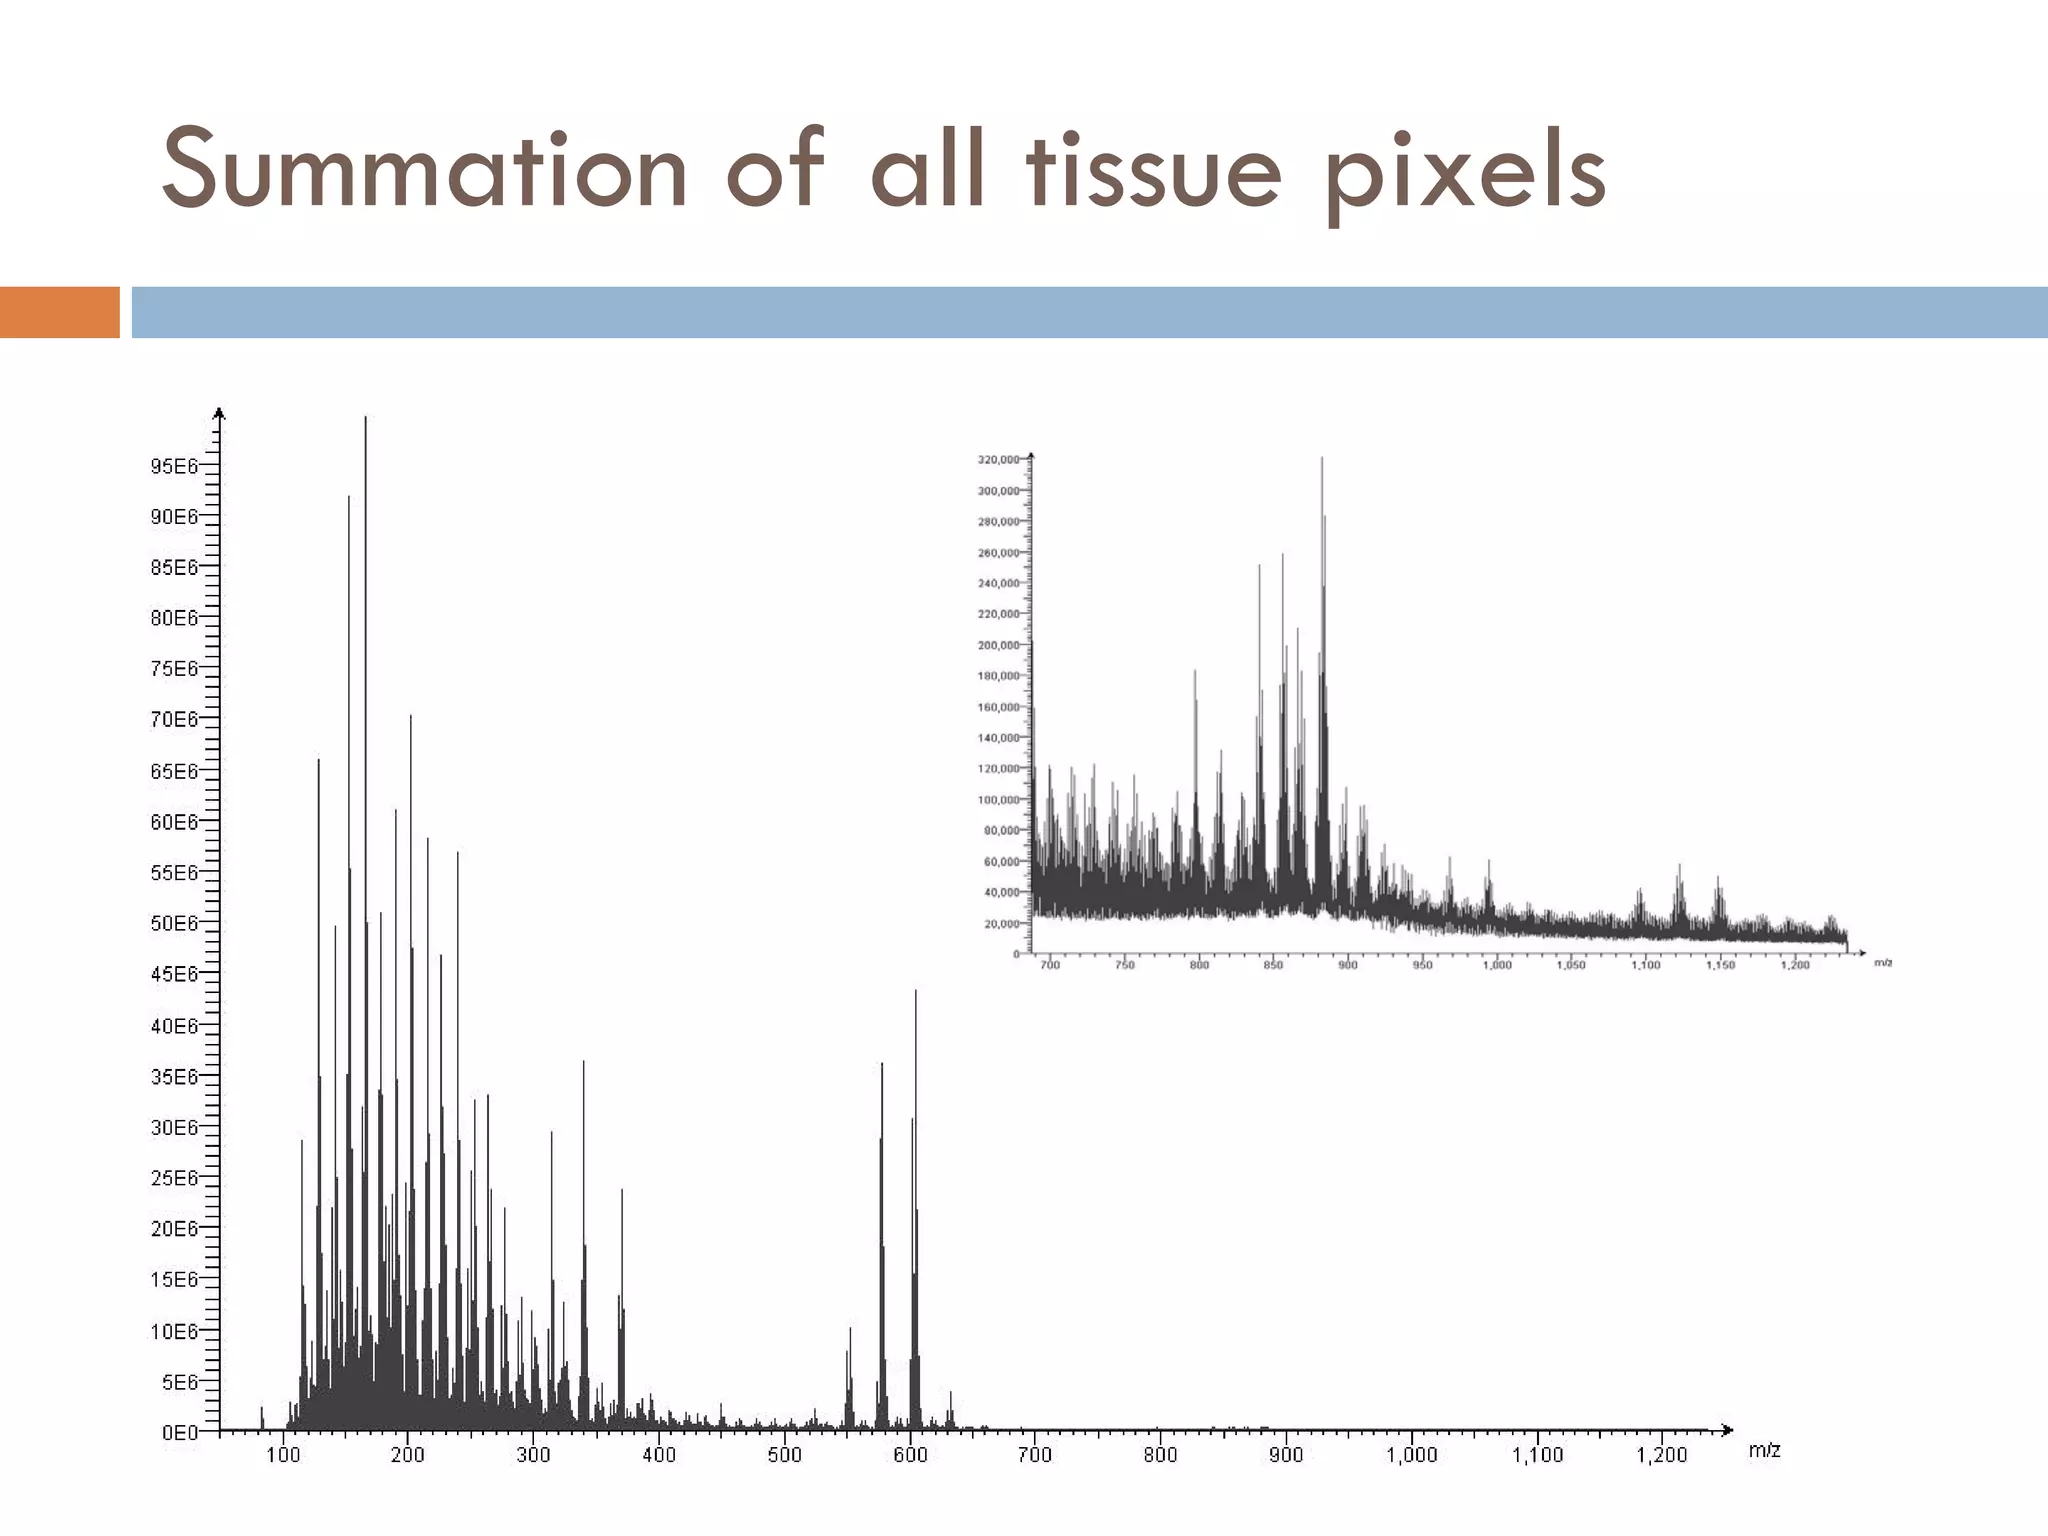
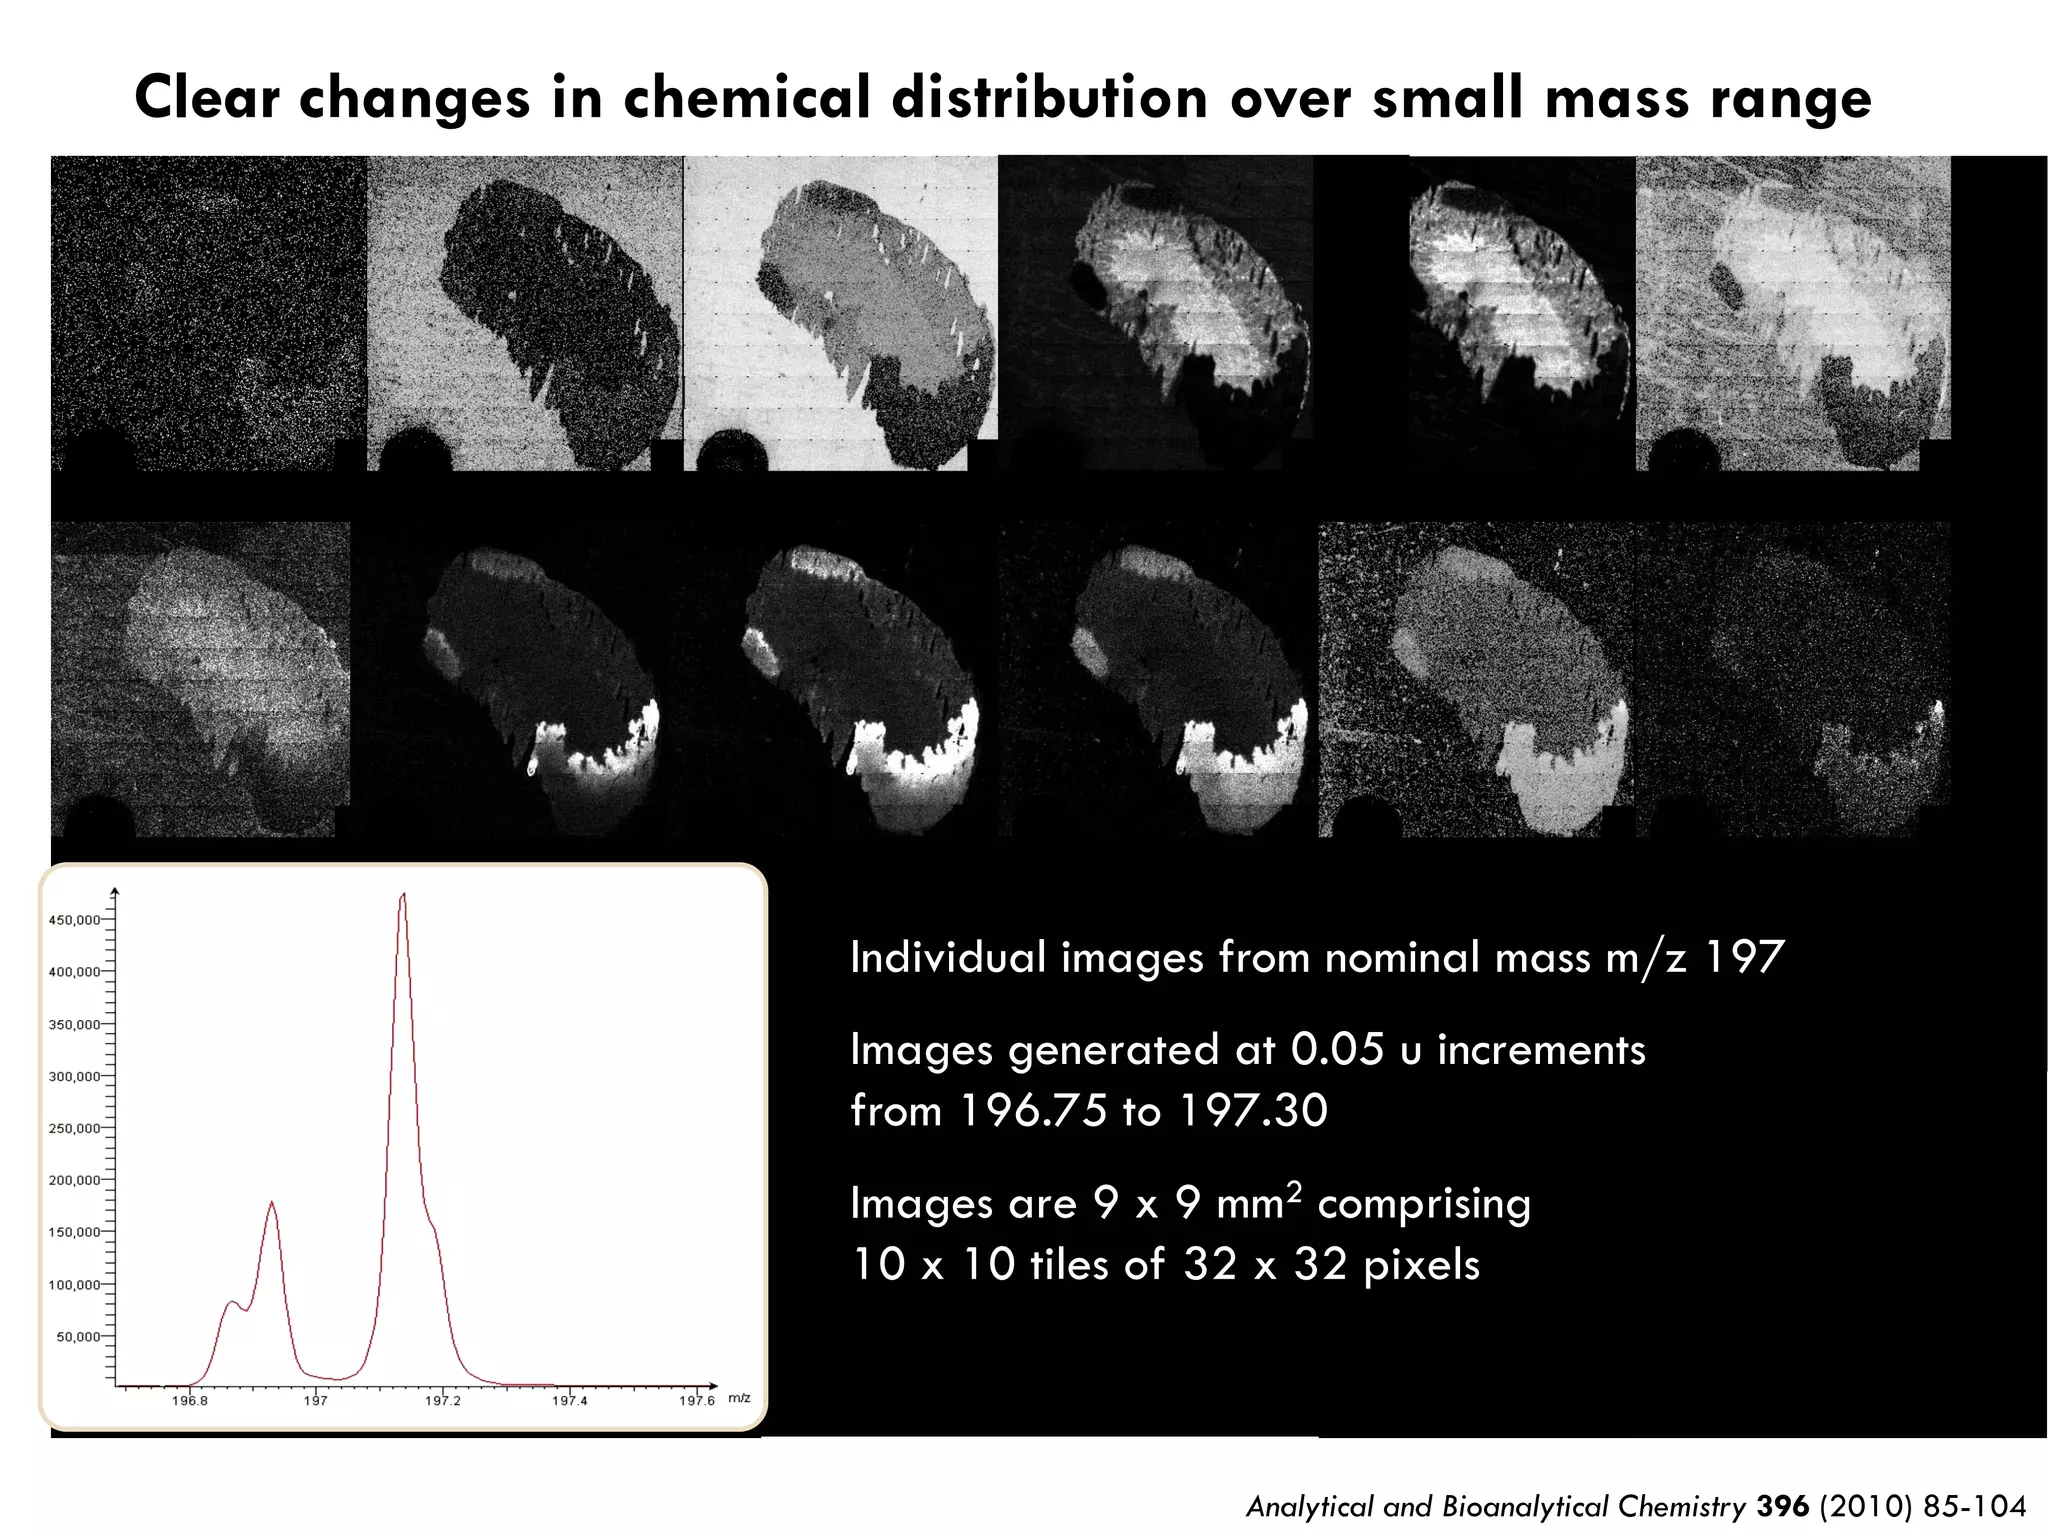
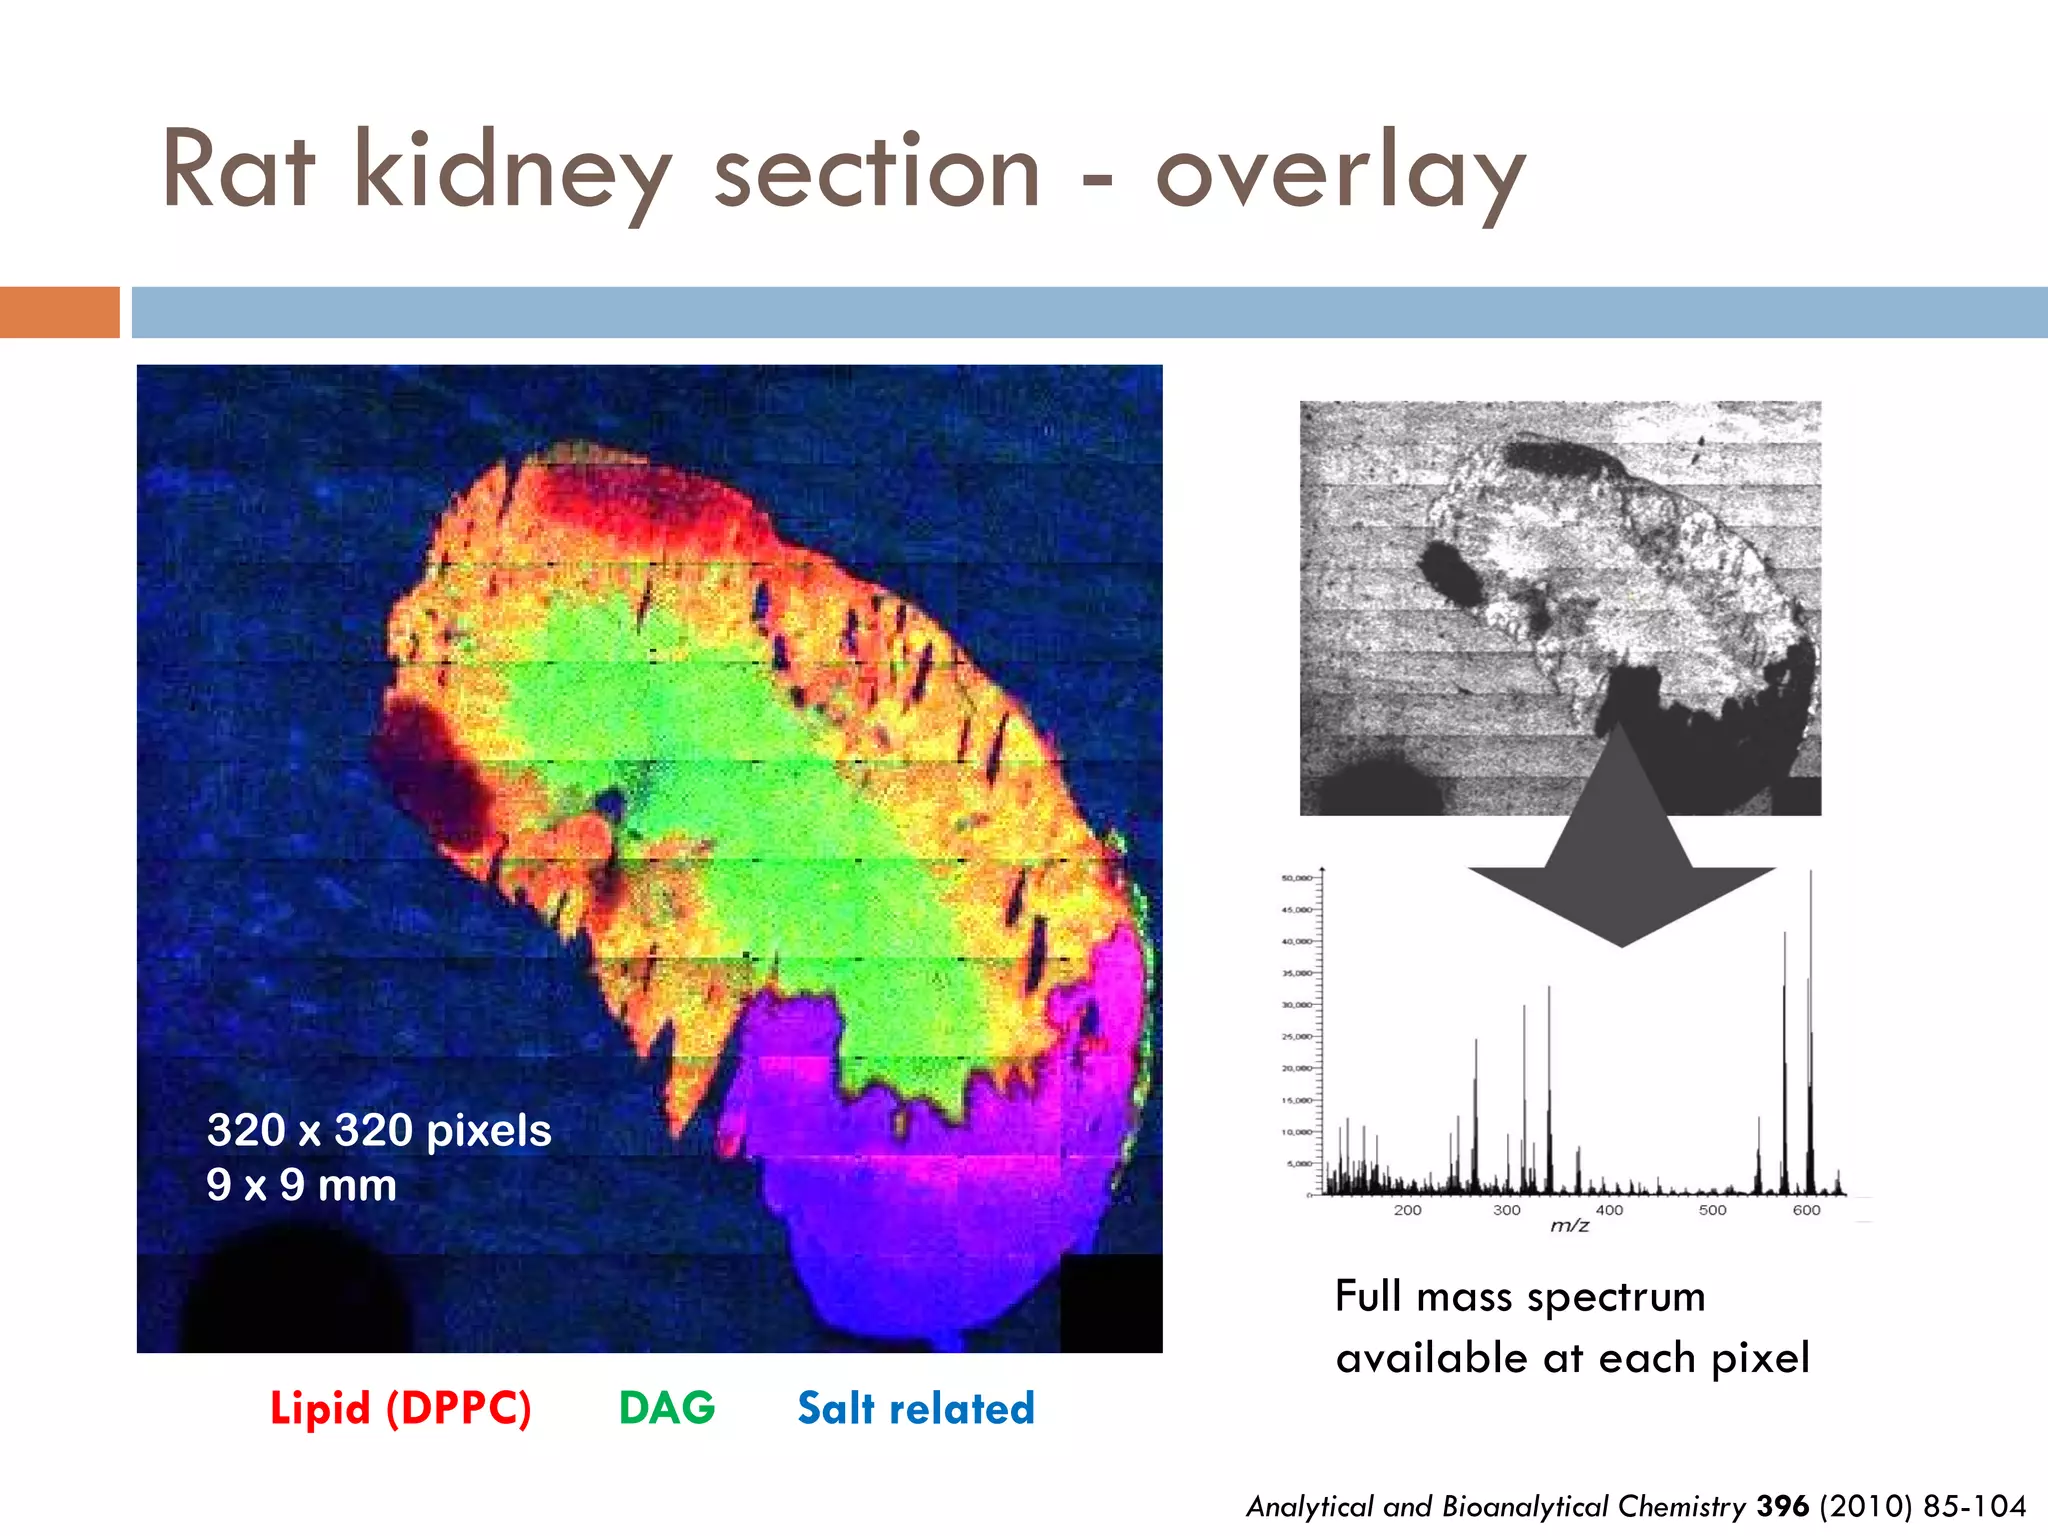
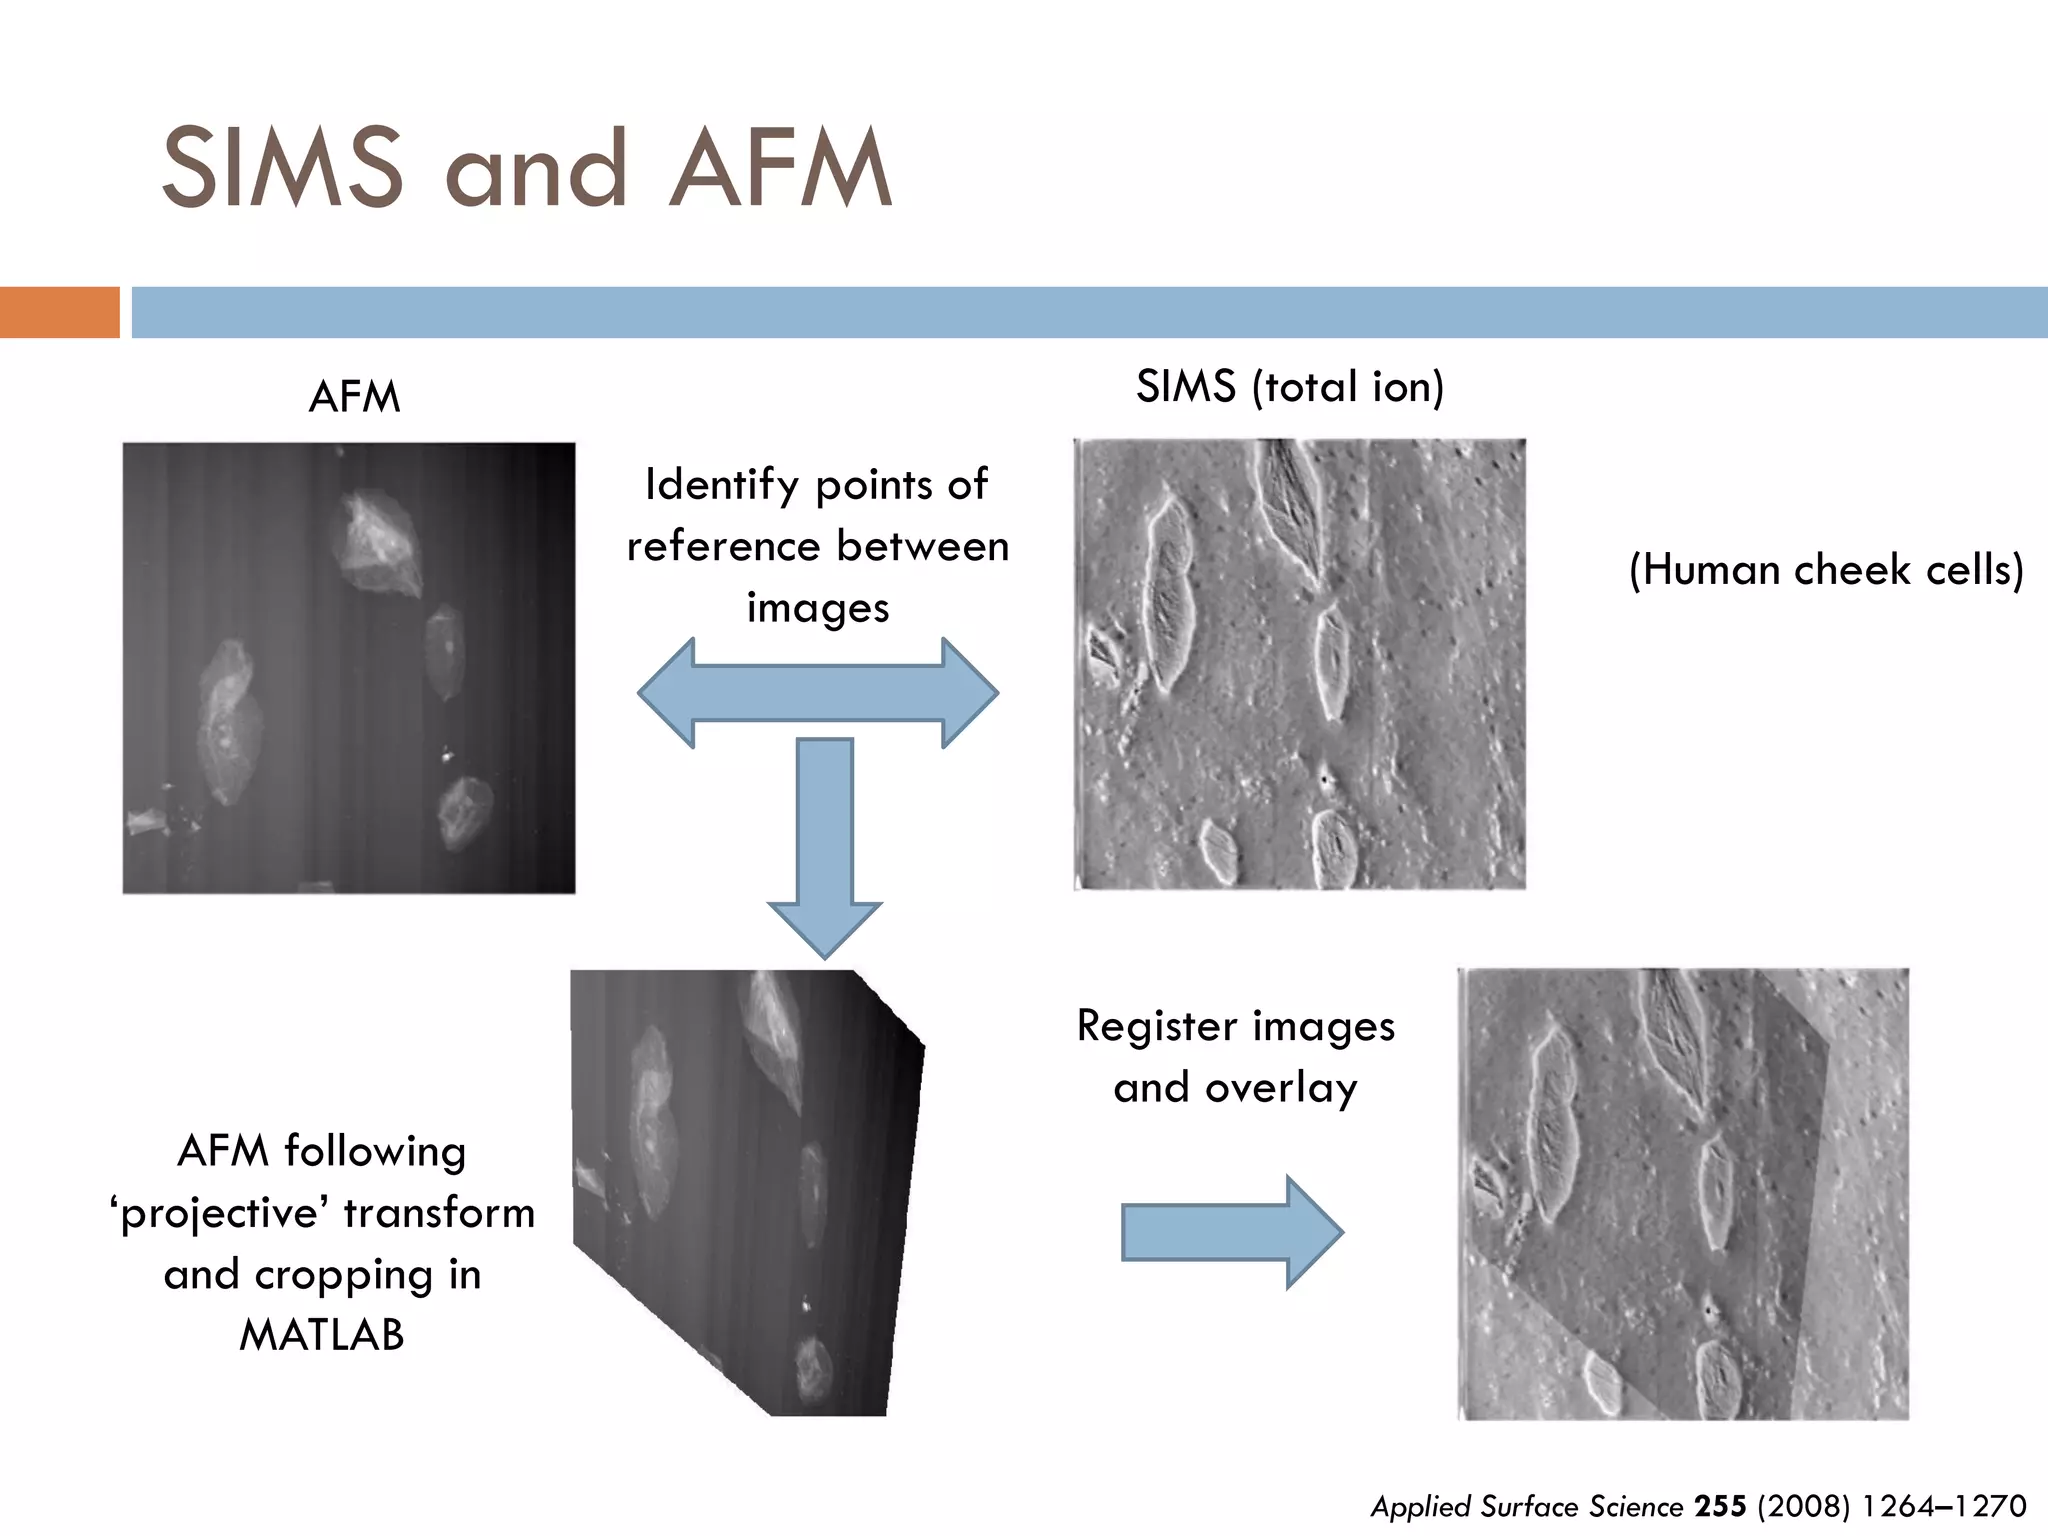


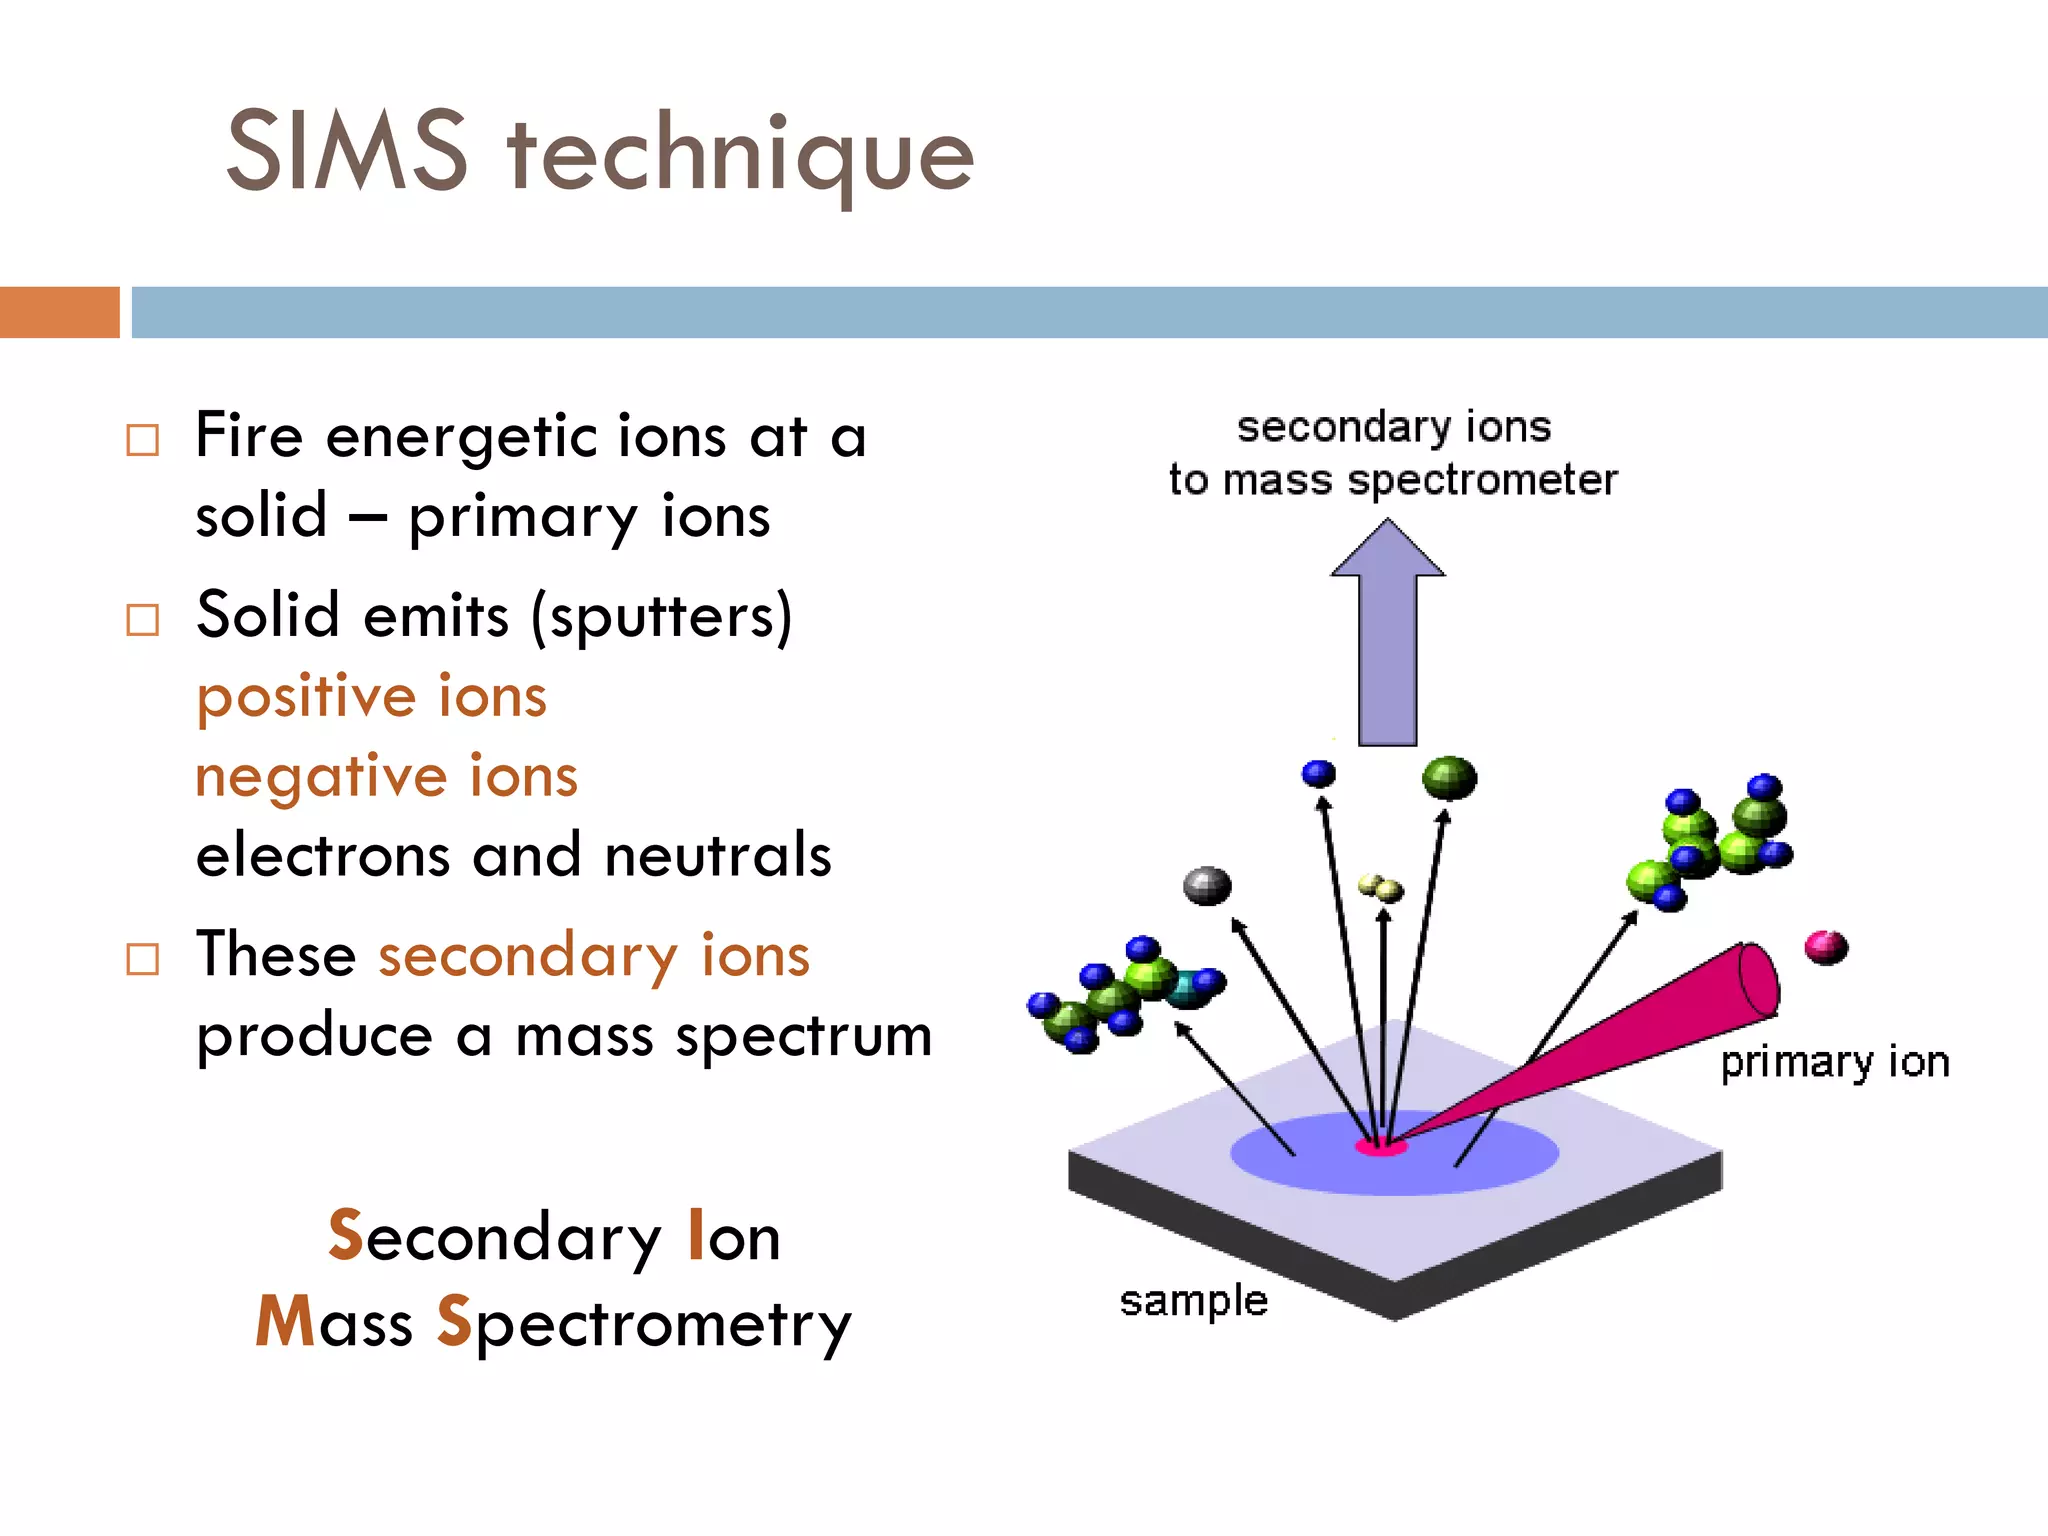
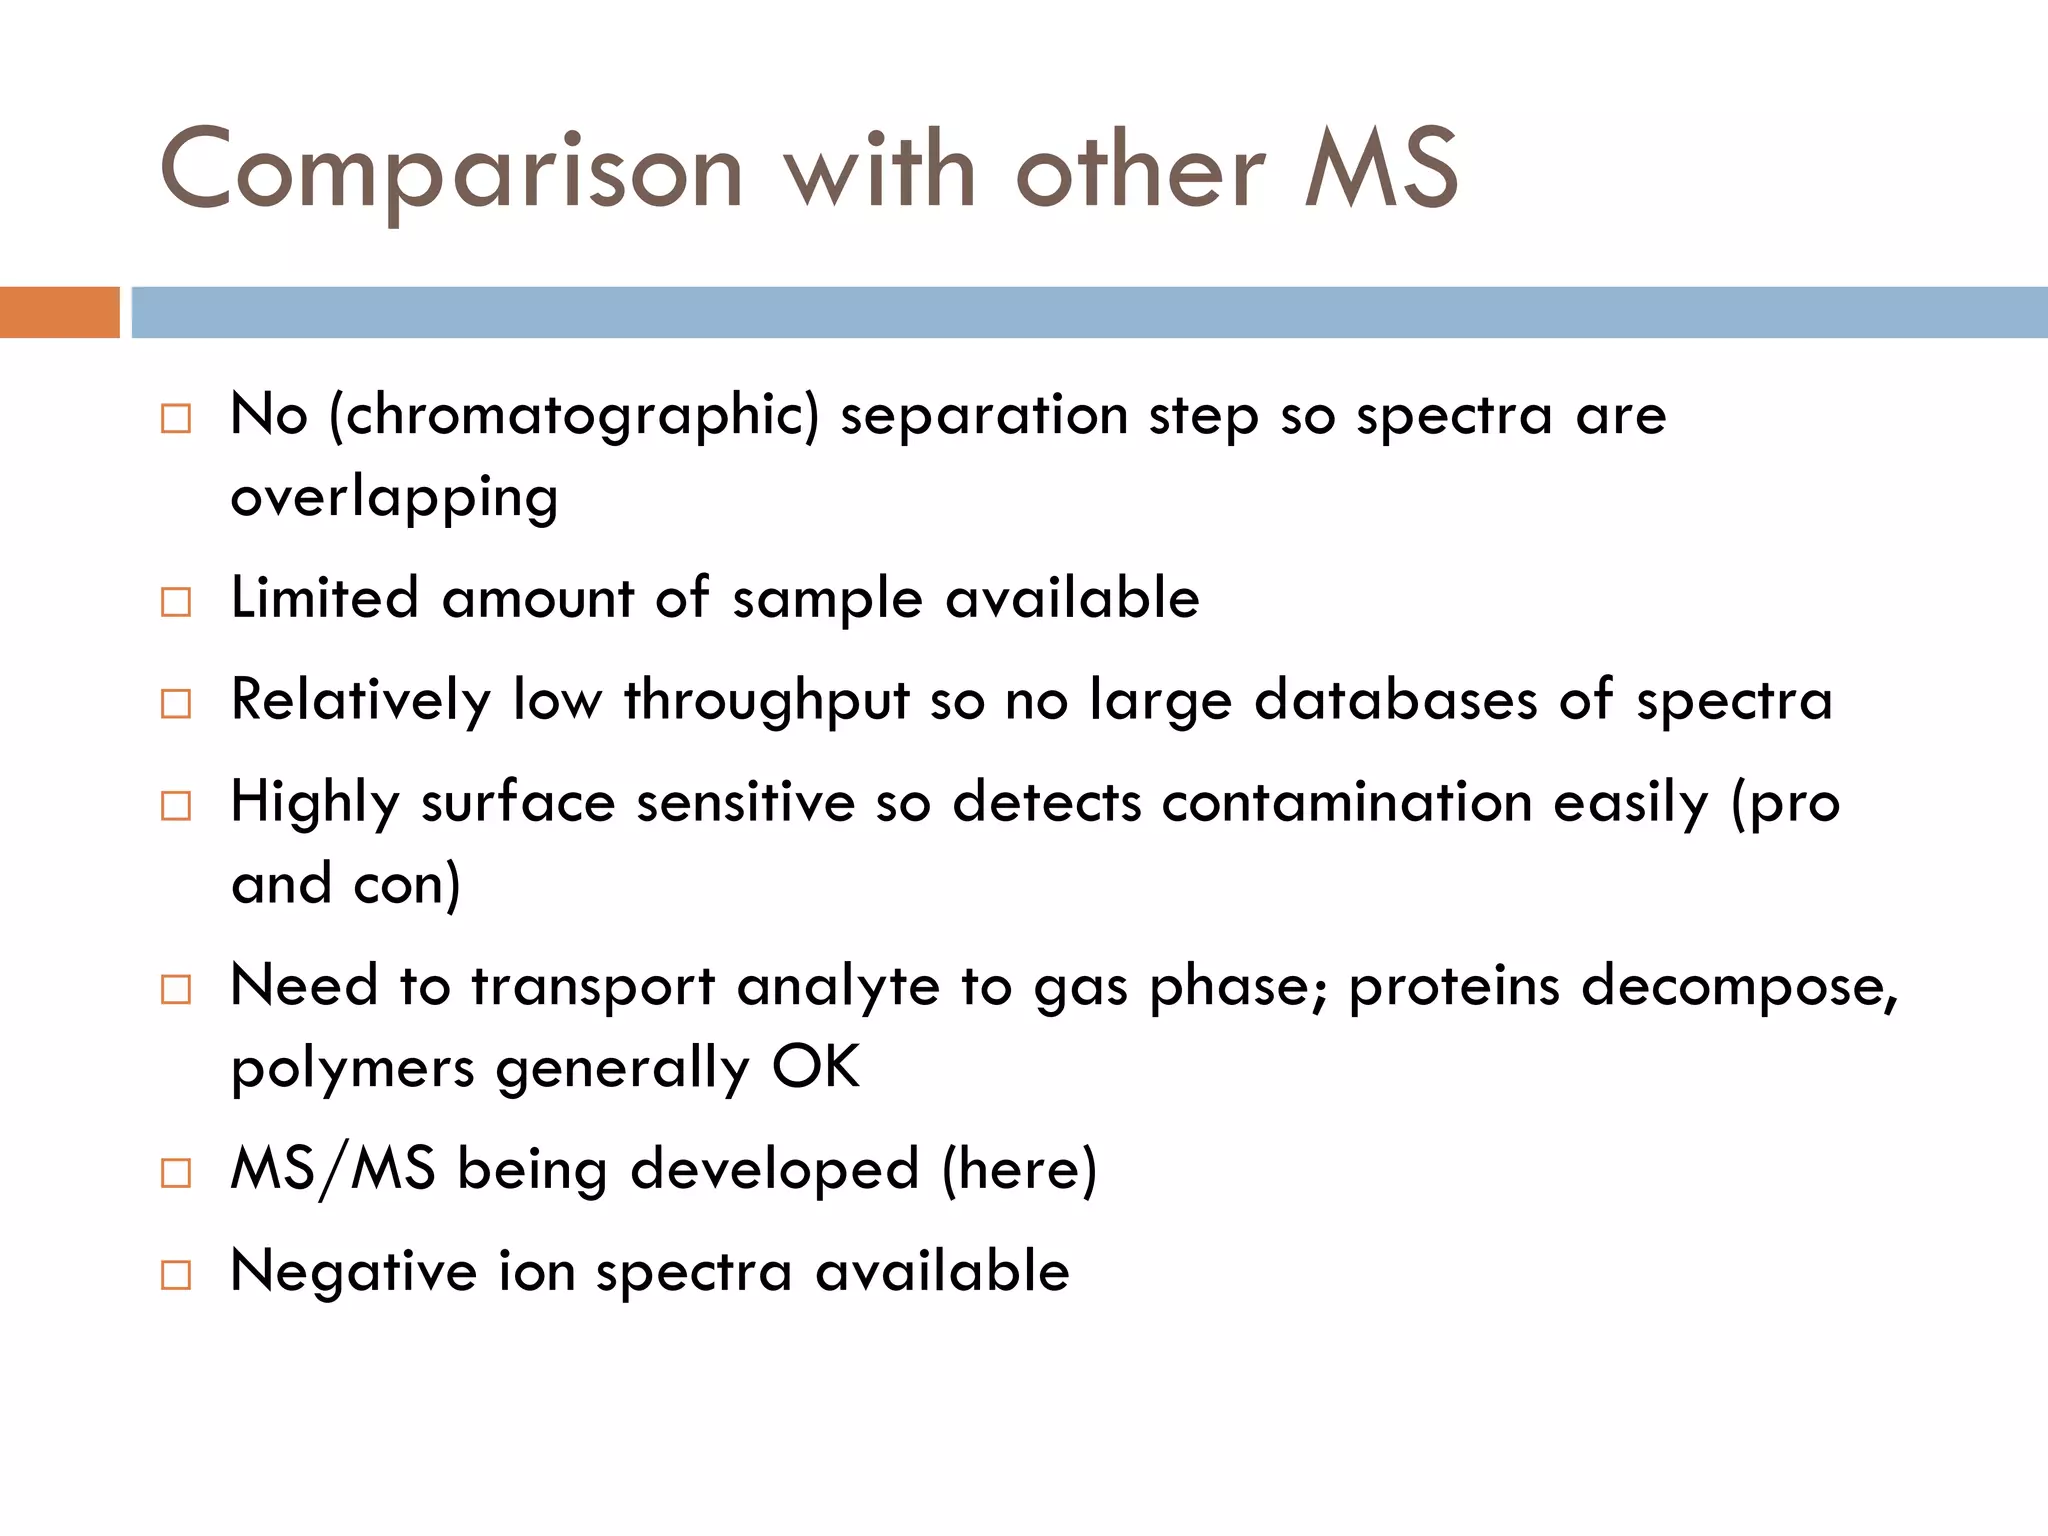
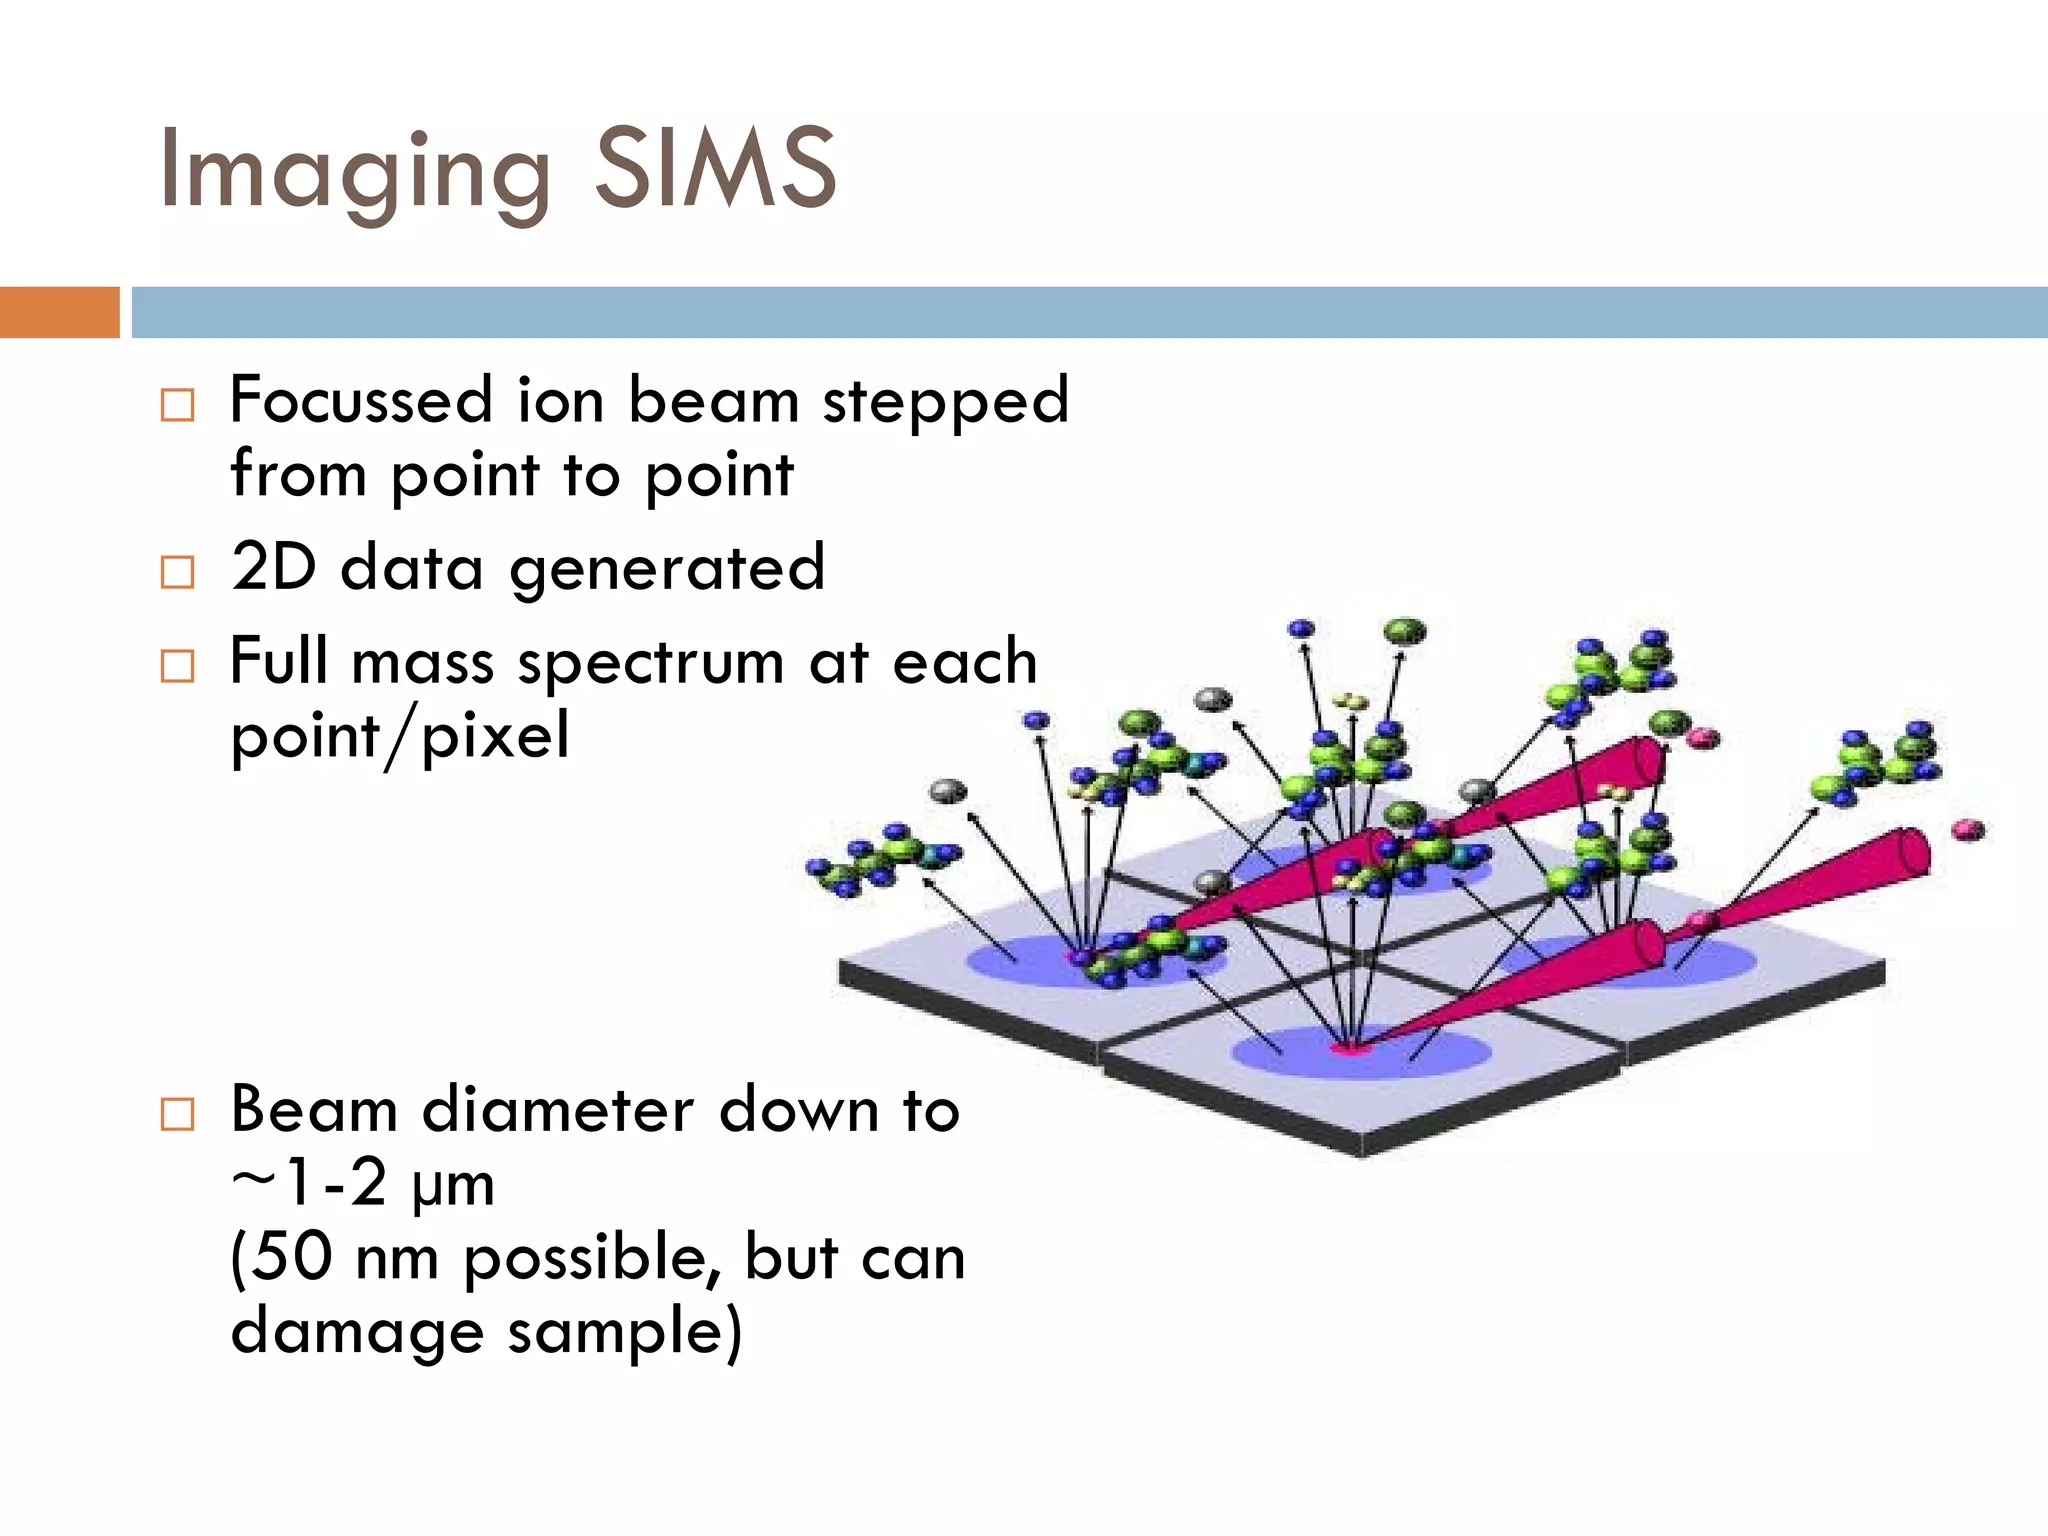
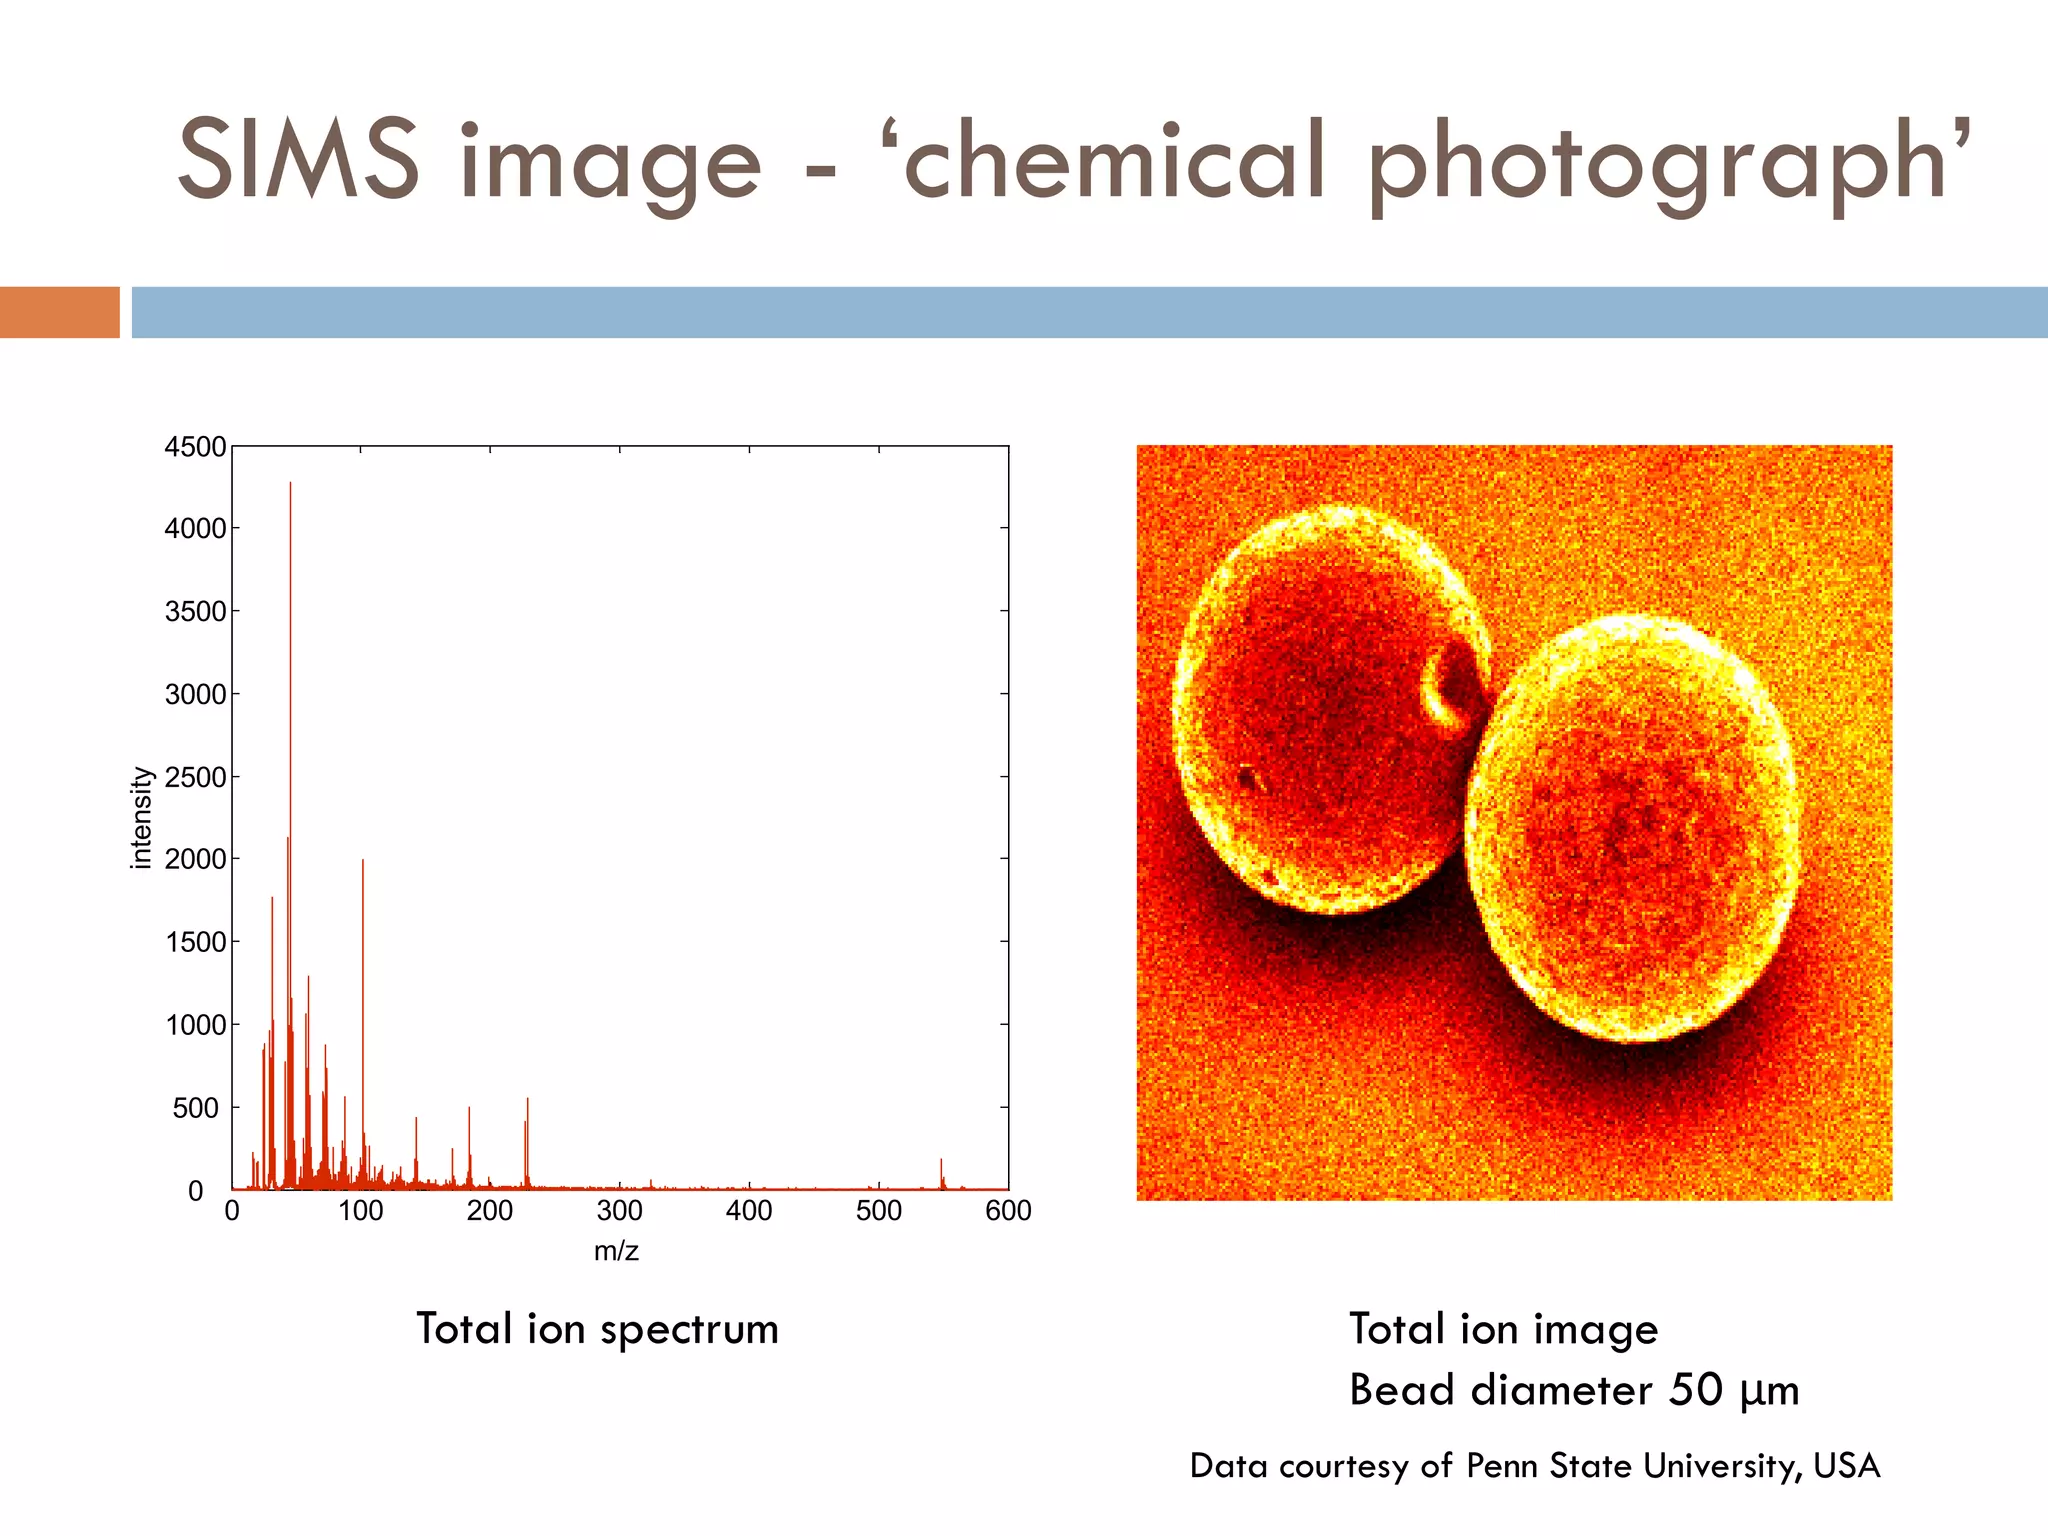
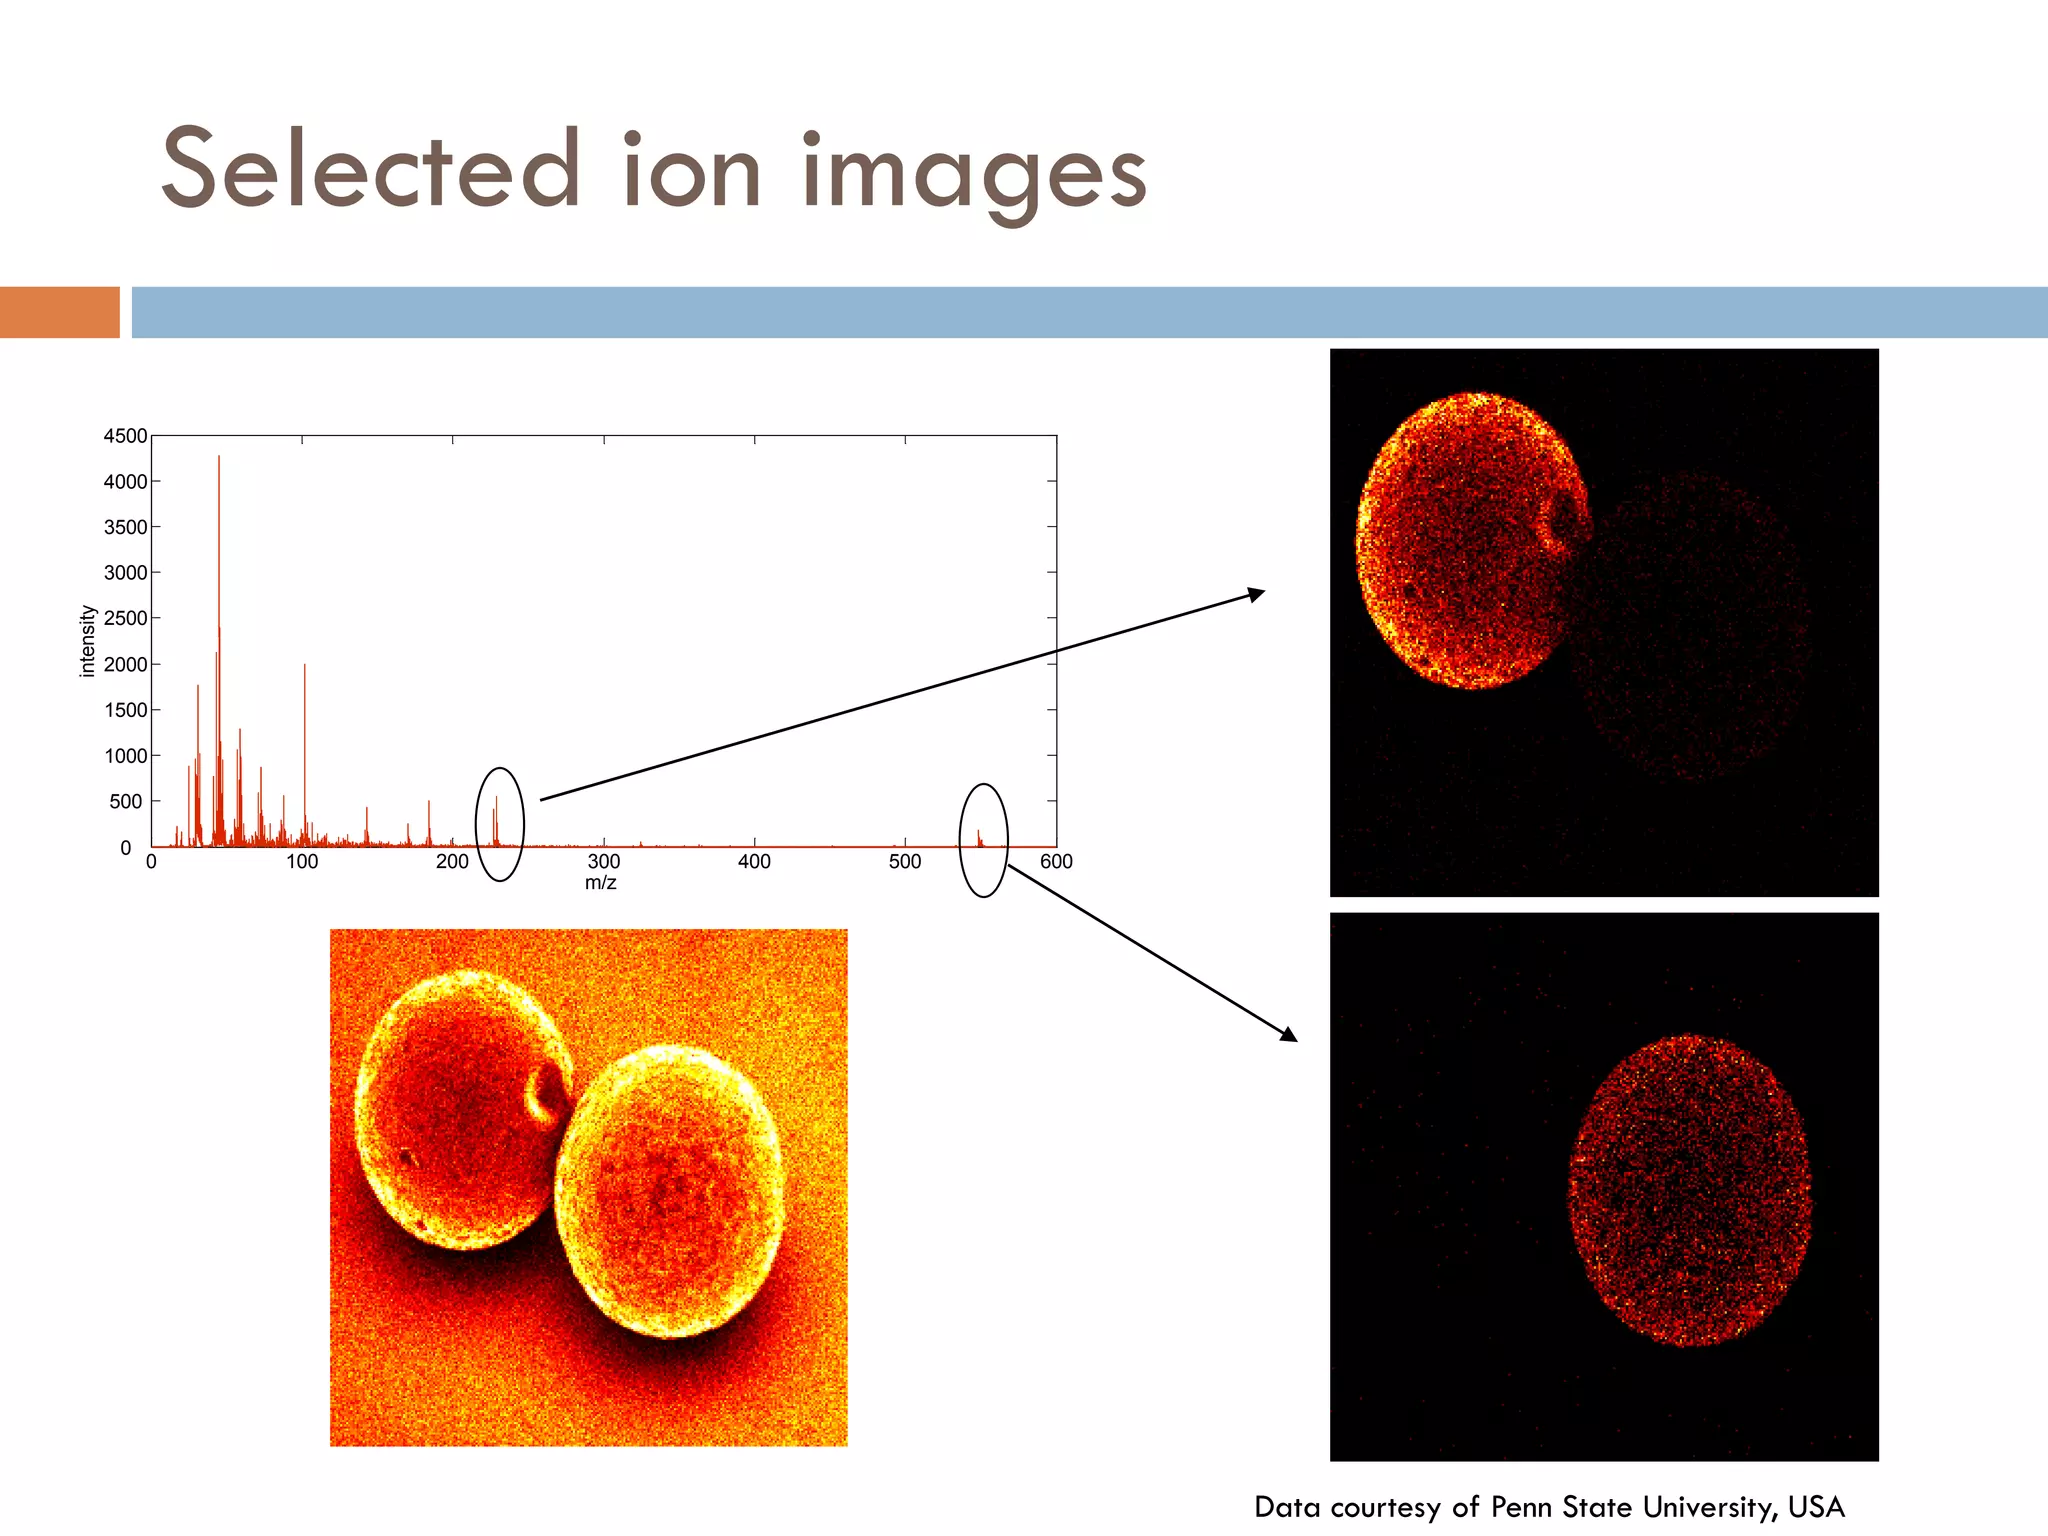
1) Secondary ion mass spectrometry (SIMS) involves firing primary ions at a solid surface, which sputters secondary ions, electrons, and neutrals that can be analyzed with a mass spectrometer. 2) SIMS provides highly surface sensitive analysis but has limitations such as limited sample size and overlapping spectra. Multivariate analysis techniques like principal component analysis and canonical variates analysis are used to analyze SIMS data. 3) SIMS can produce 2D spatially resolved chemical images of sample surfaces by collecting full mass spectra at each pixel. Techniques like maximum autocorrelation factor analysis incorporate spatial information with spectral data for more detailed analysis of SIMS images.


![Thin_Film_Technology_introduction[1]](https://cdn.slidesharecdn.com/ss_thumbnails/1b4496c8-2102-411b-8465-a3dd3f398327-150205034538-conversion-gate02-thumbnail.jpg?width=640&height=640&fit=bounds)