Download to read offline


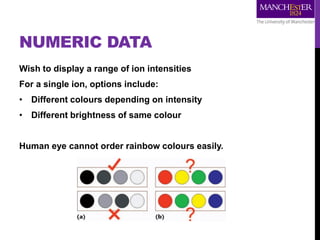
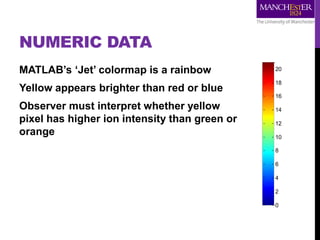
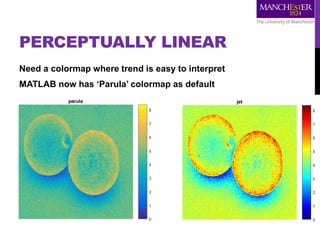
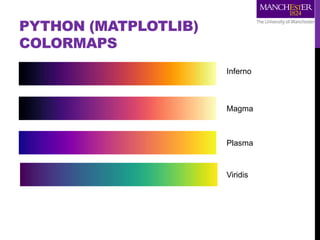
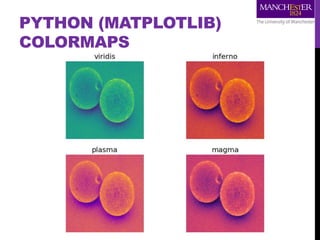


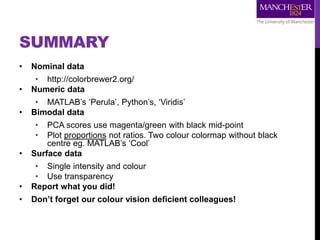


The document discusses various methods for data visualization and analysis in 3D, emphasizing the importance of color representation to accurately convey information. It covers different types of data (nominal, numeric, bimodal) and suggests appropriate colormaps to address issues like color vision deficiency. The document also provides guidance on surface data handling and highlights the necessity of transparent rendering and thorough reporting for reproducibility.