Download as PDF, PPTX

![High mass resolution required
Nominally all at m/z 86
Lipid (DPPC)
m/z = 86.0969692
Unknown
Silicon substrate [Si3H2]+
m/z = 85.9464332
Separation = 0.15 u
m/z 86
Analytical chemistry 80 (2008) 9058-9064](https://image.slidesharecdn.com/interpretationofstaticsimsspectra-120607120711-phpapp02/85/Interpretation-of-Static-SIMS-Spectra-9-320.jpg)
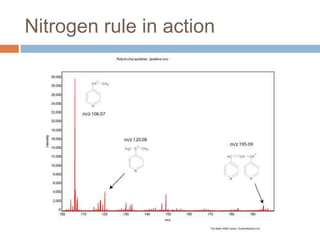

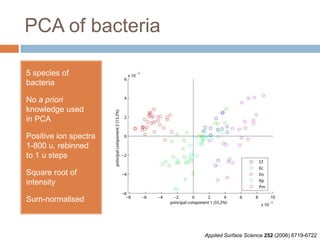
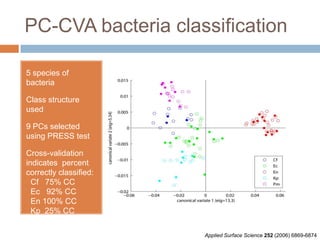
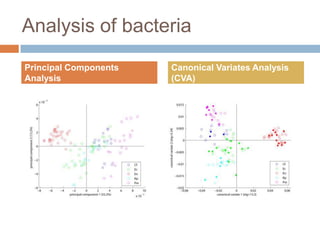
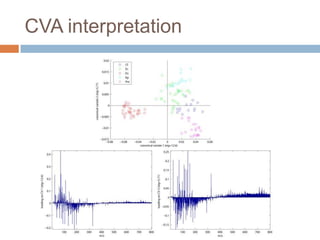
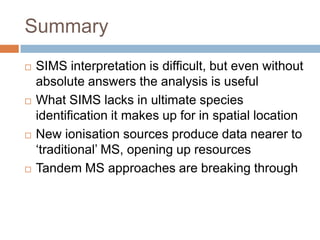

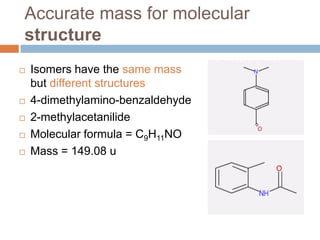
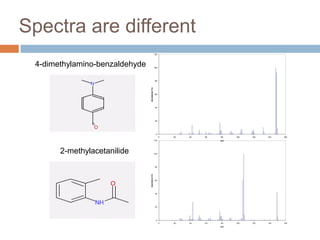
The document discusses the interpretation of static SIMS spectra and the complexities of mass spectrometry in identifying chemical samples. It emphasizes the importance of accurate mass in determining molecular structure and formula, while also addressing challenges arising from isomer overlap and chemical mixtures. Furthermore, it highlights various factors affecting mass spectrometry results, such as sample stability, fragmentation behaviors, and the utility of multivariate analysis for spectral data interpretation.


![[解説スライド] NeRF: Representing Scenes as Neural Radiance Fields for View Synthesis](https://cdn.slidesharecdn.com/ss_thumbnails/nerf20200327slideshare-200326131430-thumbnail.jpg?width=640&height=640&fit=bounds)


