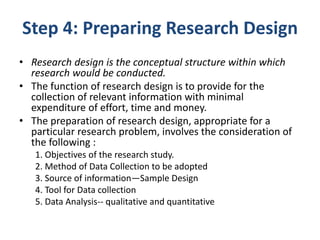
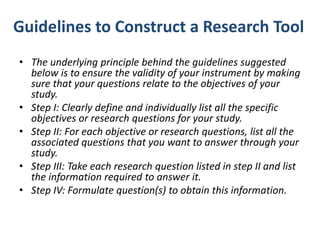
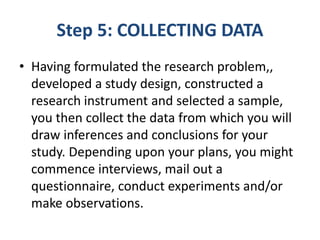
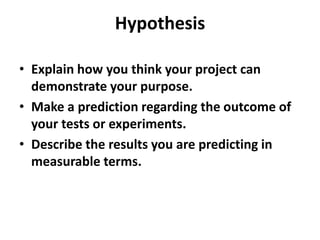
This document outlines the steps of the scientific research method and experimental design process. It discusses:
1. Defining the research question and formulating a hypothesis.
2. Designing an experiment to test the hypothesis, including identifying variables, controls, and repeated trials.
3. Collecting and analyzing data from experiments to interpret results and determine if they prove or disprove the original hypothesis.
4. Publishing findings so other scientists can review and potentially replicate the research.
The key steps are formulating a research problem and hypothesis, designing a controlled experiment to test the hypothesis through measurable data collection and analysis, and communicating results. The overall goal is to advance scientific understanding through this systematic process.
How to write a thesis - Guidelines to Thesis WritingTechsparks
A thesis is an important part of the academics of the master's students. Without the submission of the thesis, a degree is not conferred to a student. Follow the slides to know the procedure of thesis writing.
http://www.techsparks.co.in
Research process involves a systematic way that focuses on being objective and gathering a multitude of information for analysis so that the researcher can come to a conclusion. Basic steps that should be considered and research process definition pdf and marketing research process 5 steps
Tutorial for beginning graduate students. Some guidelines for composing the research proposal for an MS project. Also presents the perspective of advisor and committee.
Steps in Research Process:
1. Formulating the Research Problem
2. Extensive Literature Review
3. Developing the objectives
4. Preparing the Research Design including Sample Design
5. Collecting the Data
6. Analysis of Data
7. Generalization and Interpretation
8. Preparation of the Report or Presentation of Results-Formal write ups of conclusions reached.
RESEARCH DESIGN , Sampling Designs , Dependent and Independent Variables, Extraneous Variables, Hypothesis, Exploratory Research Design, Descriptive and Diagnostic Research
Business Research Method - Unit II, AKTU, Lucknow SyllabusKartikeya Singh
Business Research Methods, Unit II, AKTU, Lucknow Syllabus.
Research Methodology, Topics Covered - Research design: Concept, Features of a good research design, Use of a good research design; Qualitative and Quantitative research approaches, Comparison – Pros and Cons of both approaches.
Exploratory Research Design: Concept, Types: Qualitative techniques – Projective Techniques, Depth Interview, Experience Survey, Focus Groups, Observation.
Descriptive Research Designs: Concept, types and uses. Concept of Cross-sectional and Longitudinal Research
Experimental Design: Concept of Cause, Causal relationships, Concept of Independent & Dependent variables, concomitant variable, extraneous variable, Treatment, Control group.
Research is a process through which new knowledge is discovered. Conducting research has to follow certain steps and these may vary with the type and goals of research. But the variation in the process would be minor according to the study involves quantitative or a qualitative approach and data.
All the concepts related to research design are covered in this PPT Presentation.Research Design being an integral and crucial part of Research majorly deals with Parametric and non-parametric test, Type 1 and type 2 error, level of significance etc.It helps in ascertaining which research technique is used in which situation.
Software measurement adalah proses pengumpulan, analisis, dan penggunaan data yang terkait dengan perangkat lunak untuk mengukur, memperbaiki, dan memantau kualitas, produktivitas, dan efektivitas pengembangan dan pemeliharaan perangkat lunak.
Studi tentang bagaimana membuat keputusan yang optimal dalam pengembangan perangkat lunak dari sudut pandang ekonomi.
Tujuan: Mencapai pengembangan perangkat lunak yang efisien dan efektif, sambil meminimalkan biaya dan risiko
13 Software Engineering Model and MethodsAinul Yaqin
Proses pemodelan sistem perangkat lunak dengan menggunakan metode formal, grafis, dan matematis untuk menggambarkan dan mengatur berbagai aspek dari sistem tersebut.
Membantu para pengembang dalam merancang dan membangun sistem perangkat lunak yang lebih baik dengan mengurangi risiko kesalahan dan meningkatkan efisiensi dan efektivitas pengembangan
Suatu proses untuk mengevaluasi dan memverifikasi software dengan tujuan untuk menemukan kesalahan atau kelemahan dalam software sehingga dapat diperbaiki dan meningkatkan kualitas software.
04 Software Design Strategies and MethodsAinul Yaqin
Desain didefinisikan sebagai proses mendefinisikan arsitektur, komponen, antarmuka, dan karakteristik lain dari sistem atau komponen" dan "hasil dari proses [itu]”
Desain software didefinisikan sebagai aktivitas siklus hidup rekayasa dan deskripsi struktur internal yang akan menjadi dasar untuk konstruksinya.
Hasil mendesain menggambarkan komponen pada tingkat detail dan antarmuka di antara komponen-komponen tersebut
Teknologi Konstruksi Software adalah sekumpulan alat, metode, dan proses yang digunakan dalam membangun software.
Teknologi ini mencakup alat dan teknik untuk mengatur, memantau, dan mengelola pembangunan software, seperti alat pengontrol versi, manajemen proyek, serta pendekatan dan metode konstruksi.
Transcript: Selling digital books in 2024: Insights from industry leaders - T...BookNet Canada
The publishing industry has been selling digital audiobooks and ebooks for over a decade and has found its groove. What’s changed? What has stayed the same? Where do we go from here? Join a group of leading sales peers from across the industry for a conversation about the lessons learned since the popularization of digital books, best practices, digital book supply chain management, and more.
Link to video recording: https://bnctechforum.ca/sessions/selling-digital-books-in-2024-insights-from-industry-leaders/
Presented by BookNet Canada on May 28, 2024, with support from the Department of Canadian Heritage.
PHP Frameworks: I want to break free (IPC Berlin 2024)Ralf Eggert
In this presentation, we examine the challenges and limitations of relying too heavily on PHP frameworks in web development. We discuss the history of PHP and its frameworks to understand how this dependence has evolved. The focus will be on providing concrete tips and strategies to reduce reliance on these frameworks, based on real-world examples and practical considerations. The goal is to equip developers with the skills and knowledge to create more flexible and future-proof web applications. We'll explore the importance of maintaining autonomy in a rapidly changing tech landscape and how to make informed decisions in PHP development.
This talk is aimed at encouraging a more independent approach to using PHP frameworks, moving towards a more flexible and future-proof approach to PHP development.
Let's dive deeper into the world of ODC! Ricardo Alves (OutSystems) will join us to tell all about the new Data Fabric. After that, Sezen de Bruijn (OutSystems) will get into the details on how to best design a sturdy architecture within ODC.
Connector Corner: Automate dynamic content and events by pushing a buttonDianaGray10
Here is something new! In our next Connector Corner webinar, we will demonstrate how you can use a single workflow to:
Create a campaign using Mailchimp with merge tags/fields
Send an interactive Slack channel message (using buttons)
Have the message received by managers and peers along with a test email for review
But there’s more:
In a second workflow supporting the same use case, you’ll see:
Your campaign sent to target colleagues for approval
If the “Approve” button is clicked, a Jira/Zendesk ticket is created for the marketing design team
But—if the “Reject” button is pushed, colleagues will be alerted via Slack message
Join us to learn more about this new, human-in-the-loop capability, brought to you by Integration Service connectors.
And...
Speakers:
Akshay Agnihotri, Product Manager
Charlie Greenberg, Host
Builder.ai Founder Sachin Dev Duggal's Strategic Approach to Create an Innova...Ramesh Iyer
In today's fast-changing business world, Companies that adapt and embrace new ideas often need help to keep up with the competition. However, fostering a culture of innovation takes much work. It takes vision, leadership and willingness to take risks in the right proportion. Sachin Dev Duggal, co-founder of Builder.ai, has perfected the art of this balance, creating a company culture where creativity and growth are nurtured at each stage.
Essentials of Automations: Optimizing FME Workflows with ParametersSafe Software
Are you looking to streamline your workflows and boost your projects’ efficiency? Do you find yourself searching for ways to add flexibility and control over your FME workflows? If so, you’re in the right place.
Join us for an insightful dive into the world of FME parameters, a critical element in optimizing workflow efficiency. This webinar marks the beginning of our three-part “Essentials of Automation” series. This first webinar is designed to equip you with the knowledge and skills to utilize parameters effectively: enhancing the flexibility, maintainability, and user control of your FME projects.
Here’s what you’ll gain:
- Essentials of FME Parameters: Understand the pivotal role of parameters, including Reader/Writer, Transformer, User, and FME Flow categories. Discover how they are the key to unlocking automation and optimization within your workflows.
- Practical Applications in FME Form: Delve into key user parameter types including choice, connections, and file URLs. Allow users to control how a workflow runs, making your workflows more reusable. Learn to import values and deliver the best user experience for your workflows while enhancing accuracy.
- Optimization Strategies in FME Flow: Explore the creation and strategic deployment of parameters in FME Flow, including the use of deployment and geometry parameters, to maximize workflow efficiency.
- Pro Tips for Success: Gain insights on parameterizing connections and leveraging new features like Conditional Visibility for clarity and simplicity.
We’ll wrap up with a glimpse into future webinars, followed by a Q&A session to address your specific questions surrounding this topic.
Don’t miss this opportunity to elevate your FME expertise and drive your projects to new heights of efficiency.
DevOps and Testing slides at DASA ConnectKari Kakkonen
My and Rik Marselis slides at 30.5.2024 DASA Connect conference. We discuss about what is testing, then what is agile testing and finally what is Testing in DevOps. Finally we had lovely workshop with the participants trying to find out different ways to think about quality and testing in different parts of the DevOps infinity loop.
Search and Society: Reimagining Information Access for Radical FuturesBhaskar Mitra
The field of Information retrieval (IR) is currently undergoing a transformative shift, at least partly due to the emerging applications of generative AI to information access. In this talk, we will deliberate on the sociotechnical implications of generative AI for information access. We will argue that there is both a critical necessity and an exciting opportunity for the IR community to re-center our research agendas on societal needs while dismantling the artificial separation between the work on fairness, accountability, transparency, and ethics in IR and the rest of IR research. Instead of adopting a reactionary strategy of trying to mitigate potential social harms from emerging technologies, the community should aim to proactively set the research agenda for the kinds of systems we should build inspired by diverse explicitly stated sociotechnical imaginaries. The sociotechnical imaginaries that underpin the design and development of information access technologies needs to be explicitly articulated, and we need to develop theories of change in context of these diverse perspectives. Our guiding future imaginaries must be informed by other academic fields, such as democratic theory and critical theory, and should be co-developed with social science scholars, legal scholars, civil rights and social justice activists, and artists, among others.
State of ICS and IoT Cyber Threat Landscape Report 2024 previewPrayukth K V
The IoT and OT threat landscape report has been prepared by the Threat Research Team at Sectrio using data from Sectrio, cyber threat intelligence farming facilities spread across over 85 cities around the world. In addition, Sectrio also runs AI-based advanced threat and payload engagement facilities that serve as sinks to attract and engage sophisticated threat actors, and newer malware including new variants and latent threats that are at an earlier stage of development.
The latest edition of the OT/ICS and IoT security Threat Landscape Report 2024 also covers:
State of global ICS asset and network exposure
Sectoral targets and attacks as well as the cost of ransom
Global APT activity, AI usage, actor and tactic profiles, and implications
Rise in volumes of AI-powered cyberattacks
Major cyber events in 2024
Malware and malicious payload trends
Cyberattack types and targets
Vulnerability exploit attempts on CVEs
Attacks on counties – USA
Expansion of bot farms – how, where, and why
In-depth analysis of the cyber threat landscape across North America, South America, Europe, APAC, and the Middle East
Why are attacks on smart factories rising?
Cyber risk predictions
Axis of attacks – Europe
Systemic attacks in the Middle East
Download the full report from here:
https://sectrio.com/resources/ot-threat-landscape-reports/sectrio-releases-ot-ics-and-iot-security-threat-landscape-report-2024/
2. • Research question / Problem
• Background / Observation
• Formulate hypothesis
• Design experiment
• Test hypothesis / Collect data
• Interpret / Analyze results
• Publish findings
1
2
3
4
5
6
7
What are you interested in?
What do you have to know about it?
Make observations & gather background
information about the problem
An educated guess …
It shall be possible to measure / test it.
It should help answer the original question
How will you test your hypothesis?
What tests will answer your question?
Test your hypothesis by executing your
experiments. Collect data from them
What do your results tell you?
Do they prove or disprove the hypothesis.
It is OK to be wrong
Write papers for conferences & journals.
Write thesis
Scientific Research Steps
3. Step 4: Preparing Research Design
• Research design is the conceptual structure within which
research would be conducted.
• The function of research design is to provide for the
collection of relevant information with minimal
expenditure of effort, time and money.
• The preparation of research design, appropriate for a
particular research problem, involves the consideration of
the following :
1. Objectives of the research study.
2. Method of Data Collection to be adopted
3. Source of information—Sample Design
4. Tool for Data collection
5. Data Analysis-- qualitative and quantitative
4. EXPERIMENTAL METHOD
• Also called Empirical Research or Cause and
Effect Method, it is a data-based research,
coming up with conclusions which are capable
of being verified with observation or
experiment.
• Experimental research is appropriate when
proof is sought that certain variables affect
other variables in some way.
5. DESIGN EXPERIMENT
• Includes planning in detail all the steps of the experimental
phase. In engineering research it often includes the design of
a prototype / system architecture.
• Identify the variables that will be manipulated and measured –
the research outcomes must be measurable.
• In other words:
– What needs to be controlled in order to get an unbiased answer
to the research question.
• Therefore: it is necessary to not only design a prototype /
system but also the thesis validation method !
• The plan should allow others to repeat it. It should be
feasible...!
6. Guidelines to Construct a Research Tool
• The underlying principle behind the guidelines suggested
below is to ensure the validity of your instrument by making
sure that your questions relate to the objectives of your
study.
• Step I: Clearly define and individually list all the specific
objectives or research questions for your study.
• Step II: For each objective or research questions, list all the
associated questions that you want to answer through your
study.
• Step III: Take each research question listed in step II and list
the information required to answer it.
• Step IV: Formulate question(s) to obtain this information.
7. Scientific Experiment
• A scientific experiment is an ordered investigation
that attempts to prove or disprove a hypothesis.
• Its primary purpose is to test whether someone's
prediction is correct.
• In designing experiments, scientists have to
answer some pretty complicated questions, like:
• Does my experiment answer the question I'm trying
to solve?
• Does it adequately test my hypothesis?
• Can I make observations about the results of my
experiment, and will I be able to analyze those
results?
• Finally, if I run this test, will it allow me to come up
with some kind of conclusion?
8. Basic rules for the design of a good
experiment (1)
• Rule #1: The experiment must show that a hypothesis
is either supported or not supported. In science, we
don't say that hypotheses are 'proven' or 'disproven'
until we're really sure about it. A single experiment is
not enough to prove anything with 100% certainty.
• Rule #2: The results of an experiment must be
measurable and objective. Scientists use standard units
to measure different properties like length, time,
volume, mass, and speed. Sometimes we need special
equipment to observe things in a measurable way. For
example, we can't see ultraviolet light or hear
infrasonic sounds. We need special devices to detect
and measure those properties for us.
9. Basic rules for the design of a good
experiment (2)
• Rule #3 for scientific investigations: The experiment
must be repeatable by other scientists. Peer reviewers
want to make sure that other scientists can run the
same experiment and get similar results. This is one of
the reasons we standardize our measuring tools and
equipment. Scientists must be able to read anyone
else's report, follow the steps exactly the same way,
and compare their findings to the original test. In
science, new ideas aren't taken seriously until many
scientists have tested them many, many times. So it's
important that scientists share their techniques and
confirm each other's findings.
10. Step 5: COLLECTING DATA
• Having formulated the research problem,,
developed a study design, constructed a
research instrument and selected a sample,
you then collect the data from which you will
draw inferences and conclusions for your
study. Depending upon your plans, you might
commence interviews, mail out a
questionnaire, conduct experiments and/or
make observations.
12. Problem/Purpose
• What is your objective?
• What idea are you trying to test?
• What is the scientific question you are trying
to answer?
13. Hypothesis
• Explain how you think your project can
demonstrate your purpose.
• Make a prediction regarding the outcome of
your tests or experiments.
• Describe the results you are predicting in
measurable terms.
14. Procedure
• Give a detailed explanation of how you will conduct the
experiment to test your hypothesis.
• Be clear about the variables (elements of the experiment that
change to test your hypothesis) versus your controls
(elements of the experiment that do not change).
• Be very specific about how you will measure results to prove
or disprove your hypothesis. You should include a regular
timetable for measuring results or observing the projects (for
example, every hour, every day, every week).
• Your procedures should be repeatable by others so that the
test could be re-done (Another person should be able to
perform your experiment following your procedure.)
15. Materials
• List all materials and/or equipment that were
used.
• Your list of materials should include all of the
ingredients of the procedure recipe.
16. Observations/Data/Results
• Keep a detailed record of observations, data,
and results. Your journal should contain data
measurements and written notes about what
you are sensing (hearing, seeing, or touching)
about the experiment.
• If applicable, photograph your project results
or phases of the project to help your analysis
and possibly to demonstrate your experiment
on your exhibit board.
17. Plan your data collection
• Know beforehand when you will collect data and
what kind of data you will collect.
• Measure this data at a set time or, in other cases,
at regular intervals.
• For experiments that measure the change in a
certain variable over time, it's necessary to collect
data at regular intervals.
• Know the difference between dependent and
independent variables. An independent variable is
the variable that you change and a dependent
variable is the one affected by the independent
variable
18. Conduct your experiment methodically
• Run your experiment, testing for your variable.
This almost always requires you to run the
experiment multiple times for multiple variable
values.
• Generally, the wider range of data you can gather,
the better. Record as much data as is feasible.
• Good experimental design incorporates what's
known as a control. One of your experimental
replications should not include the variable you're
testing for at all
19. Collect your data
• It's always a good idea to represent your data visually
if you can. Plot data points on a graph and express
trends with a line or curve of best fit. This will help
you (and anyone else who sees the graph) visualize
patterns in the data.
• For most basic experiments, the independent
variable is represented on the horizontal x axis and
the dependent variable is on the vertical y axis.
20. Analysis
• Explain your observations, data, and results.
This is a summary of what your data has
shown you.
• List the main points that you have learned.
• Why have the results occurred? What has
your experiment prove?
• Was your hypothesis correct? Has your
experiment prove or disprove your
hypothesis? This should be explained
thoroughly
21. Conclusion
• Answer your problem/purpose statement.
• What does it all add up to? What is the value
of your project?
• What further study do you recommend given
the results of your experiment? What would
be the next question to ask?
• If you repeated this project, what would you
change?
23. Independent Variable - The item being tested in the
experiment; it is intentionally changed by the
experimenter.
Dependent Variable – The item being measured in
the experiment; it is directly affected by the
independent variable.
Constant – One or more factors associated with the
experiment that do not change or are not
allowed to vary throughout the procedure.
Control – The part of the experiment that is used as
a comparison for the independent variable; it is
unchanged from its normal circumstances.
Repeated Trials – The number of specimens on
which the same experiment is performed.
25. Directions: Read the following scenario.
Then, identify the independent variable, dependent variable,
constants, control, and repeated trials.
Joe and Melissa wanted to find out what type of surface
would allow a toy car to roll the fastest. To answer their
question, they designed an experiment. They found a piece of
wood to use as a ramp to roll the toy car down. Then, they
thought of several different types of surfaces to put on the
ramp. Joe thought they should try carpet and sandpaper;
Melissa suggested they try the wood that the ramp was built
with and waxed paper. They decided to roll the car down each
of the four surfaces 10 times. They would use the collected
data to calculate an average speed for each surface. They
wanted to control the distance the car traveled, so they
marked the “start” line at the top of the ramp and made
another line for the “finish” 1½ meters away. After they set
up the equipment, they did their experiment.
26. 1. What was the independent variable in this
experiment?
2. What was the dependent variable in this
experiment?
3. List the constants that were needed in order
to perform the experiment.
4. How many repeated trials were there?
5. Was there a control to this experiment? If so
what was it?
Questions