This document discusses key concepts in sampling and statistical inference:
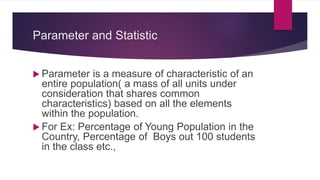
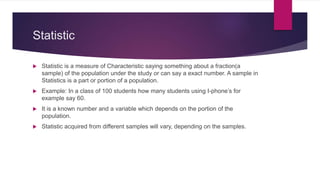
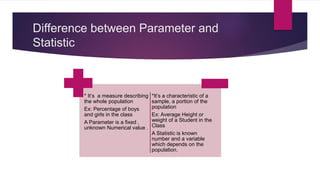
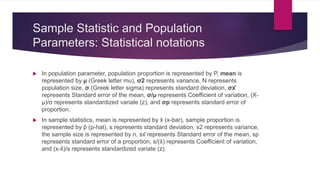
- Parameters describe characteristics of entire populations, while statistics describe characteristics of samples.
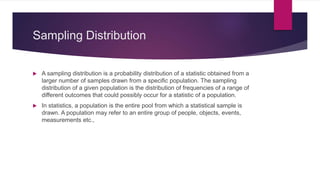
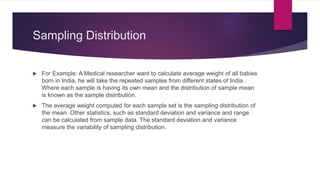
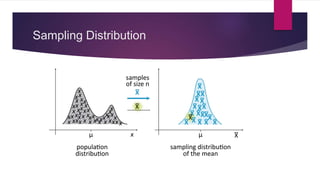
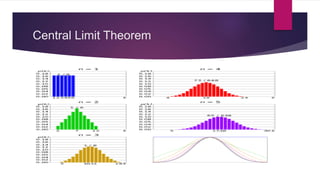
- Sampling distributions describe the distribution of sample statistics if multiple samples are drawn.
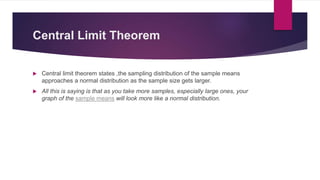
- As sample size increases, sampling distributions approach a normal distribution due to the central limit theorem.
- Statistical inference allows using sample data to make inferences about unknown population parameters.