Download as PDF, PPTX
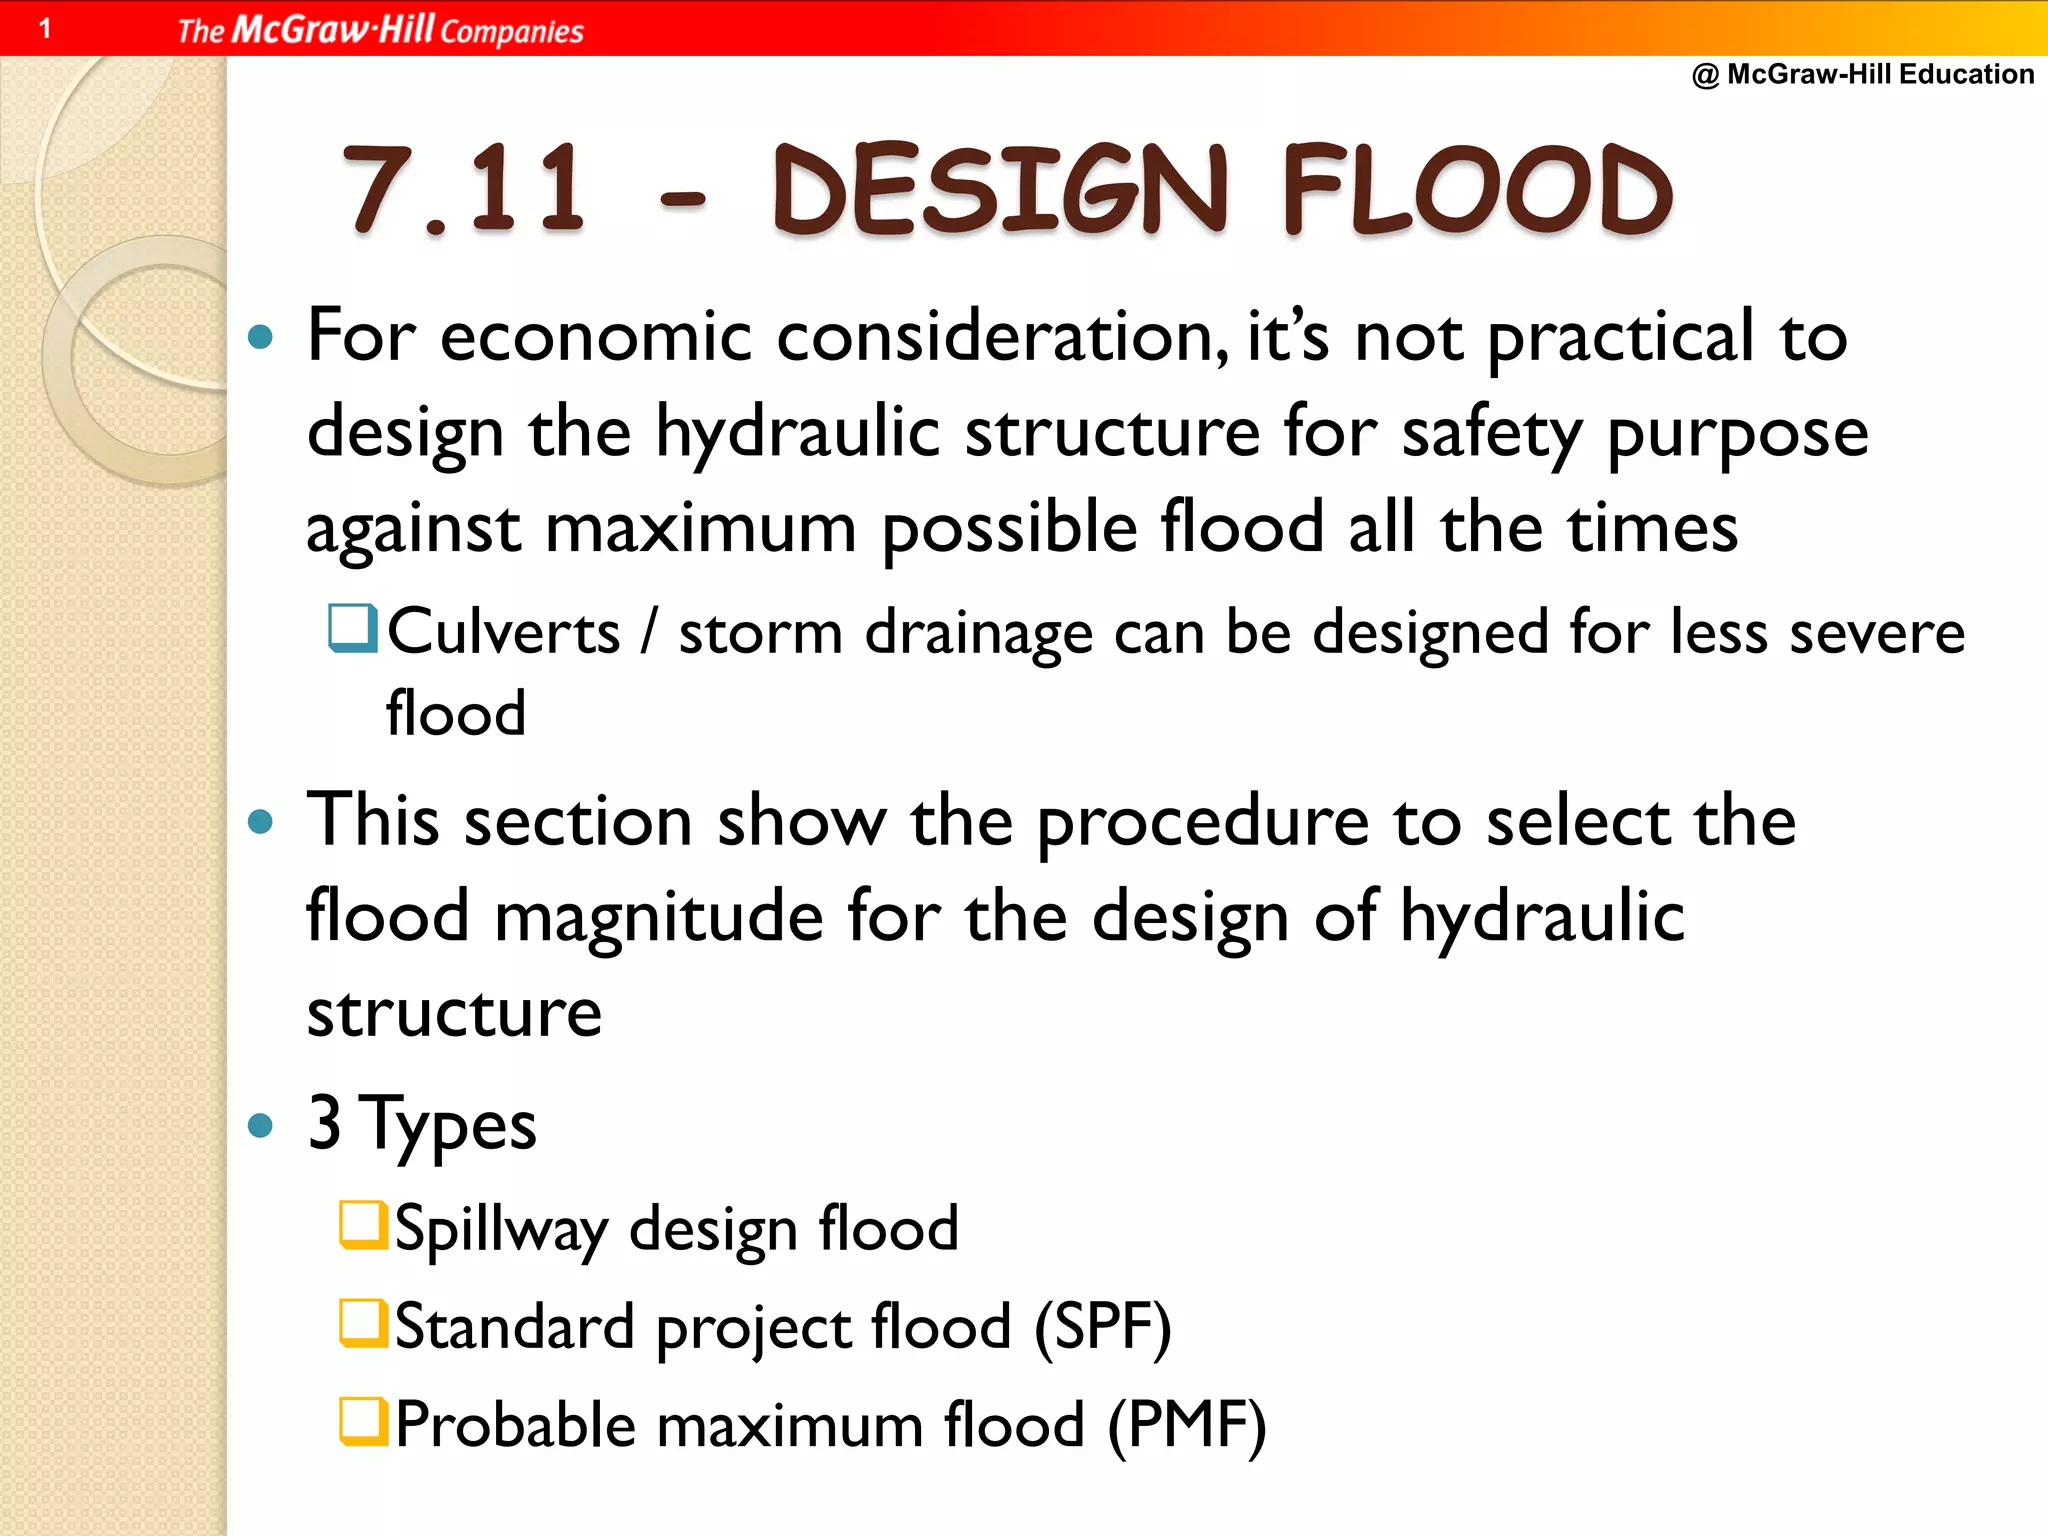
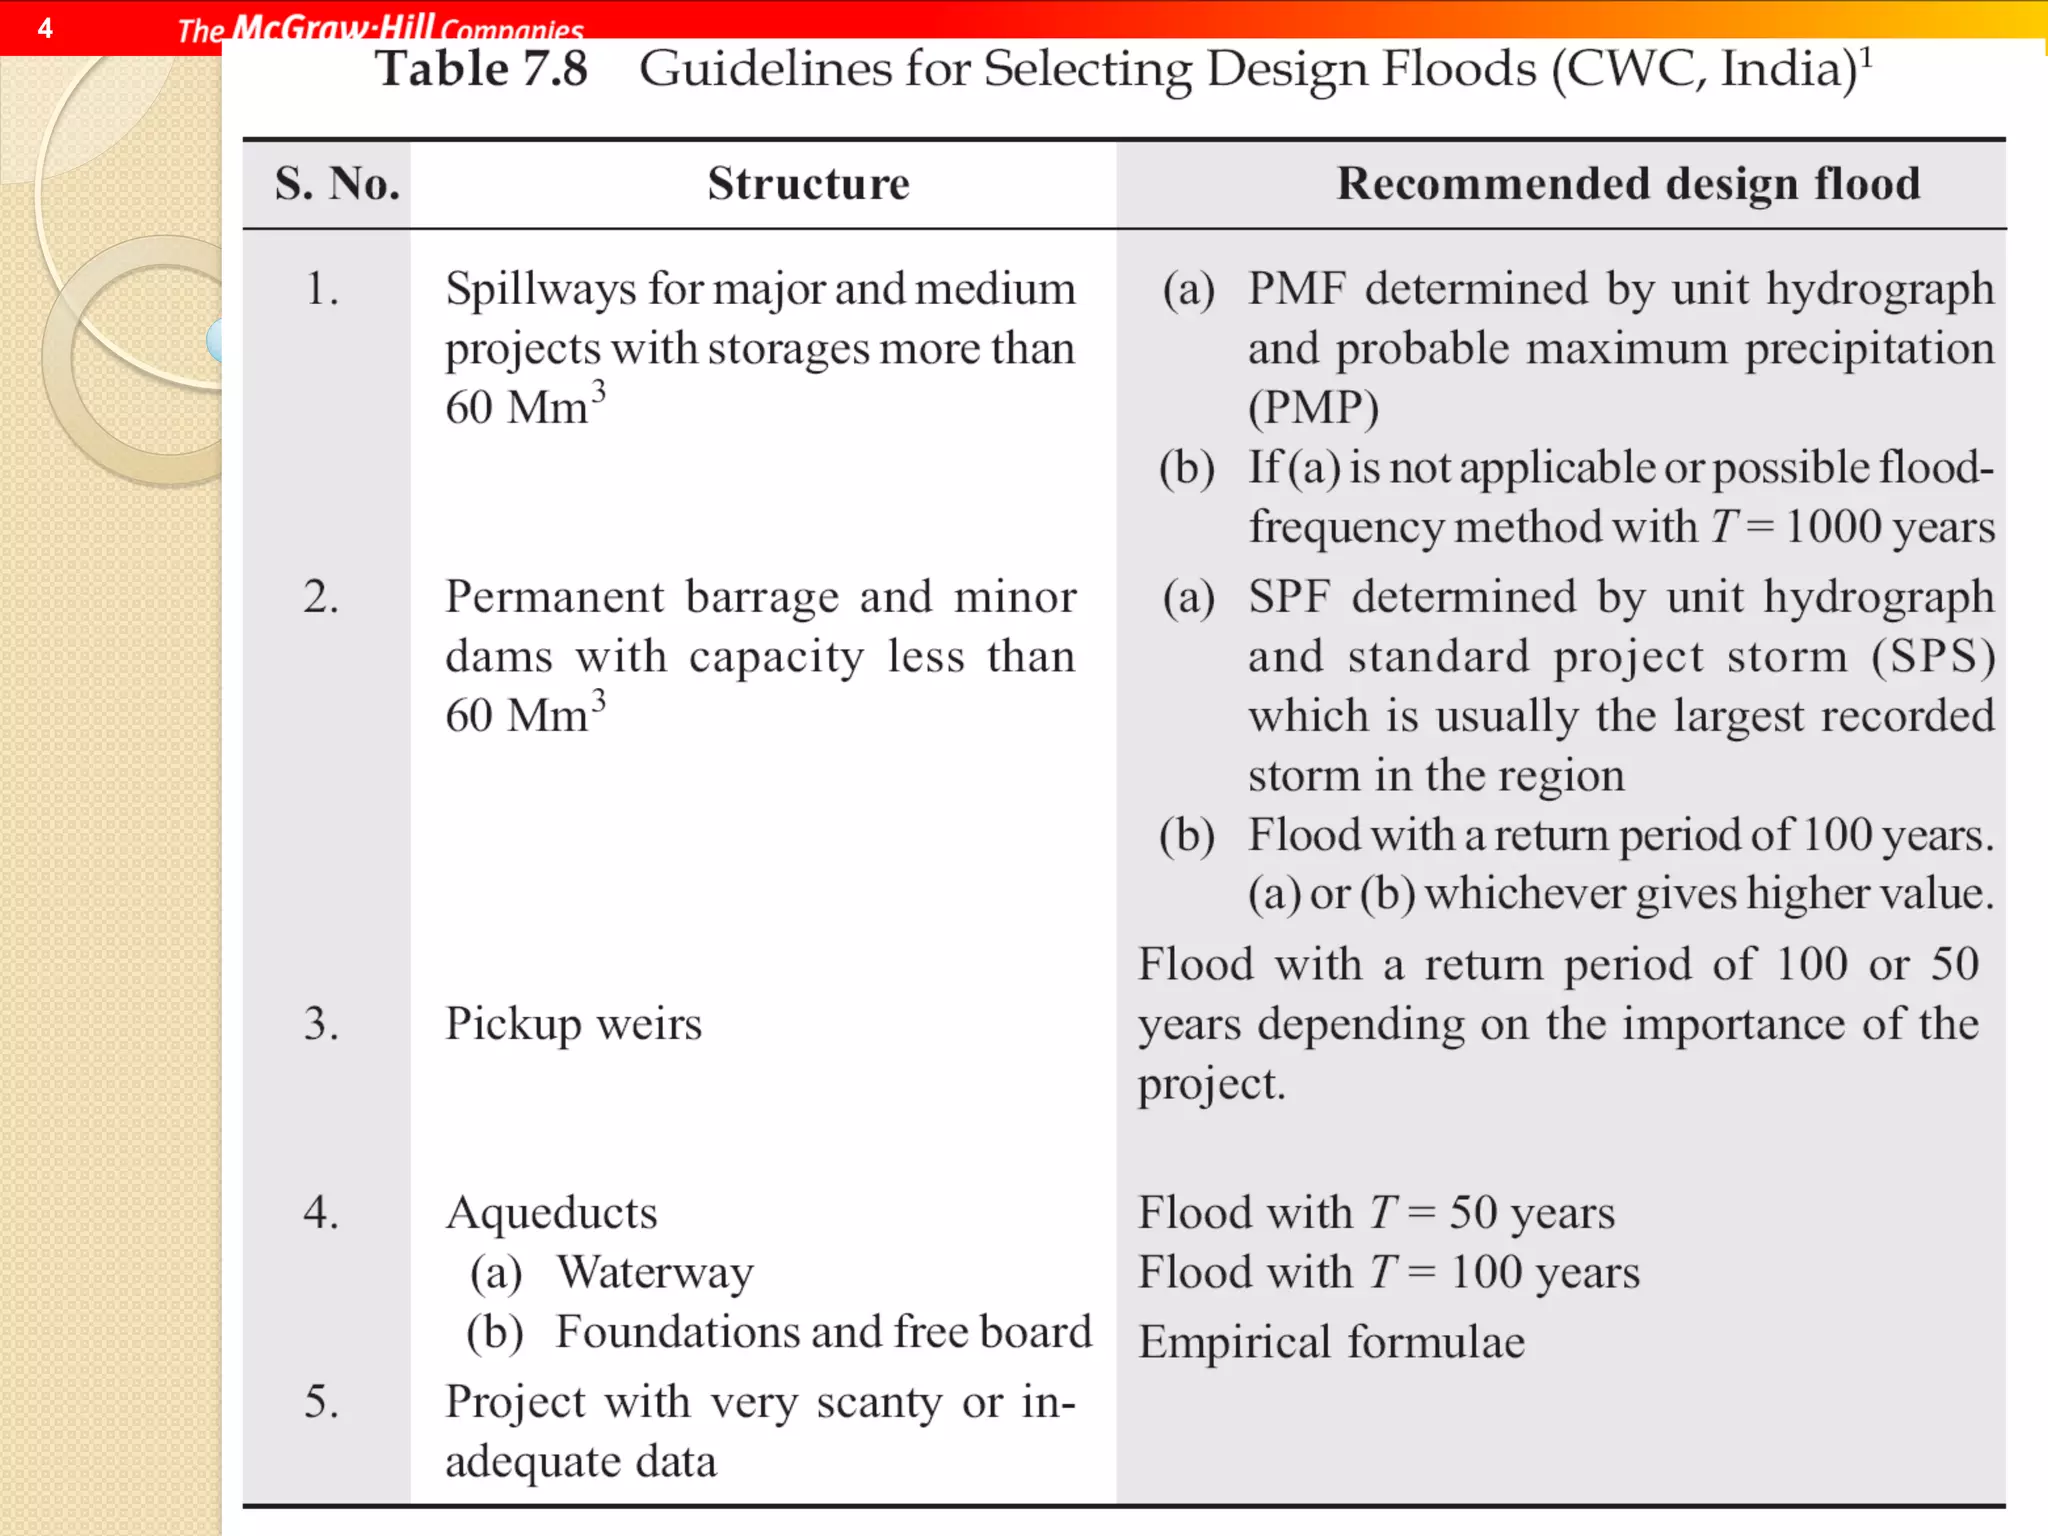
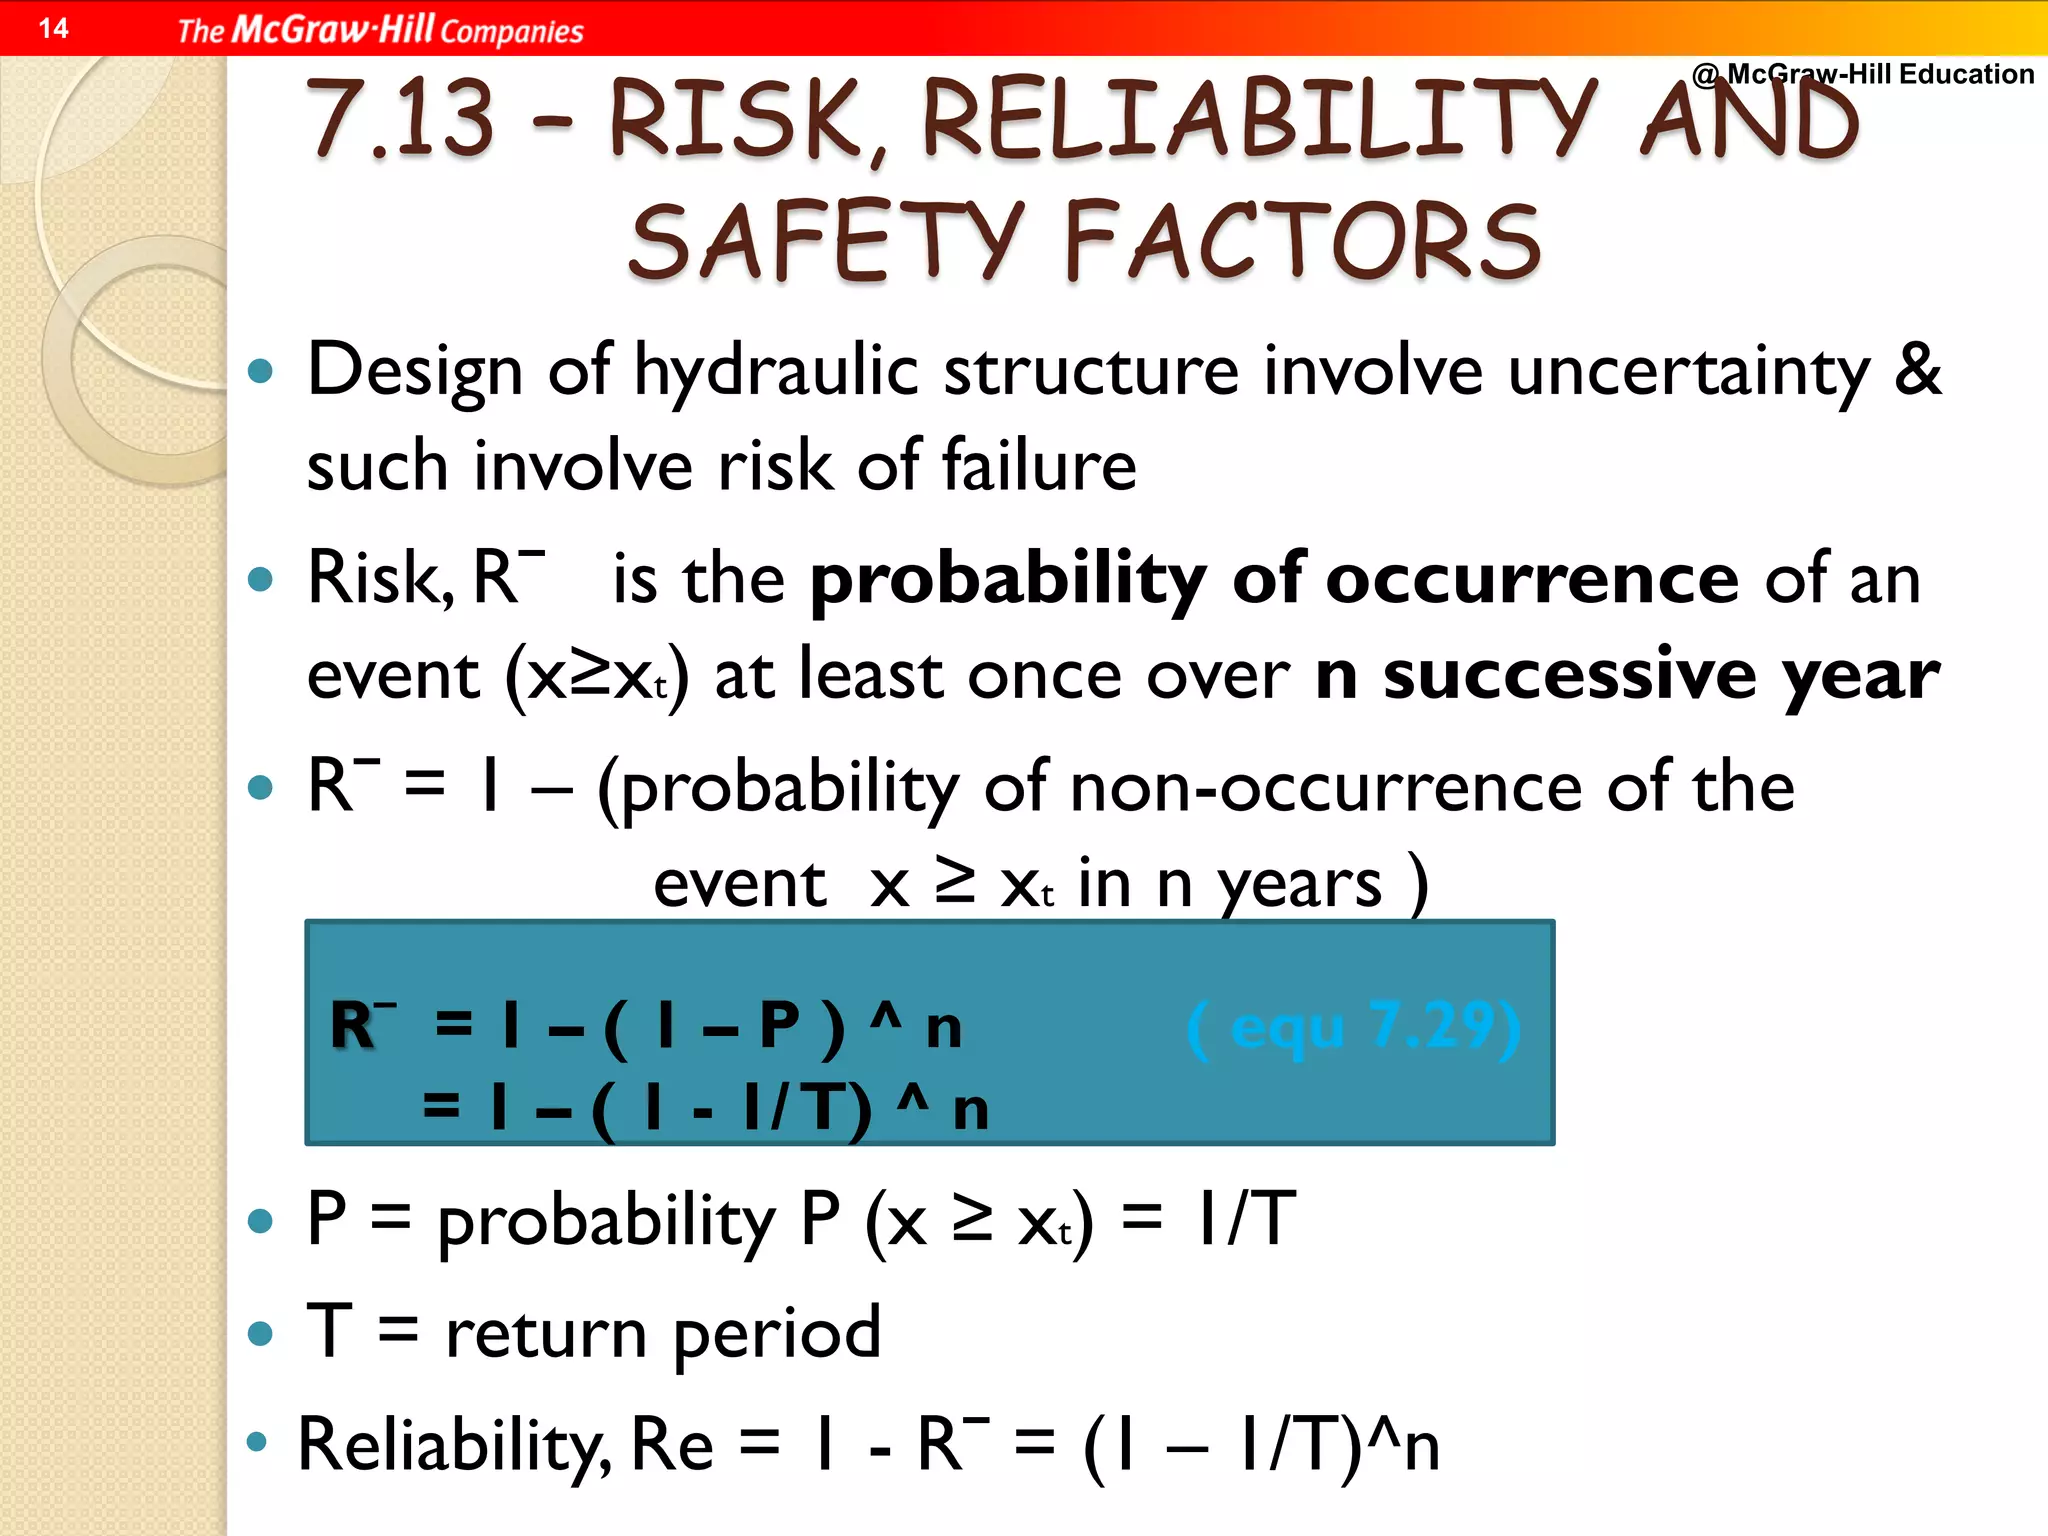
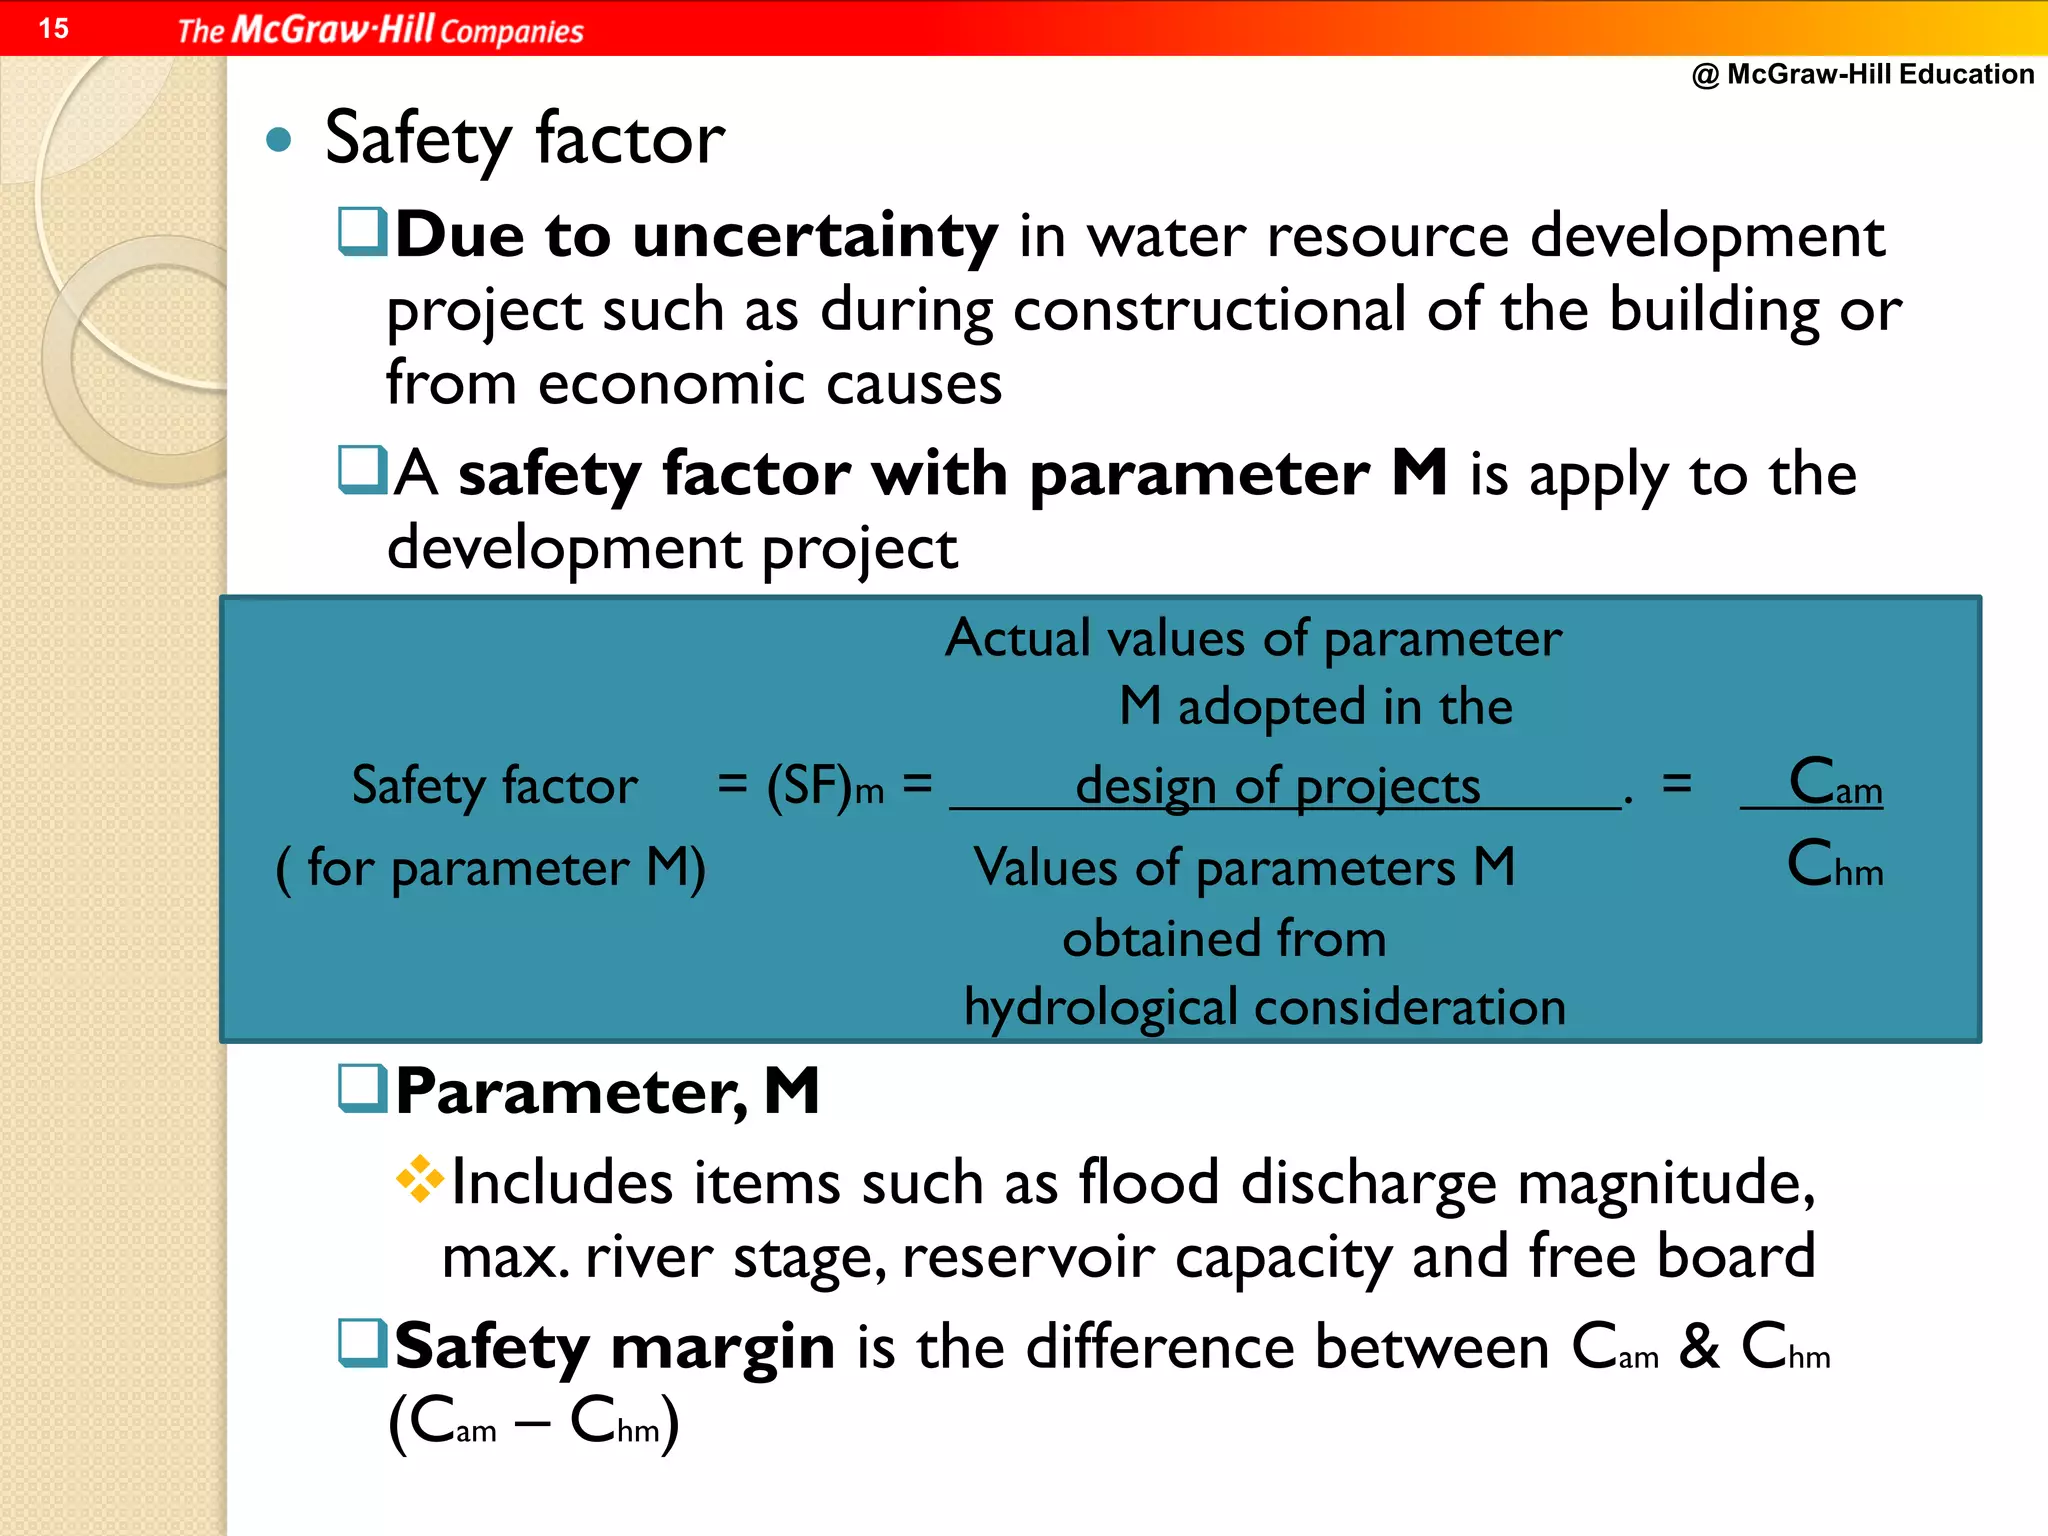
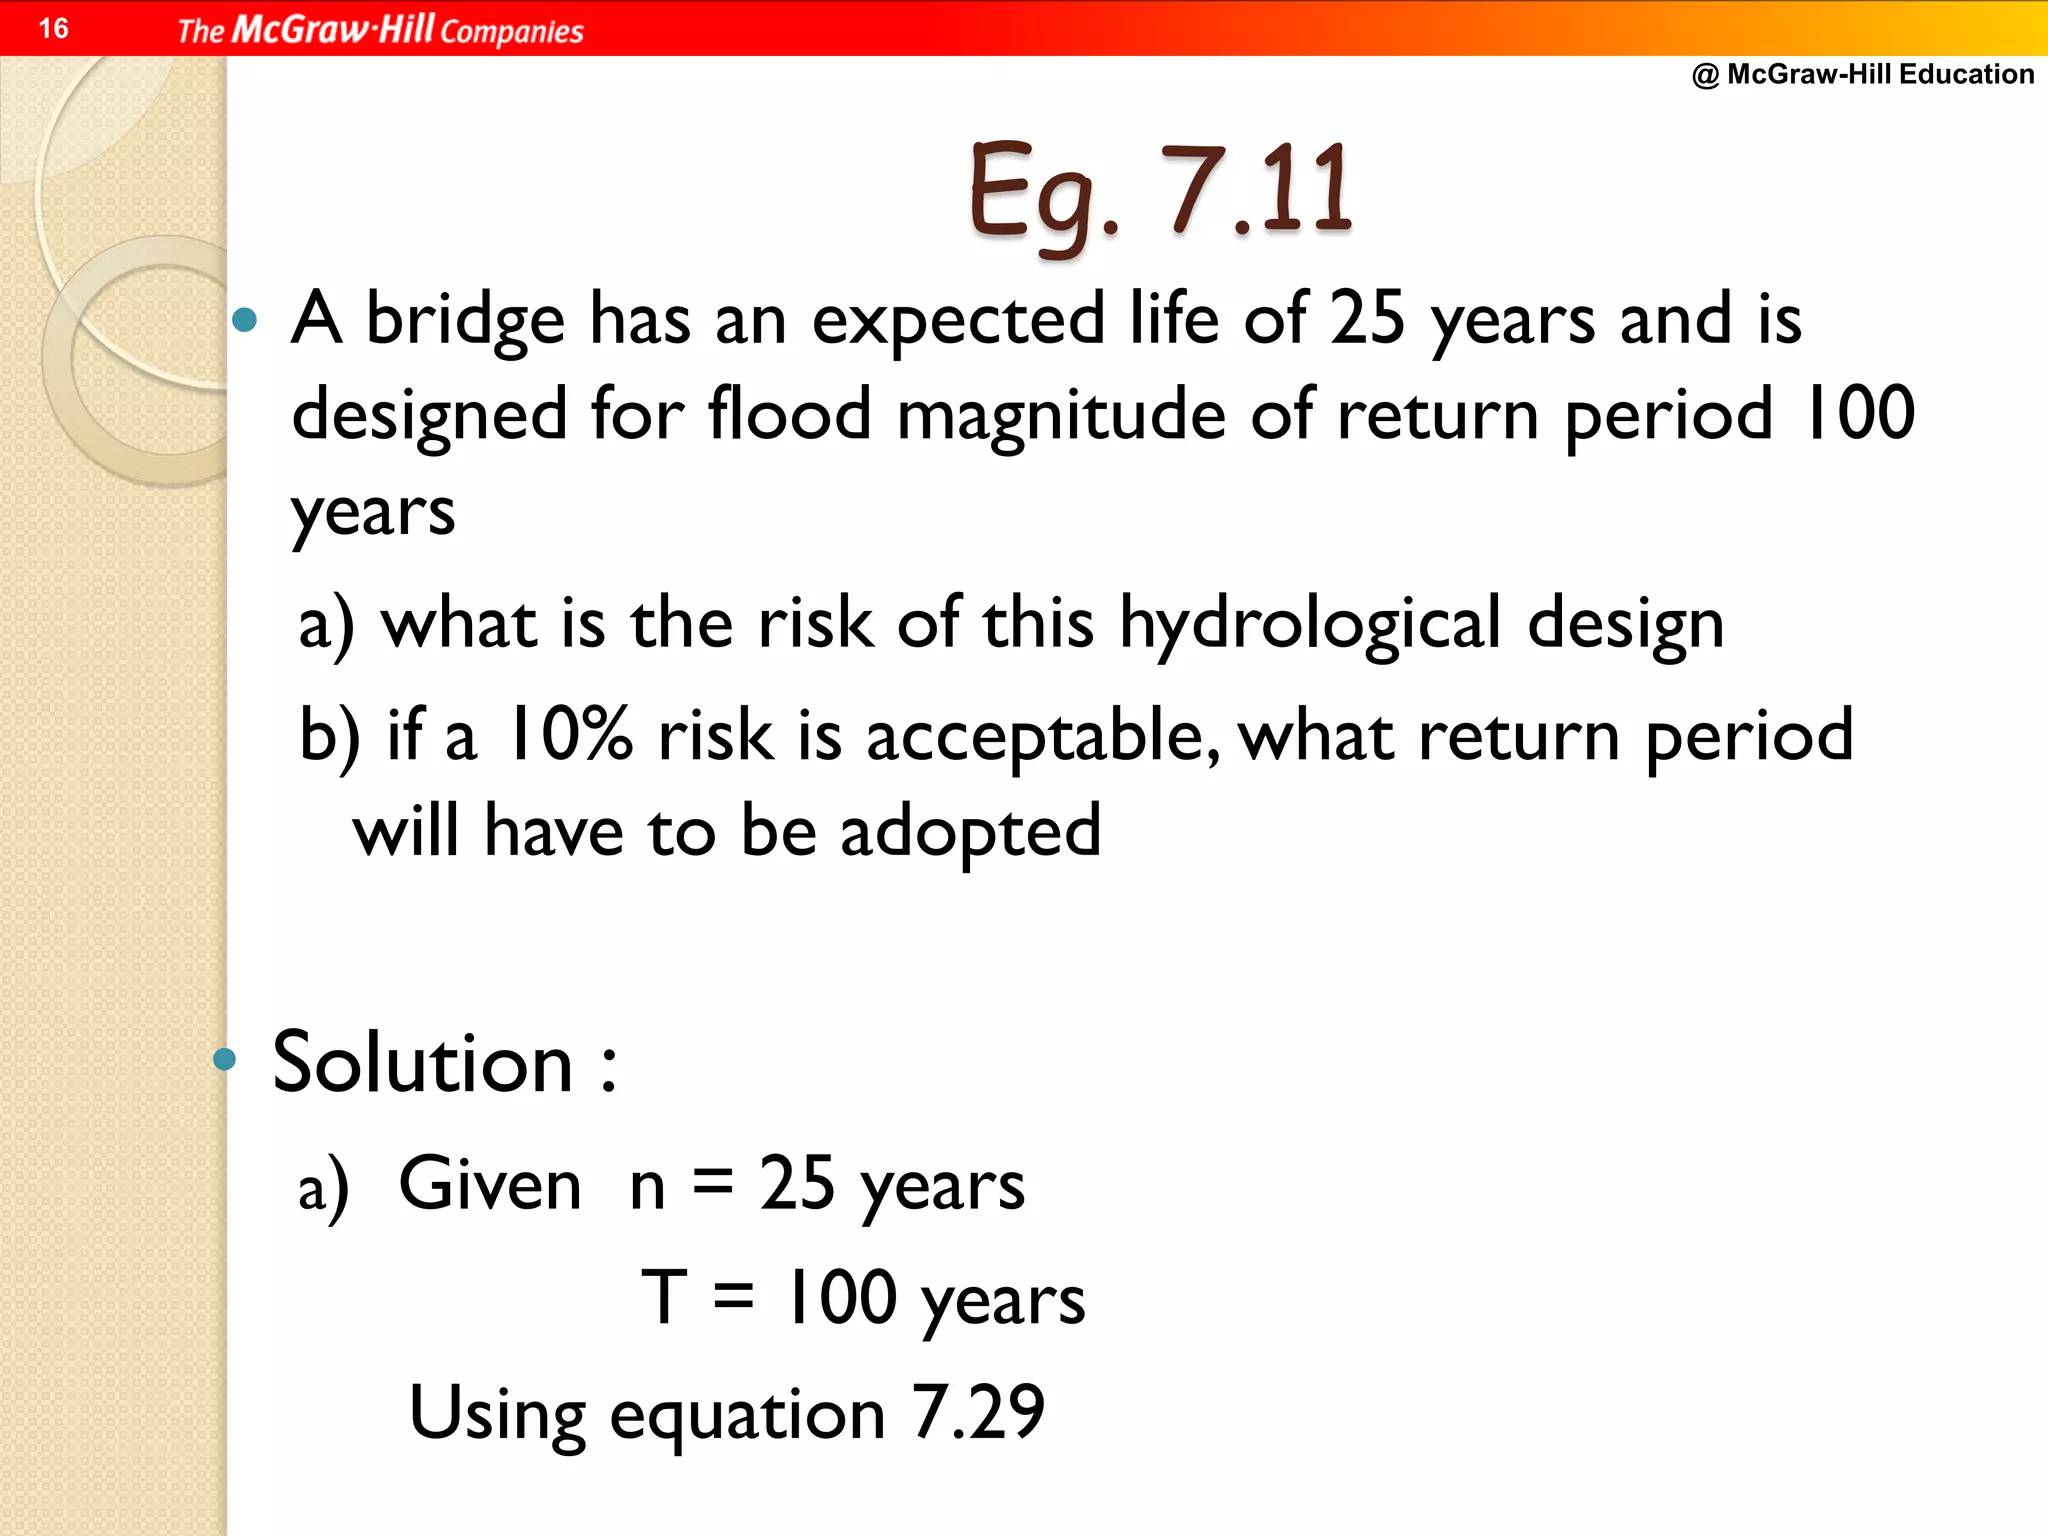
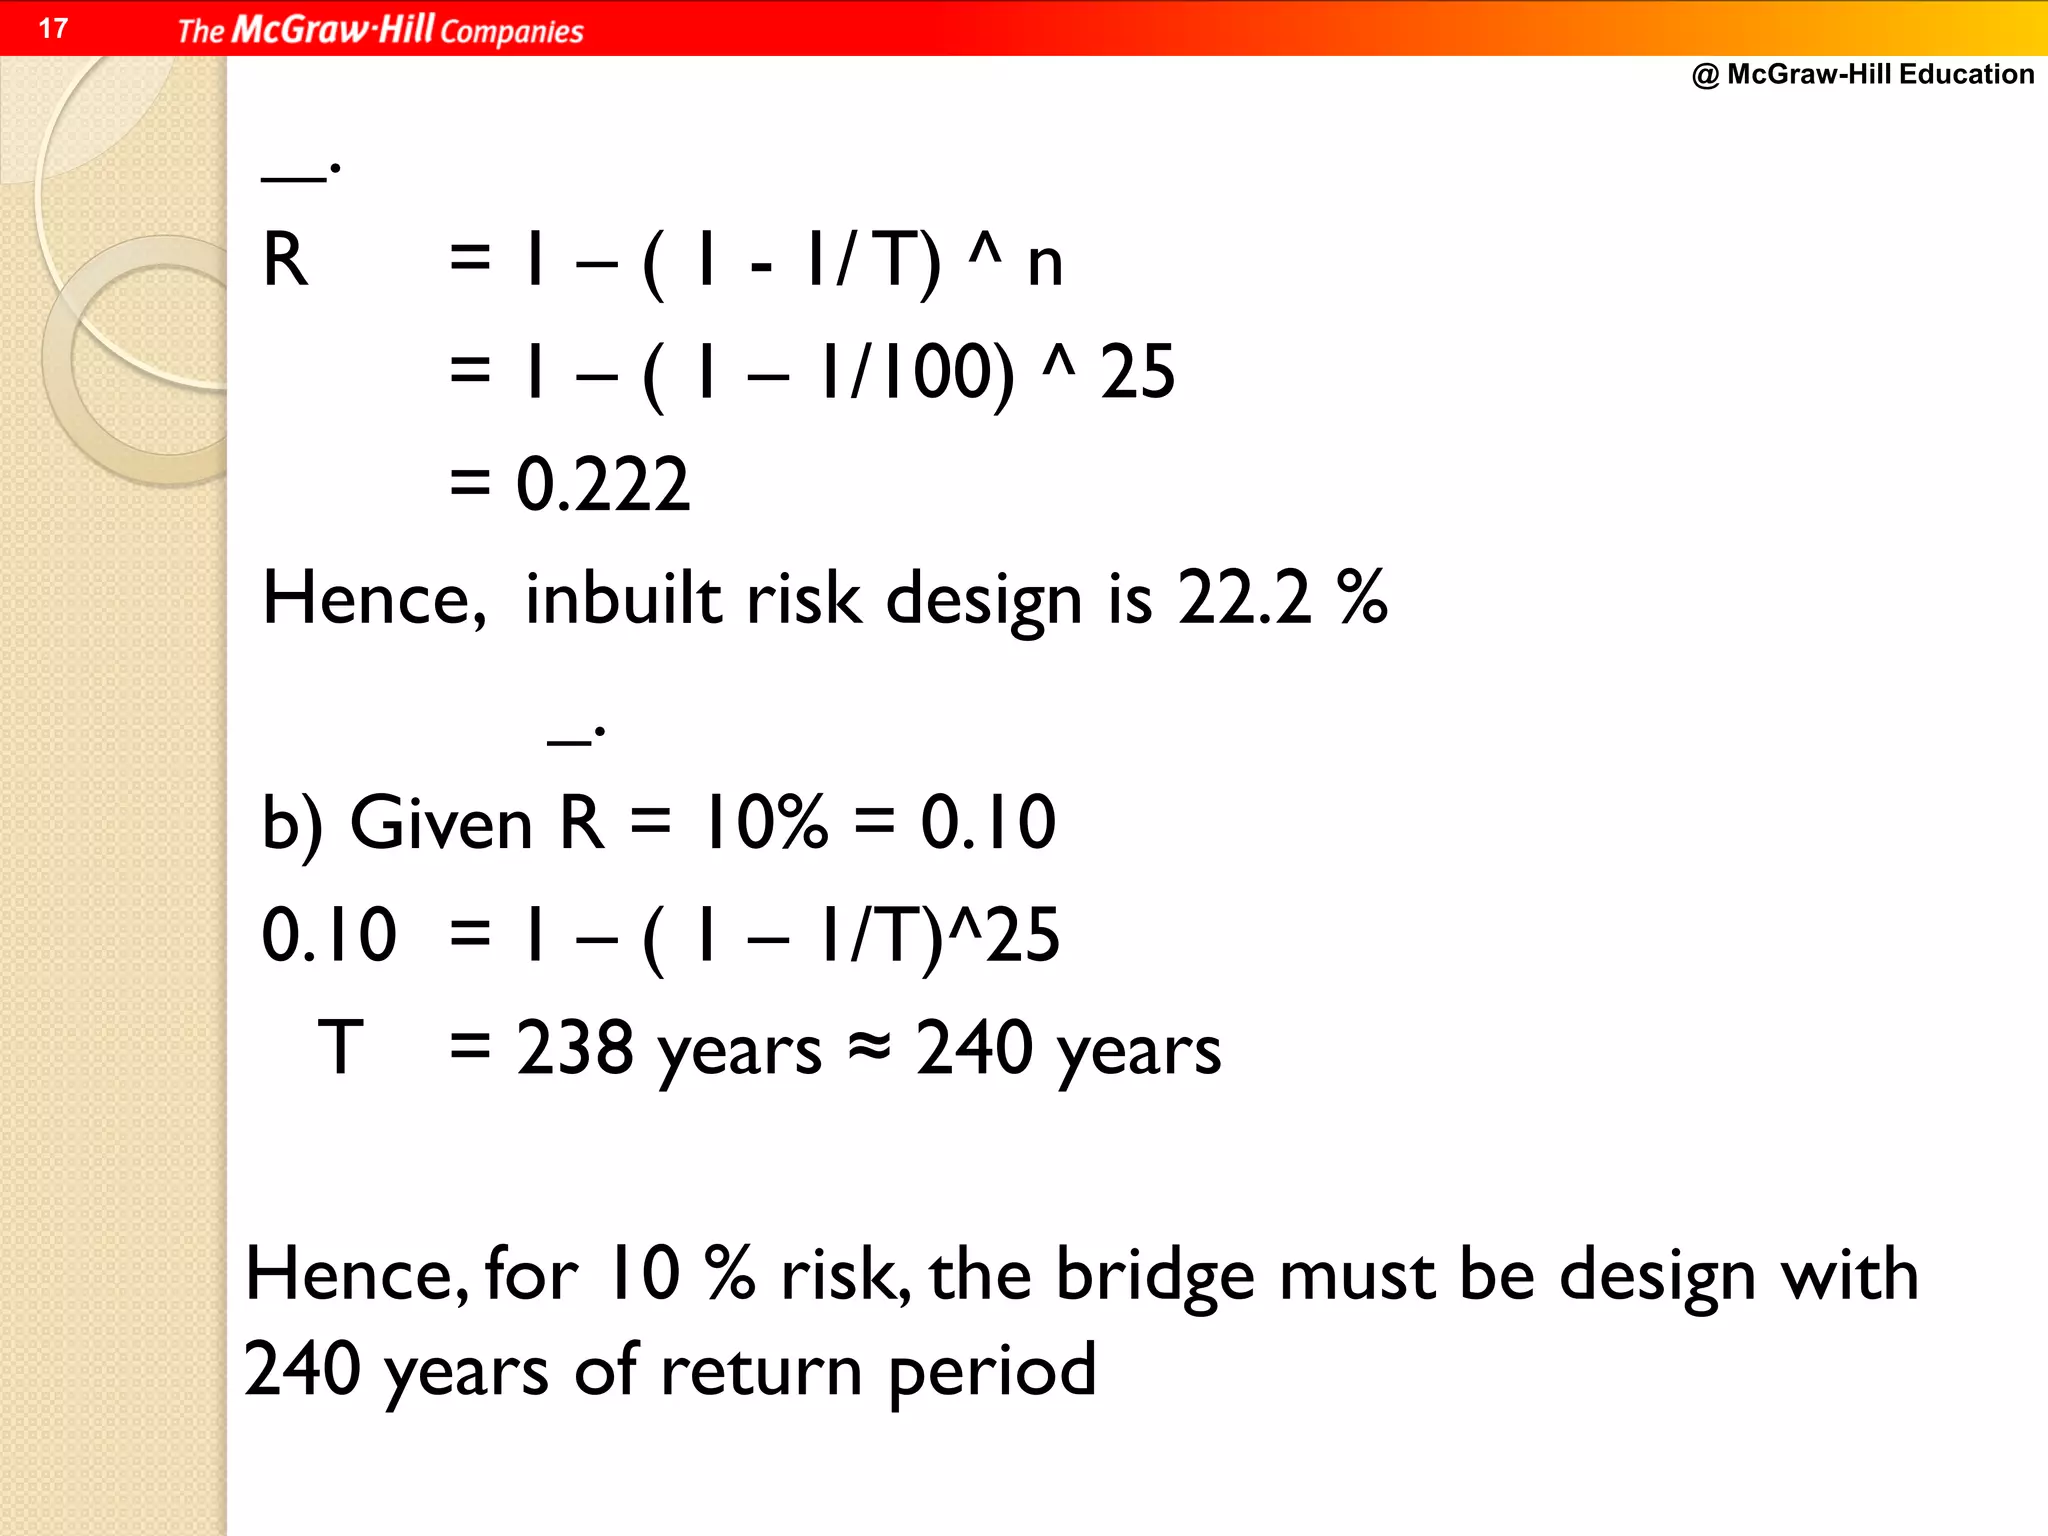
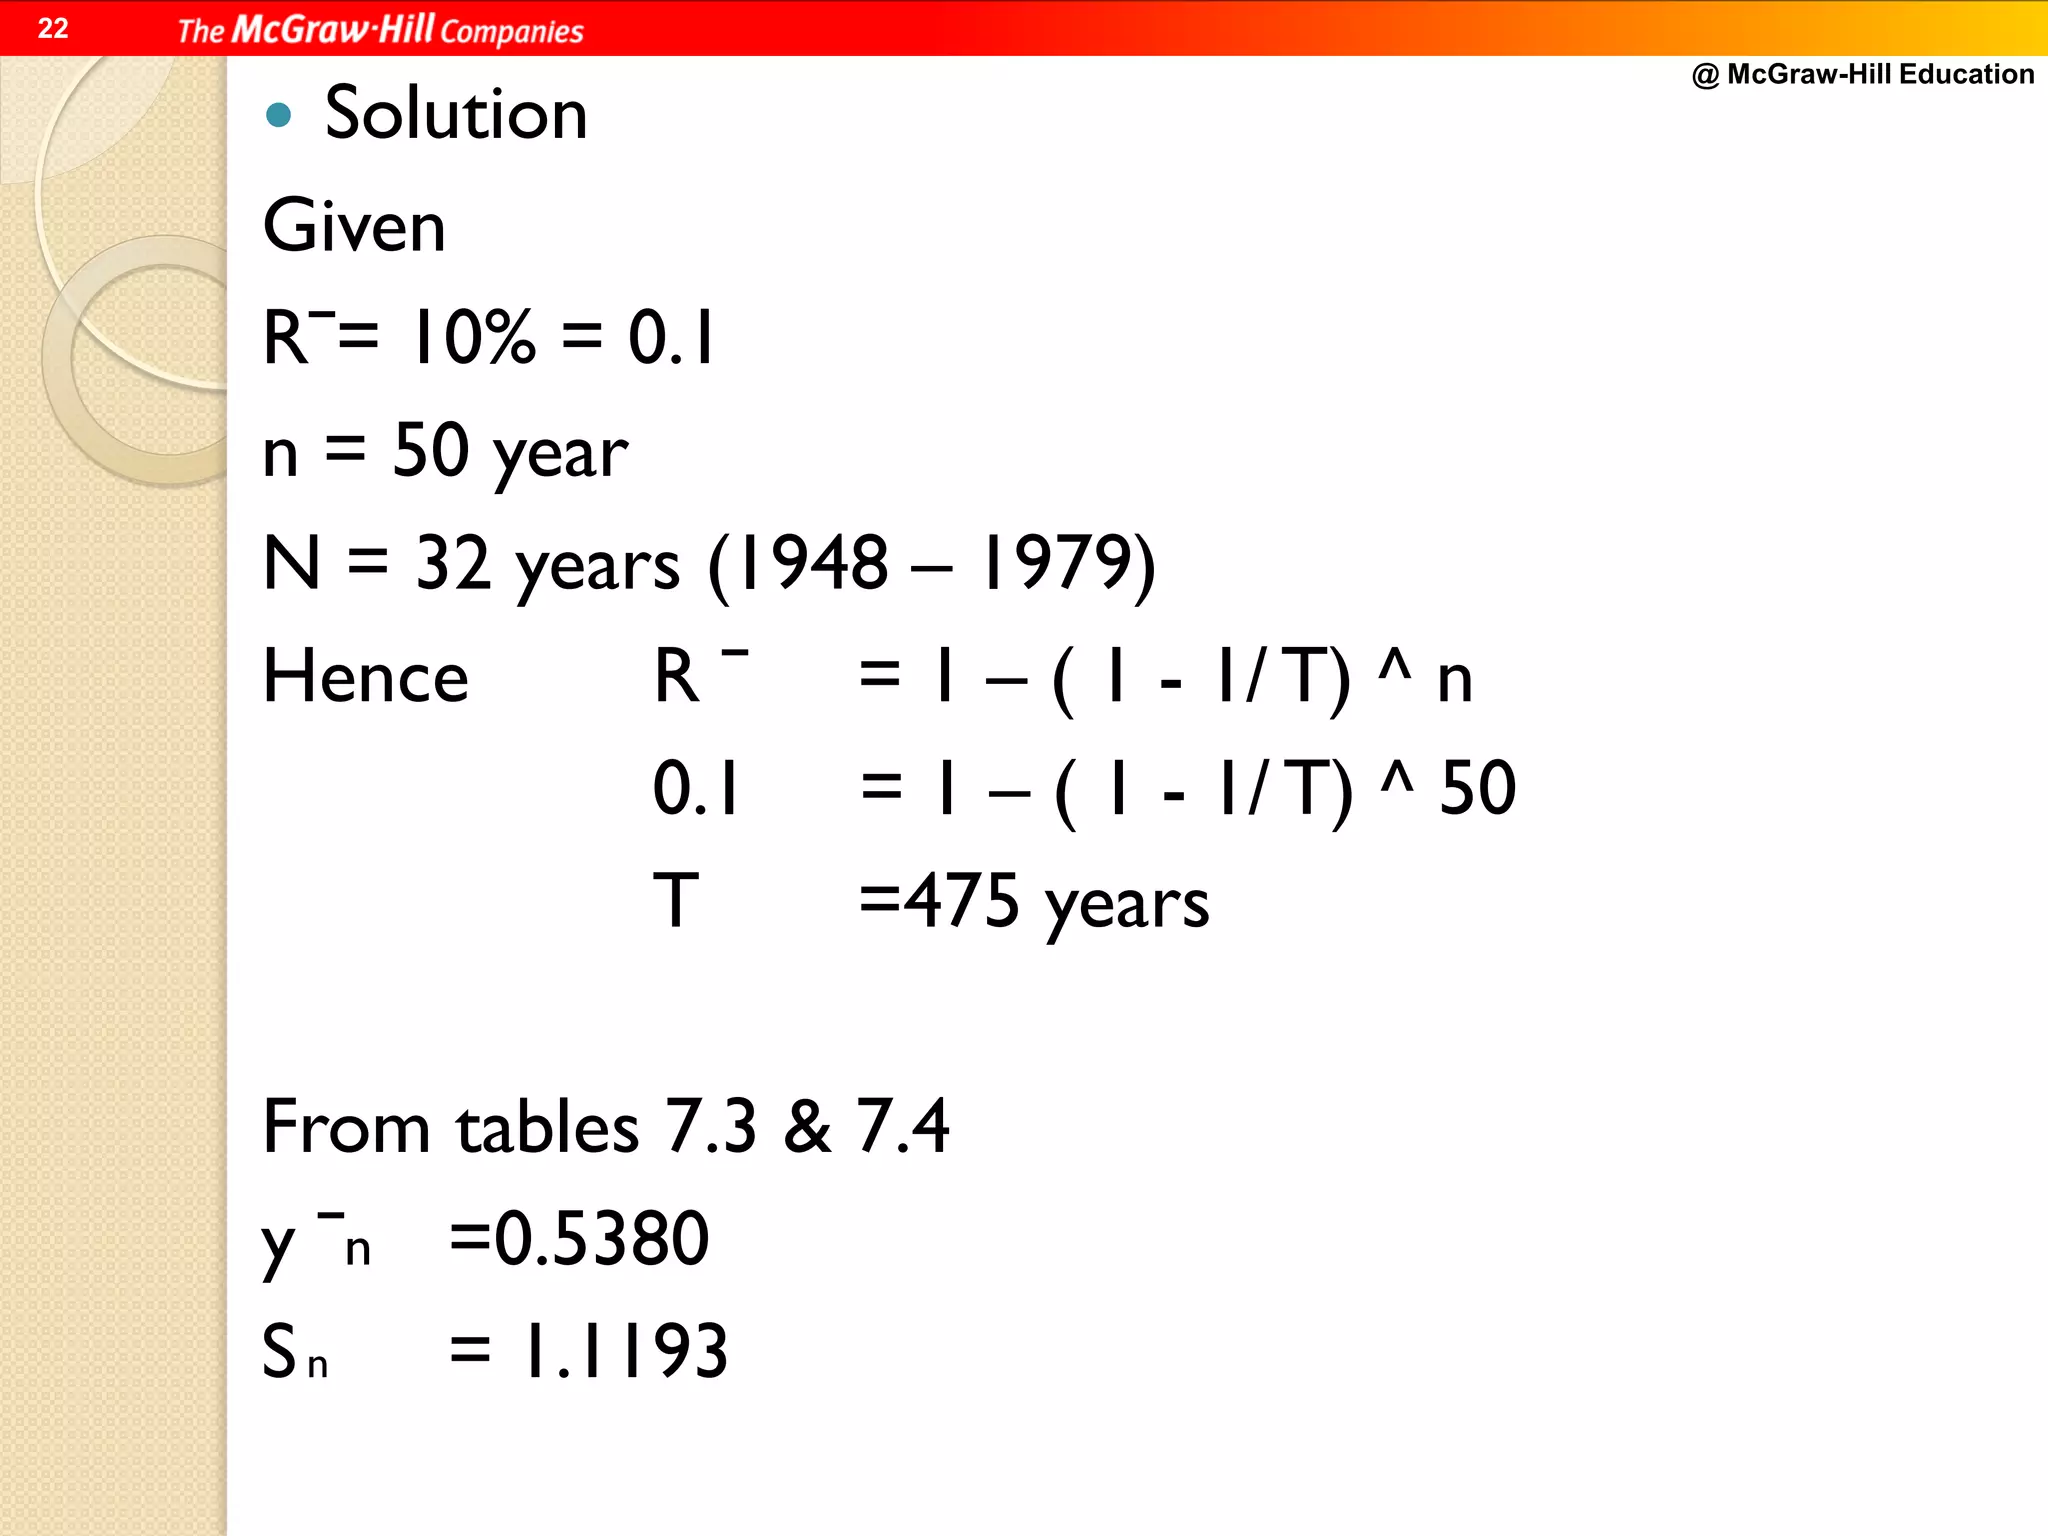
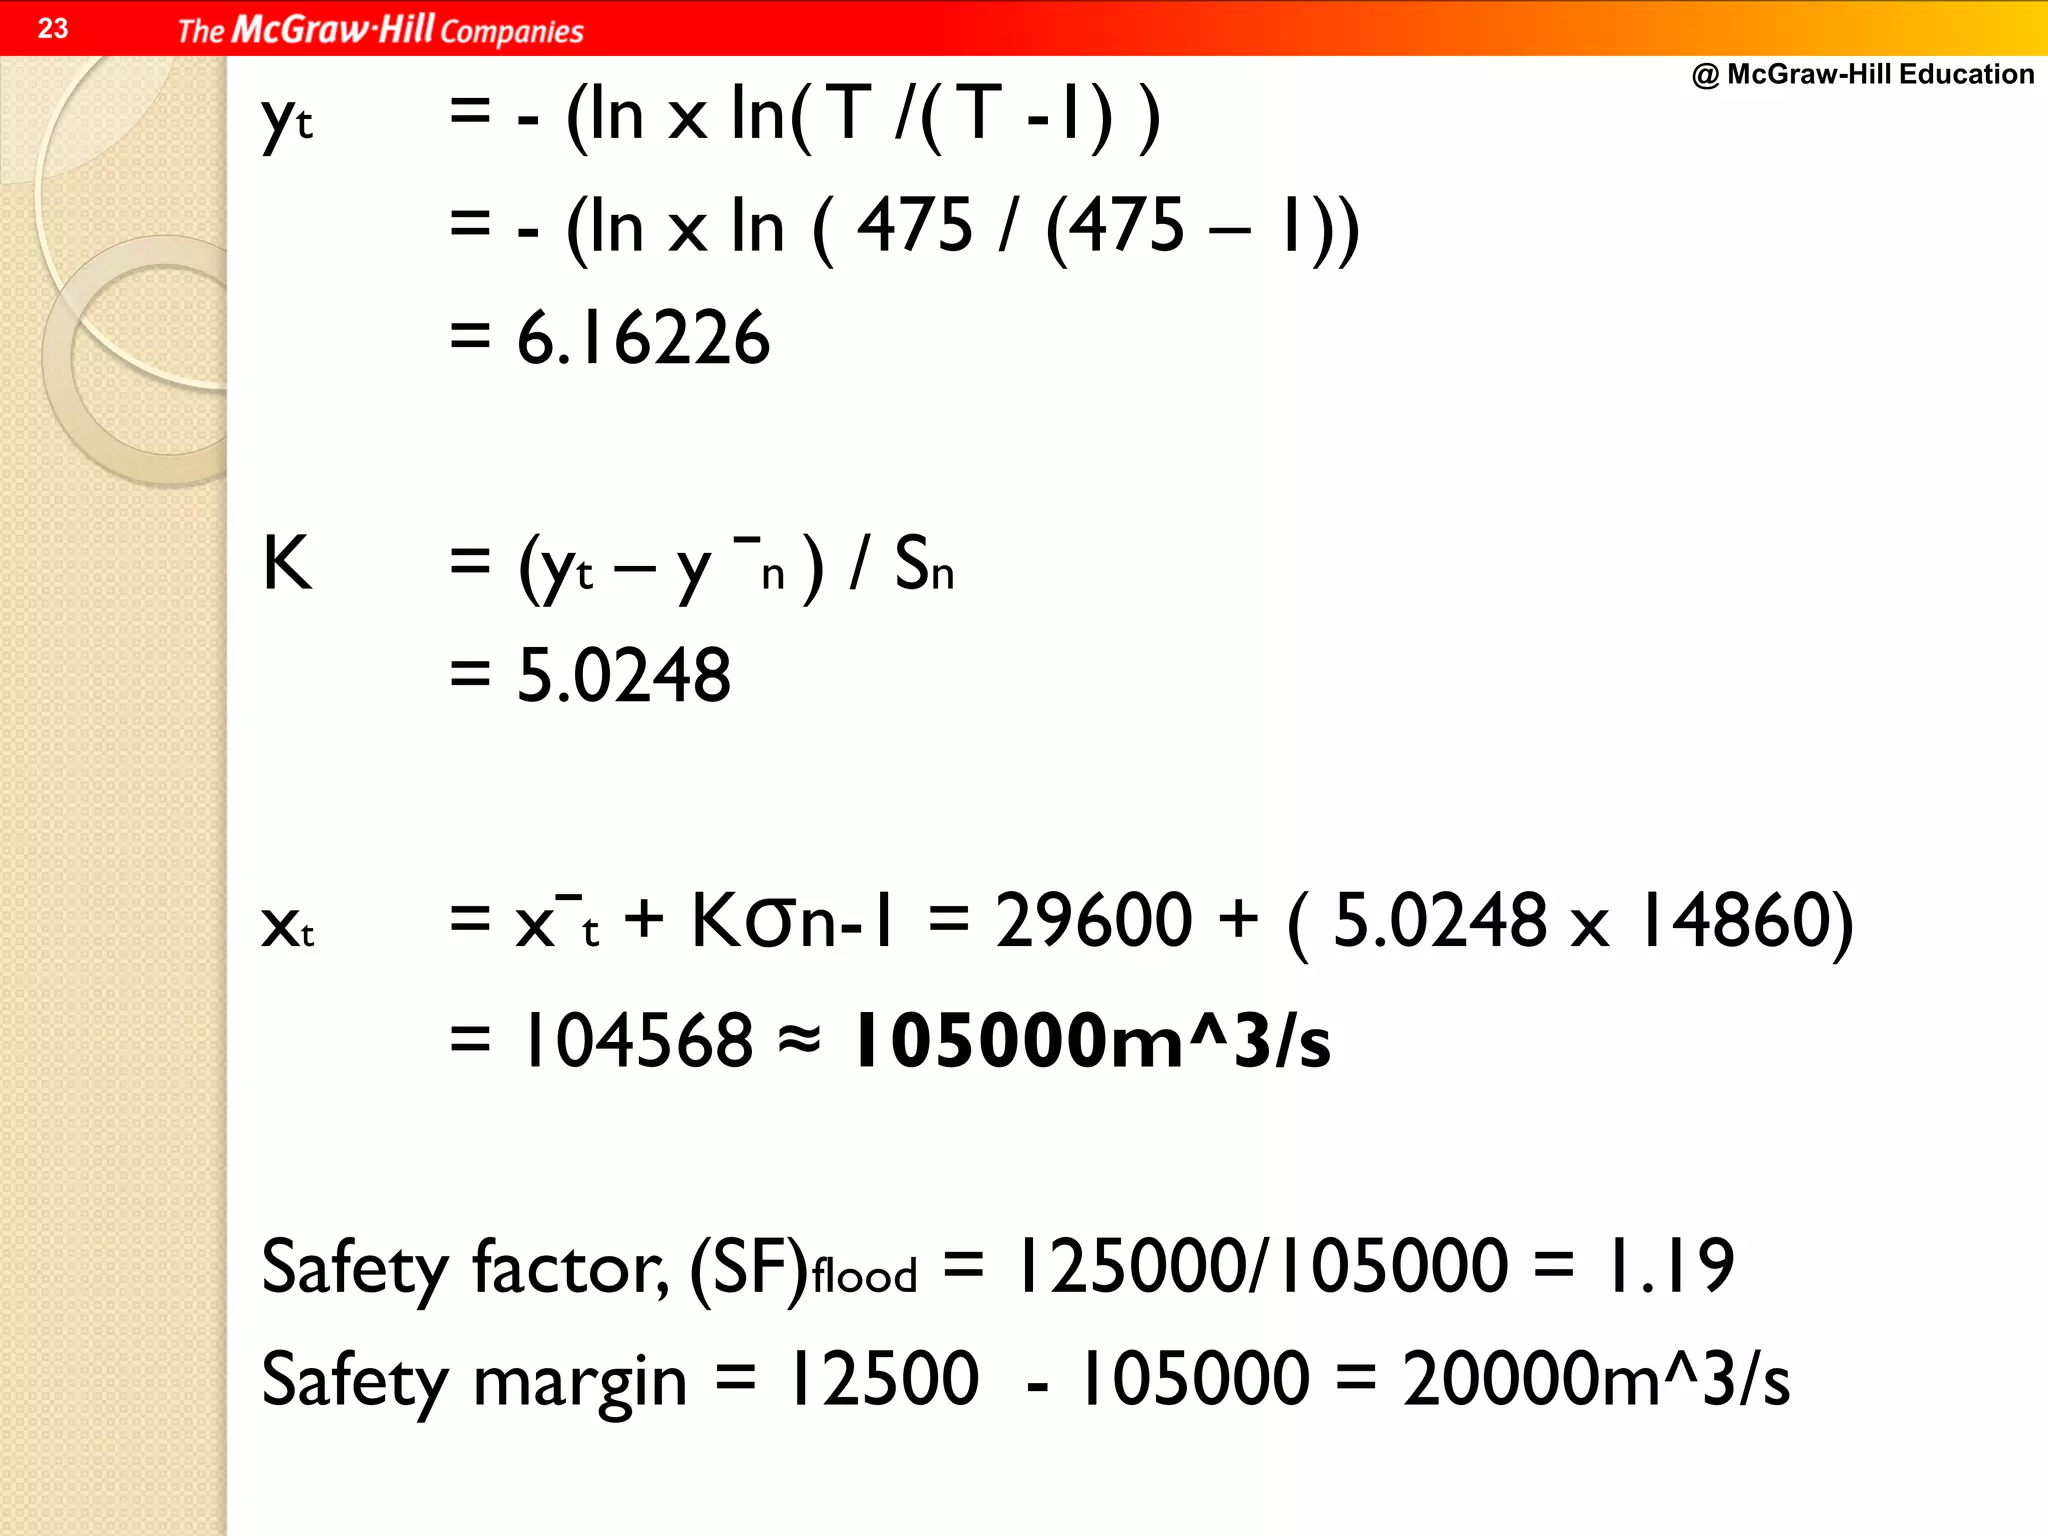

This document discusses methods for selecting design floods for hydraulic structures. It describes three types of design floods: spillway design flood, standard project flood, and probable maximum flood. The spillway design flood is used for spillway design. The standard project flood results from extreme but plausible meteorological conditions. The probable maximum flood represents the physically possible worst case flood. The document also provides examples of calculating design floods using the Gumbel method and defines safety factors and margins of safety for flood discharge estimates.