Downloaded 178 times

![MOTIVATION Flood Analysis is a vast topic which encompasses numerous variables and parameters. An attempt has been made to obtain the most rudimentary results which may be used as a reference and benchmark for further studies. Mathematical modeling of natural phenomena is, at best unpredictable. Which is reflected by Dingman [1994, p. 141]: “ The concepts of PMP and Flood Analysis are controversial. Can we really specify an upper bound to the amount of rain that can fall in a given time? We must recognize that the plotted values are only those that have been observed historically at the infinitesimal fraction of the earth covered by rain gages, and higher amounts must have fallen at ungauged locations at other times and places. And, conceptually, we can always imagine that a few more molecules of water could fall beyond any specified limit.”](https://image.slidesharecdn.com/extremevaluedistributiontopredictmaximumprecipitation-110709064919-phpapp02/85/Extreme-value-distribution-to-predict-maximum-precipitation-4-320.jpg)

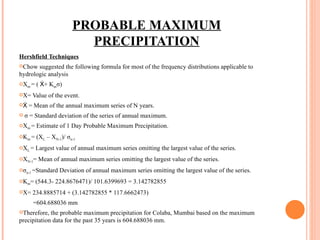
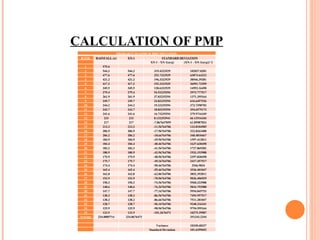
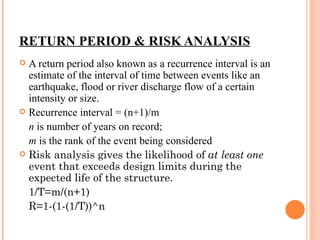
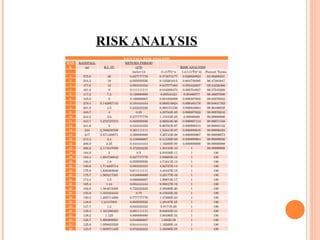
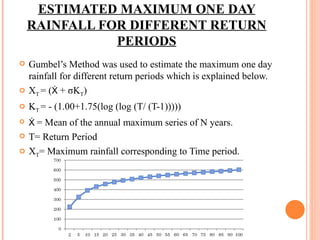

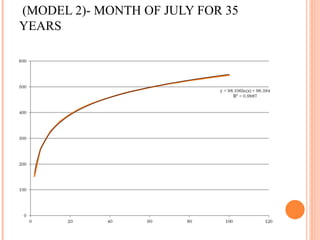
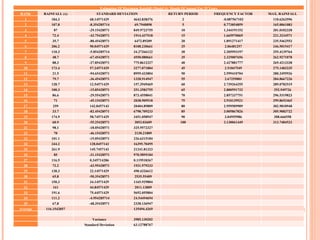
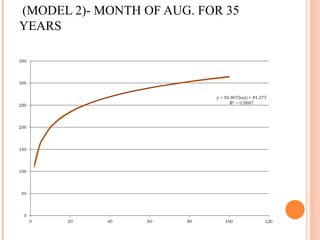
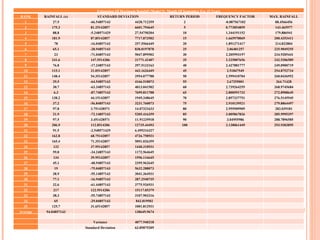
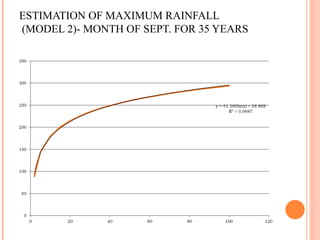
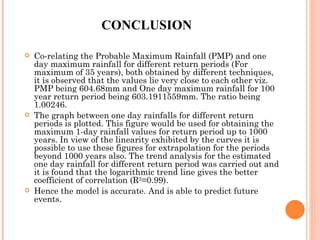
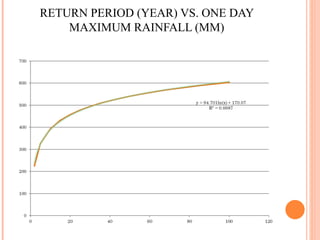

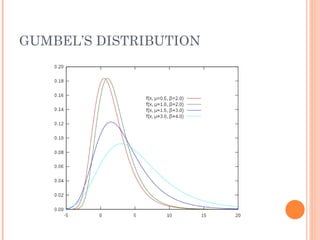

The document analyzes extreme rainfall events in Mumbai, India to determine maximum probable precipitation amounts for different return periods. It describes using the Hershfield technique and Gumbel's extreme value theory to analyze 35 years of rainfall data for Mumbai's Colaba region. Calculations determine the probable maximum precipitation is 604.688036 mm based on past data, and estimate maximum one-day rainfall amounts for return periods from 2 to 100 years.