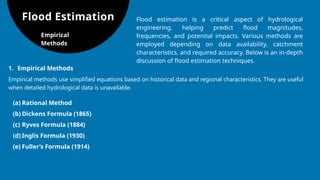
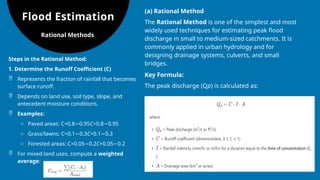
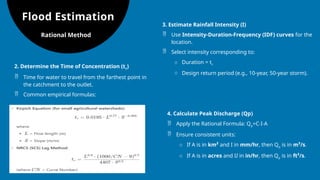
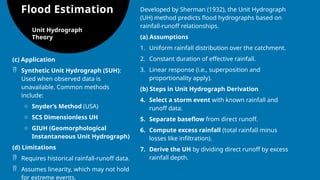
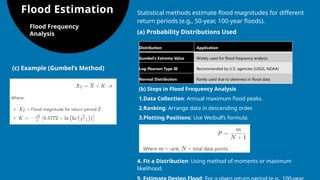
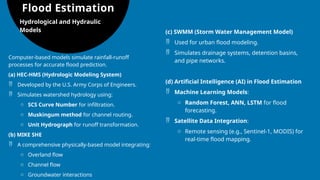
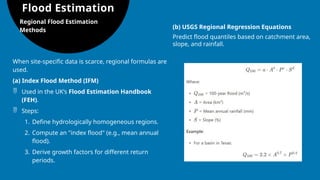
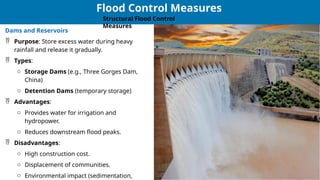
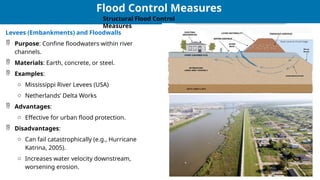
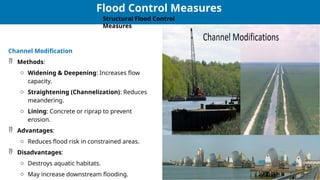
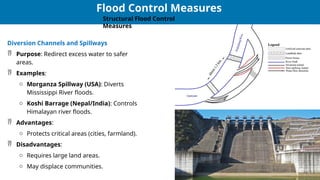
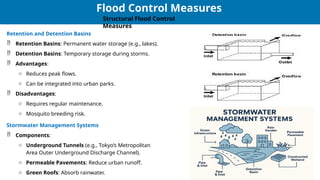
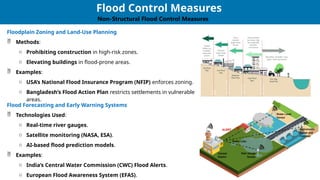
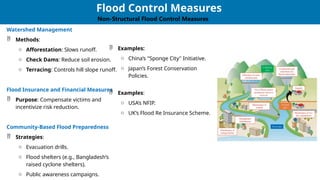
1
Md. Inzamul Haque
mihaque.iu@gmail.com
FLOOD
Estimation and Control Measures
Introduction
Floods are among the most devastating
natural disasters, causing significant
loss of life, property damage, and
environmental degradation. Flood
estimation and control measures are
essential for mitigating these risks and
ensuring sustainable water
management. This assignment explores
flood estimation methods, factors
influencing flood occurrence, and
various structural and non-structural
flood control measures.
Flood Estimation Flood estimation is a critical aspect of hydrological
engineering, helping predict flood magnitudes,
frequencies, and potential impacts. Various methods are
employed depending on data availability, catchment
characteristics, and required accuracy. Below is an in-depth
discussion of flood estimation techniques.
1. Empirical Methods
Empirical methods use simplified equations based on historical data and regional characteristics. They are useful
when detailed hydrological data is unavailable.
(a) Rational Method
(b) Dickens Formula (1865)
(c) Ryves Formula (1884)
(d) Inglis Formula (1930)
(e) Fuller’s Formula (1914)
Empirical
Methods
Flood Estimation
(a) Rational Method
The Rational Method is one of the simplest and most
widely used techniques for estimating peak flood
discharge in small to medium-sized catchments. It is
commonly applied in urban hydrology and for
designing drainage systems, culverts, and small
bridges.
Key Formula:
The peak discharge (Qp​
) is calculated as:
Rational Methods
Steps in the Rational Method:
1. Determine the Runoff Coefficient (C)
 Represents the fraction of rainfall that becomes
surface runoff.
 Depends on land use, soil type, slope, and
antecedent moisture conditions.
 Examples:
o Paved areas: C=0.8 0.95
− C=0.8 0.95
−
o Grass/lawns: C=0.1 0.3
− C=0.1 0.3
−
o Forested areas: C=0.05 0.2
− C=0.05 0.2
−
 For mixed land uses, compute a weighted
average:
Flood Estimation
2. Determine the Time of Concentration (tc​
)
 Time for water to travel from the farthest point in
the catchment to the outlet.
 Common empirical formulas:
Rational Method
3. Estimate Rainfall Intensity (I)
 Use Intensity-Duration-Frequency (IDF) curves for the
location.
 Select intensity corresponding to:
o Duration = tc
o Design return period (e.g., 10-year, 50-year storm).
4. Calculate Peak Discharge (Qp​
)
 Apply the Rational Formula: Qp=C⋅I⋅A
 Ensure consistent units:
o If A is in km² and I in mm/hr, then Qp​is in m³/s.
o If A is in acres and II in in/hr, then Qp​is in ft³/s.
Flood Estimation
Dickens Formula (1865)
The Dickens Formula is an empirical method
used for flood estimation, particularly in regions
where detailed hydrological data is scarce. It is
commonly applied in India and other parts
of South Asia for estimating peak flood discharge
in medium to large catchments.
Key Components:
1. Dickens Coefficient (CD​
)
 An empirical constant that depends on:
o Regional rainfall characteristics
o Catchment topography (hilly vs. flat)
o Soil type & land use
 Typical values:
o North India: 6–30
o Central India: 11–14
o South India: 14–28
o Hilly regions: Up to 35
 Higher values indicate higher flood potential.
2. Exponent (n)
 Usually taken as 0.75 (based on historical data).
 Some variations use 0.67 to 0.80 depending on basin
characteristics.
Flood Estimation
Dickens Formula (1865)
Assumptions & Limitations:
✔ Simple and quick for preliminary estimates.
✔ Useful in data-scarce regions.
✔ Best suited for medium to large
catchments (50–5,000 km²).
❌ Highly empirical—accuracy depends on
correct CD​
.
❌ Does not account for rainfall distribution or
storm duration.
❌ Not suitable for small catchments (use
Rational Method instead).
❌ Less accurate than modern methods (e.g.,
Unit Hydrograph, HEC-HMS).
Steps to Apply the Dickens Formula:
1. Determine the catchment area (A) in km².
2. Select an appropriate CD​based on regional
guidelines.
3. Compute peak discharge using:
Qp=CD⋅A0.75
4. Adjust for extreme cases (e.g., steep slopes →
higher CD).
Flood Estimation
Ryves Formula (1884)
The Ryves Formula is an empirical flood estimation
method commonly used in South India (especially Tamil
Nadu and Karnataka) to predict peak flood discharge in
medium to large catchments. It is similar to the Dickens
Formula but uses different regional coefficients.
Formula:
Key Components
1. Ryves Coefficient (CR​
)
 Depends on regional rainfall patterns and catchment
characteristics.
 Typical values:
Region CR
Plains (low flood risk) 6.8
Average Indian catchments 8.5 – 10.0
Hilly areas (high rainfall) 10.2 – 12.0
Coastal regions (extreme
rainfall)
Up to 13.5
2. Catchment Area (A)
 Should be in square kilometers (km²).
Flood Estimation
Ryves Formula (1884)
Steps to Apply Ryves Formula
1. Determine the catchment area (AA) from maps
or surveys.
2. Select the appropriate CRCR​based on location
and flood risk.
3. Calculate peak discharge using:
Assumptions & Limitations-
• Simple and quick for preliminary flood estimation.
• Useful in data-scarce regions (especially South India).
• Best for medium to large catchments (50–5,000 km²)
• Highly empirical—accuracy depends on correct CRCR​
.
Does not consider rainfall intensity or duration.
• Not suitable for small catchments (use Rational
Method instead).
• Less accurate than modern methods (e.g., Unit
Hydrograph, HEC-HMS).
Flood Estimation
Inglis Formula (1930)
The Inglis Formula is an empirical flood estimation
method primarily used in Western India (particularly
Maharashtra) for predicting peak flood discharge in
medium to large catchments. It is derived from regional
flood data and is best suited for peninsular Indian rivers.
Key Features
1. Developed for Indian catchments, particularly
the Deccan Plateau.
2. Works best for medium to large basins (100–
5,000 km²).
3. Does not require rainfall data—purely area-
based.
Steps to Apply Inglis Method
4. Determine the catchment area (A) from topo
maps or GIS.
5. Plug into Inglis Formula to get Qp​
.
Assumptions & Limitations
✔ Simple and quick for preliminary estimates.
✔ No rainfall data needed—uses only catchment area.
❌ Region-specific—less accurate outside Western India.
❌ Does not account for rainfall intensity, slope, or soil type.
❌ Not suitable for small catchments (<100 km²).
Flood Estimation
Fuller’s Formula
(1914)
Fuller’s Formula is an empirical flood estimation
method used to predict peak flood discharge based on
historical data and catchment characteristics. It is
particularly useful for medium to large catchments where
long-term flood records are available.
Key Components
1. Fuller’s Coefficient (CF)
 An empirical constant that varies with climate,
topography, and soil type.
 Typical values:
o Temperate regions: CF=0.5 1.5
−
o Tropical high-rainfall zones: CF=1.5 3.0
−
o Arid regions: CF=0.3 0.8
−
2. Catchment Area (A)
 Must be in consistent units (km² or mi²).
3. Return Period (T)
 The average time interval between flood events of a given
magnitude (e.g., 10, 25, 50, 100 years).
Flood Estimation
Fuller’s Formula
(1914)
Steps to Apply Fuller’s Method
1. Determine the catchment area (A) from
maps or surveys.
2. Select an appropriate CF​based on regional
data.
3. Choose the design return period (T) (e.g.,
25 years for small bridges, 100 years for
dams).
4. Calculate peak discharge (Qp​
) using the
formula.
Assumptions & Limitations
✔ Accounts for return period, making it
useful for risk-based design.
✔ Works well for medium to large
basins (50–10,000 km²).
✔ Better than purely regional formulas (e.g.,
Dickens, Ryves) when long-term data exists.
❌ Requires historical flood data for
calibration.
❌ Not suitable for small urban
catchments (use Rational Method instead).
❌ Does not consider storm duration or
rainfall intensity explicitly.
Flood Estimation
Modified Empirical Formula
SCS Curve Number Method (USDA, 1954)
The Soil Conservation Service
(SCS) Curve Number (CN)
Method is a widely used empirical
technique for estimating direct
runoff or flood hydrographs from
rainfall events, particularly in
ungauged watersheds. Developed
by the U.S. Department of
Agriculture (USDA) Soil
Conservation Service (now NRCS),
it is based on soil type, land use,
and antecedent moisture
conditions.
Key Concepts of the SCS-CN Method
Flood Estimation
Steps to Apply the SCS-CN Method
1.Determine the Curve Number (CN):
1. Select CN based on:
1.Soil Group (A: High infiltration D: Low
→
infiltration).
2.Land Use/Land Cover (e.g., agriculture,
urban, forest).
3.Antecedent Moisture Condition (AMC):
1. AMC I (Dry), AMC II (Average), AMC III
(Wet).
Standard tables provide CN values for different
conditions (e.g., NRCS TR-55 manual).
2. Compute SS:
1. Use the CN to calculate SS (in mm or inches).
3. Calculate Runoff (QQ):
2. Plug PP (rainfall) and SS into the runoff
equation.
4. Peak Discharge Estimation (Optional):
3. Combine with the SCS Unit
Hydrograph method to estimate flood
hydrographs.
Limitations of the SCS-CN Method
•Empirical: May not perform well in all regions
(calibration needed).
•Assumes uniform rainfall: Does not account for
spatial variability.
•Neglects time dynamics: Better for small to medium
watersheds (< 250 km²).
•Sensitive to CN selection: Errors in CN lead to large
runoff errors.
Modified Empirical Formula
SCS Curve Number Method (USDA, 1954)
Flood Estimation
Unit Hydrograph
Theory
Developed by Sherman (1932), the Unit Hydrograph
(UH) method predicts flood hydrographs based on
rainfall-runoff relationships.
(a) Assumptions
1. Uniform rainfall distribution over the catchment.
2. Constant duration of effective rainfall.
3. Linear response (i.e., superposition and
proportionality apply).
(b) Steps in Unit Hydrograph Derivation
4. Select a storm event with known rainfall and
runoff data.
5. Separate baseflow from direct runoff.
6. Compute excess rainfall (total rainfall minus
losses like infiltration).
7. Derive the UH by dividing direct runoff by excess
rainfall depth.
(c) Application
 Synthetic Unit Hydrograph (SUH):
Used when observed data is
unavailable. Common methods
include:
o Snyder’s Method (USA)
o SCS Dimensionless UH
o GIUH (Geomorphological
Instantaneous Unit Hydrograph)
(d) Limitations
 Requires historical rainfall-runoff data.
 Assumes linearity, which may not hold
for extreme events.
Flood Estimation
Flood Frequency
Analysis
Statistical methods estimate flood magnitudes for different
return periods (e.g., 50-year, 100-year floods).
(a) Probability Distributions Used
Distribution Application
Gumbel’s Extreme Value Widely used for flood frequency analysis
Log-Pearson Type III Recommended by U.S. agencies (USGS, NOAA)
Normal Distribution Rarely used due to skewness in flood data
(b) Steps in Flood Frequency Analysis
1.Data Collection: Annual maximum flood peaks.
2.Ranking: Arrange data in descending order.
3.Plotting Positions: Use Weibull’s formula:
4. Fit a Distribution: Using method of moments or maximum
likelihood.
(c) Example (Gumbel’s Method)
Flood Estimation
Hydrological and Hydraulic
Models
Computer-based models simulate rainfall-runoff
processes for accurate flood prediction.
(a) HEC-HMS (Hydrologic Modeling System)
 Developed by the U.S. Army Corps of Engineers.
 Simulates watershed hydrology using:
o SCS Curve Number for infiltration.
o Muskingum method for channel routing.
o Unit Hydrograph for runoff transformation.
(b) MIKE SHE
 A comprehensive physically-based model integrating:
o Overland flow
o Channel flow
o Groundwater interactions
(c) SWMM (Storm Water Management Model)
 Used for urban flood modeling.
 Simulates drainage systems, detention basins,
and pipe networks.
(d) Artificial Intelligence (AI) in Flood Estimation
 Machine Learning Models:
o Random Forest, ANN, LSTM for flood
forecasting.
 Satellite Data Integration:
o Remote sensing (e.g., Sentinel-1, MODIS) for
real-time flood mapping.
Flood Estimation
Regional Flood Estimation
Methods
When site-specific data is scarce, regional formulas are
used.
(a) Index Flood Method (IFM)
 Used in the UK’s Flood Estimation Handbook
(FEH).
 Steps:
1. Define hydrologically homogeneous regions.
2. Compute an "index flood" (e.g., mean annual
flood).
3. Derive growth factors for different return
periods.
(b) USGS Regional Regression Equations
Predict flood quantiles based on catchment area,
slope, and rainfall.
Methods Used in Bangladesh for Flood Estimation
In Bangladesh, flood estimation involves a combination of empirical, statistical, and hydrodynamic
models due to the country's complex river systems, monsoon climate, and frequent flooding. Here are the
primary methods used:
1. Rainfall-Runoff Models
a) SCS Curve Number Method (USDA-NRCS)
•Applied in small to medium catchments (e.g., haor regions, urban
areas).
•Uses soil type, land use, and rainfall data to estimate runoff.
•Popular for flash flood prediction in hilly areas (e.g., Chittagong Hill
Tracts).
b) HEC-HMS (Hydrologic Modeling System)
•Developed by the U.S. Army Corps of Engineers.
•Used by Bangladesh Water Development Board (BWDB) and research
institutes.
•Simulates river basins like the Ganges-Brahmaputra-Meghna (GBM)
system.
c) MIKE 11 NAM (Nedbør-
Afstrømnings-Model)
•A conceptual rainfall-runoff
model by DHI (Denmark).
•Used for flood forecasting in
major rivers (e.g., Brahmaputra,
Padma).
Methods Used in Bangladesh for Flood Estimation
In Bangladesh, flood estimation involves a combination of empirical, statistical, and hydrodynamic
models due to the country's complex river systems, monsoon climate, and frequent flooding. Here are the
primary methods used:
2. Hydrodynamic (River Flow) Models
a) MIKE 11 / MIKE 21 (DHI)
•1D/2D hydrodynamic models for river and floodplain
simulation.
•Used by BWDB and FFWC (Flood Forecasting and Warning
Centre).
•Predicts flood inundation in low-lying areas (e.g., Dhaka, Sylhet).
b) HEC-RAS (U.S. Army Corps of Engineers)
•Simulates river hydraulics and floodplain mapping.
•Applied in projects like Bangladesh Delta Plan 2100.
c) Delft3D (Deltares, Netherlands)
Methods Used in Bangladesh for Flood Estimation
In Bangladesh, flood estimation involves a combination of empirical, statistical, and hydrodynamic
models due to the country's complex river systems, monsoon climate, and frequent flooding. Here are the
primary methods used:
3. Statistical & Empirical Methods
a) Flood Frequency Analysis (FFA)
•Uses historical flood data (e.g., Gumbel, Log-Pearson Type III distributions).
•Applied by BWDB for design flood estimation (e.g., embankments, bridges).
b) Regional Flood Formulas
•Empirical equations based on catchment area, rainfall intensity.
•Example:
c) Monsoon Index-Based Forecasting
•Correlates monsoon rainfall patterns with flood risk.
Methods Used in Bangladesh for Flood Estimation
In Bangladesh, flood estimation involves a combination of empirical, statistical, and hydrodynamic
models due to the country's complex river systems, monsoon climate, and frequent flooding. Here are the
primary methods used:
4. Satellite & Remote Sensing Techniques
•NASA MODIS, Sentinel-1 SAR for real-time flood
mapping.
•Used by FFWC and SPARRSO (Space Research &
Remote Sensing Org.).
5. Integrated Flood Forecasting Systems
a) FFWC’s Flood Forecasting Model
•Combines HEC-HMS, MIKE 11, and satellite data.
•Provides 3-10 day flood warnings (e.g., for Jamuna,
Padma rivers).
b) Community-Based Early Warning
•Localized flood prediction using rain gauges & river
sensors.
24
24
Dams and Reservoirs
 Purpose: Store excess water during heavy
rainfall and release it gradually.
 Types:
o Storage Dams (e.g., Three Gorges Dam,
China)
o Detention Dams (temporary storage)
 Advantages:
o Provides water for irrigation and
hydropower.
o Reduces downstream flood peaks.
 Disadvantages:
o High construction cost.
o Displacement of communities.
o Environmental impact (sedimentation,
Flood Control Measures
Structural Flood Control
Measures
25
25
Flood Control Measures
Structural Flood Control
Measures
Levees (Embankments) and Floodwalls
 Purpose: Confine floodwaters within river
channels.
 Materials: Earth, concrete, or steel.
 Examples:
o Mississippi River Levees (USA)
o Netherlands’ Delta Works
 Advantages:
o Effective for urban flood protection.
 Disadvantages:
o Can fail catastrophically (e.g., Hurricane
Katrina, 2005).
o Increases water velocity downstream,
worsening erosion.
26
26
Flood Control Measures
Structural Flood Control
Measures
Channel Modification
 Methods:
o Widening & Deepening: Increases flow
capacity.
o Straightening (Channelization): Reduces
meandering.
o Lining: Concrete or riprap to prevent
erosion.
 Advantages:
o Reduces flood risk in constrained areas.
 Disadvantages:
o Destroys aquatic habitats.
o May increase downstream flooding.
27
27
Flood Control Measures
Structural Flood Control
Measures
Diversion Channels and Spillways
 Purpose: Redirect excess water to safer
areas.
 Examples:
o Morganza Spillway (USA): Diverts
Mississippi River floods.
o Koshi Barrage (Nepal/India): Controls
Himalayan river floods.
 Advantages:
o Protects critical areas (cities, farmland).
 Disadvantages:
o Requires large land areas.
o May displace communities.
28
28
Flood Control Measures
Structural Flood Control
Measures
Retention and Detention Basins
 Retention Basins: Permanent water storage (e.g., lakes).
 Detention Basins: Temporary storage during storms.
 Advantages:
o Reduces peak flows.
o Can be integrated into urban parks.
 Disadvantages:
o Requires regular maintenance.
o Mosquito breeding risk.
Stormwater Management Systems
 Components:
o Underground Tunnels (e.g., Tokyo’s Metropolitan
Area Outer Underground Discharge Channel).
o Permeable Pavements: Reduce urban runoff.
o Green Roofs: Absorb rainwater.
29
29
Flood Control Measures
Non-Structural Flood Control Measures
Floodplain Zoning and Land-Use Planning
 Methods:
o Prohibiting construction in high-risk zones.
o Elevating buildings in flood-prone areas.
 Examples:
o USA’s National Flood Insurance Program (NFIP) enforces zoning.
o Bangladesh’s Flood Action Plan restricts settlements in vulnerable
areas.
Flood Forecasting and Early Warning Systems
 Technologies Used:
o Real-time river gauges.
o Satellite monitoring (NASA, ESA).
o AI-based flood prediction models.
 Examples:
o India’s Central Water Commission (CWC) Flood Alerts.
o European Flood Awareness System (EFAS).
30
30
Flood Control Measures
Non-Structural Flood Control Measures
Watershed Management
 Methods:
o Afforestation: Slows runoff.
o Check Dams: Reduce soil erosion.
o Terracing: Controls hill slope runoff.
Flood Insurance and Financial Measures
 Purpose: Compensate victims and
incentivize risk reduction.
Community-Based Flood Preparedness
 Strategies:
o Evacuation drills.
o Flood shelters (e.g., Bangladesh’s
raised cyclone shelters).
o Public awareness campaigns.
 Examples:
o China’s "Sponge City" Initiative.
o Japan’s Forest Conservation
Policies.
 Examples:
o USA’s NFIP.
o UK’s Flood Re Insurance Scheme.
31
31
Flood Control Measures
Innovative and Nature-Based Solutions
Green Infrastructure
 Examples:
o Wetland Restoration (natural sponges).
o Bioswales (vegetated drainage channels).
 Advantages:
o Improves water quality.
o Enhances biodiversity.
Floating Houses and Amphibious Architecture
 Examples:
o Netherlands’ Floating Neighborhoods.
o Thailand’s Amphibious Homes.
Smart Flood Control Technologies
 IoT-Based Sensors: Monitor water levels in real-time.
 Automated Barriers: Deployable floodgates (e.g., Venice’s MOSE
Project).
Neal Creative ©
Thank You!
M d . I n z a m u l H a q u e
m i h a q u e . i u @ g m a i l . c o
m
Neal Creative | click & Learn more

Flood Estimation and Control Measures.pptx

  • 1.
  • 2.
    Introduction Floods are amongthe most devastating natural disasters, causing significant loss of life, property damage, and environmental degradation. Flood estimation and control measures are essential for mitigating these risks and ensuring sustainable water management. This assignment explores flood estimation methods, factors influencing flood occurrence, and various structural and non-structural flood control measures.
  • 3.
    Flood Estimation Floodestimation is a critical aspect of hydrological engineering, helping predict flood magnitudes, frequencies, and potential impacts. Various methods are employed depending on data availability, catchment characteristics, and required accuracy. Below is an in-depth discussion of flood estimation techniques. 1. Empirical Methods Empirical methods use simplified equations based on historical data and regional characteristics. They are useful when detailed hydrological data is unavailable. (a) Rational Method (b) Dickens Formula (1865) (c) Ryves Formula (1884) (d) Inglis Formula (1930) (e) Fuller’s Formula (1914) Empirical Methods
  • 4.
    Flood Estimation (a) RationalMethod The Rational Method is one of the simplest and most widely used techniques for estimating peak flood discharge in small to medium-sized catchments. It is commonly applied in urban hydrology and for designing drainage systems, culverts, and small bridges. Key Formula: The peak discharge (Qp​ ) is calculated as: Rational Methods Steps in the Rational Method: 1. Determine the Runoff Coefficient (C)  Represents the fraction of rainfall that becomes surface runoff.  Depends on land use, soil type, slope, and antecedent moisture conditions.  Examples: o Paved areas: C=0.8 0.95 − C=0.8 0.95 − o Grass/lawns: C=0.1 0.3 − C=0.1 0.3 − o Forested areas: C=0.05 0.2 − C=0.05 0.2 −  For mixed land uses, compute a weighted average:
  • 5.
    Flood Estimation 2. Determinethe Time of Concentration (tc​ )  Time for water to travel from the farthest point in the catchment to the outlet.  Common empirical formulas: Rational Method 3. Estimate Rainfall Intensity (I)  Use Intensity-Duration-Frequency (IDF) curves for the location.  Select intensity corresponding to: o Duration = tc o Design return period (e.g., 10-year, 50-year storm). 4. Calculate Peak Discharge (Qp​ )  Apply the Rational Formula: Qp=C⋅I⋅A  Ensure consistent units: o If A is in km² and I in mm/hr, then Qp​is in m³/s. o If A is in acres and II in in/hr, then Qp​is in ft³/s.
  • 6.
    Flood Estimation Dickens Formula(1865) The Dickens Formula is an empirical method used for flood estimation, particularly in regions where detailed hydrological data is scarce. It is commonly applied in India and other parts of South Asia for estimating peak flood discharge in medium to large catchments. Key Components: 1. Dickens Coefficient (CD​ )  An empirical constant that depends on: o Regional rainfall characteristics o Catchment topography (hilly vs. flat) o Soil type & land use  Typical values: o North India: 6–30 o Central India: 11–14 o South India: 14–28 o Hilly regions: Up to 35  Higher values indicate higher flood potential. 2. Exponent (n)  Usually taken as 0.75 (based on historical data).  Some variations use 0.67 to 0.80 depending on basin characteristics.
  • 7.
    Flood Estimation Dickens Formula(1865) Assumptions & Limitations: ✔ Simple and quick for preliminary estimates. ✔ Useful in data-scarce regions. ✔ Best suited for medium to large catchments (50–5,000 km²). ❌ Highly empirical—accuracy depends on correct CD​ . ❌ Does not account for rainfall distribution or storm duration. ❌ Not suitable for small catchments (use Rational Method instead). ❌ Less accurate than modern methods (e.g., Unit Hydrograph, HEC-HMS). Steps to Apply the Dickens Formula: 1. Determine the catchment area (A) in km². 2. Select an appropriate CD​based on regional guidelines. 3. Compute peak discharge using: Qp=CD⋅A0.75 4. Adjust for extreme cases (e.g., steep slopes → higher CD).
  • 8.
    Flood Estimation Ryves Formula(1884) The Ryves Formula is an empirical flood estimation method commonly used in South India (especially Tamil Nadu and Karnataka) to predict peak flood discharge in medium to large catchments. It is similar to the Dickens Formula but uses different regional coefficients. Formula: Key Components 1. Ryves Coefficient (CR​ )  Depends on regional rainfall patterns and catchment characteristics.  Typical values: Region CR Plains (low flood risk) 6.8 Average Indian catchments 8.5 – 10.0 Hilly areas (high rainfall) 10.2 – 12.0 Coastal regions (extreme rainfall) Up to 13.5 2. Catchment Area (A)  Should be in square kilometers (km²).
  • 9.
    Flood Estimation Ryves Formula(1884) Steps to Apply Ryves Formula 1. Determine the catchment area (AA) from maps or surveys. 2. Select the appropriate CRCR​based on location and flood risk. 3. Calculate peak discharge using: Assumptions & Limitations- • Simple and quick for preliminary flood estimation. • Useful in data-scarce regions (especially South India). • Best for medium to large catchments (50–5,000 km²) • Highly empirical—accuracy depends on correct CRCR​ . Does not consider rainfall intensity or duration. • Not suitable for small catchments (use Rational Method instead). • Less accurate than modern methods (e.g., Unit Hydrograph, HEC-HMS).
  • 10.
    Flood Estimation Inglis Formula(1930) The Inglis Formula is an empirical flood estimation method primarily used in Western India (particularly Maharashtra) for predicting peak flood discharge in medium to large catchments. It is derived from regional flood data and is best suited for peninsular Indian rivers. Key Features 1. Developed for Indian catchments, particularly the Deccan Plateau. 2. Works best for medium to large basins (100– 5,000 km²). 3. Does not require rainfall data—purely area- based. Steps to Apply Inglis Method 4. Determine the catchment area (A) from topo maps or GIS. 5. Plug into Inglis Formula to get Qp​ . Assumptions & Limitations ✔ Simple and quick for preliminary estimates. ✔ No rainfall data needed—uses only catchment area. ❌ Region-specific—less accurate outside Western India. ❌ Does not account for rainfall intensity, slope, or soil type. ❌ Not suitable for small catchments (<100 km²).
  • 11.
    Flood Estimation Inglis Formula(1930) The Inglis Formula is an empirical flood estimation method primarily used in Western India (particularly Maharashtra) for predicting peak flood discharge in medium to large catchments. It is derived from regional flood data and is best suited for peninsular Indian rivers. Key Features 1. Developed for Indian catchments, particularly the Deccan Plateau. 2. Works best for medium to large basins (100– 5,000 km²). 3. Does not require rainfall data—purely area- based. Steps to Apply Inglis Method 4. Determine the catchment area (A) from topo maps or GIS. 5. Plug into Inglis Formula to get Qp​ . Assumptions & Limitations ✔ Simple and quick for preliminary estimates. ✔ No rainfall data needed—uses only catchment area. ❌ Region-specific—less accurate outside Western India. ❌ Does not account for rainfall intensity, slope, or soil type. ❌ Not suitable for small catchments (<100 km²).
  • 12.
    Flood Estimation Fuller’s Formula (1914) Fuller’sFormula is an empirical flood estimation method used to predict peak flood discharge based on historical data and catchment characteristics. It is particularly useful for medium to large catchments where long-term flood records are available. Key Components 1. Fuller’s Coefficient (CF)  An empirical constant that varies with climate, topography, and soil type.  Typical values: o Temperate regions: CF=0.5 1.5 − o Tropical high-rainfall zones: CF=1.5 3.0 − o Arid regions: CF=0.3 0.8 − 2. Catchment Area (A)  Must be in consistent units (km² or mi²). 3. Return Period (T)  The average time interval between flood events of a given magnitude (e.g., 10, 25, 50, 100 years).
  • 13.
    Flood Estimation Fuller’s Formula (1914) Stepsto Apply Fuller’s Method 1. Determine the catchment area (A) from maps or surveys. 2. Select an appropriate CF​based on regional data. 3. Choose the design return period (T) (e.g., 25 years for small bridges, 100 years for dams). 4. Calculate peak discharge (Qp​ ) using the formula. Assumptions & Limitations ✔ Accounts for return period, making it useful for risk-based design. ✔ Works well for medium to large basins (50–10,000 km²). ✔ Better than purely regional formulas (e.g., Dickens, Ryves) when long-term data exists. ❌ Requires historical flood data for calibration. ❌ Not suitable for small urban catchments (use Rational Method instead). ❌ Does not consider storm duration or rainfall intensity explicitly.
  • 14.
    Flood Estimation Modified EmpiricalFormula SCS Curve Number Method (USDA, 1954) The Soil Conservation Service (SCS) Curve Number (CN) Method is a widely used empirical technique for estimating direct runoff or flood hydrographs from rainfall events, particularly in ungauged watersheds. Developed by the U.S. Department of Agriculture (USDA) Soil Conservation Service (now NRCS), it is based on soil type, land use, and antecedent moisture conditions. Key Concepts of the SCS-CN Method
  • 15.
    Flood Estimation Steps toApply the SCS-CN Method 1.Determine the Curve Number (CN): 1. Select CN based on: 1.Soil Group (A: High infiltration D: Low → infiltration). 2.Land Use/Land Cover (e.g., agriculture, urban, forest). 3.Antecedent Moisture Condition (AMC): 1. AMC I (Dry), AMC II (Average), AMC III (Wet). Standard tables provide CN values for different conditions (e.g., NRCS TR-55 manual). 2. Compute SS: 1. Use the CN to calculate SS (in mm or inches). 3. Calculate Runoff (QQ): 2. Plug PP (rainfall) and SS into the runoff equation. 4. Peak Discharge Estimation (Optional): 3. Combine with the SCS Unit Hydrograph method to estimate flood hydrographs. Limitations of the SCS-CN Method •Empirical: May not perform well in all regions (calibration needed). •Assumes uniform rainfall: Does not account for spatial variability. •Neglects time dynamics: Better for small to medium watersheds (< 250 km²). •Sensitive to CN selection: Errors in CN lead to large runoff errors. Modified Empirical Formula SCS Curve Number Method (USDA, 1954)
  • 16.
    Flood Estimation Unit Hydrograph Theory Developedby Sherman (1932), the Unit Hydrograph (UH) method predicts flood hydrographs based on rainfall-runoff relationships. (a) Assumptions 1. Uniform rainfall distribution over the catchment. 2. Constant duration of effective rainfall. 3. Linear response (i.e., superposition and proportionality apply). (b) Steps in Unit Hydrograph Derivation 4. Select a storm event with known rainfall and runoff data. 5. Separate baseflow from direct runoff. 6. Compute excess rainfall (total rainfall minus losses like infiltration). 7. Derive the UH by dividing direct runoff by excess rainfall depth. (c) Application  Synthetic Unit Hydrograph (SUH): Used when observed data is unavailable. Common methods include: o Snyder’s Method (USA) o SCS Dimensionless UH o GIUH (Geomorphological Instantaneous Unit Hydrograph) (d) Limitations  Requires historical rainfall-runoff data.  Assumes linearity, which may not hold for extreme events.
  • 17.
    Flood Estimation Flood Frequency Analysis Statisticalmethods estimate flood magnitudes for different return periods (e.g., 50-year, 100-year floods). (a) Probability Distributions Used Distribution Application Gumbel’s Extreme Value Widely used for flood frequency analysis Log-Pearson Type III Recommended by U.S. agencies (USGS, NOAA) Normal Distribution Rarely used due to skewness in flood data (b) Steps in Flood Frequency Analysis 1.Data Collection: Annual maximum flood peaks. 2.Ranking: Arrange data in descending order. 3.Plotting Positions: Use Weibull’s formula: 4. Fit a Distribution: Using method of moments or maximum likelihood. (c) Example (Gumbel’s Method)
  • 18.
    Flood Estimation Hydrological andHydraulic Models Computer-based models simulate rainfall-runoff processes for accurate flood prediction. (a) HEC-HMS (Hydrologic Modeling System)  Developed by the U.S. Army Corps of Engineers.  Simulates watershed hydrology using: o SCS Curve Number for infiltration. o Muskingum method for channel routing. o Unit Hydrograph for runoff transformation. (b) MIKE SHE  A comprehensive physically-based model integrating: o Overland flow o Channel flow o Groundwater interactions (c) SWMM (Storm Water Management Model)  Used for urban flood modeling.  Simulates drainage systems, detention basins, and pipe networks. (d) Artificial Intelligence (AI) in Flood Estimation  Machine Learning Models: o Random Forest, ANN, LSTM for flood forecasting.  Satellite Data Integration: o Remote sensing (e.g., Sentinel-1, MODIS) for real-time flood mapping.
  • 19.
    Flood Estimation Regional FloodEstimation Methods When site-specific data is scarce, regional formulas are used. (a) Index Flood Method (IFM)  Used in the UK’s Flood Estimation Handbook (FEH).  Steps: 1. Define hydrologically homogeneous regions. 2. Compute an "index flood" (e.g., mean annual flood). 3. Derive growth factors for different return periods. (b) USGS Regional Regression Equations Predict flood quantiles based on catchment area, slope, and rainfall.
  • 20.
    Methods Used inBangladesh for Flood Estimation In Bangladesh, flood estimation involves a combination of empirical, statistical, and hydrodynamic models due to the country's complex river systems, monsoon climate, and frequent flooding. Here are the primary methods used: 1. Rainfall-Runoff Models a) SCS Curve Number Method (USDA-NRCS) •Applied in small to medium catchments (e.g., haor regions, urban areas). •Uses soil type, land use, and rainfall data to estimate runoff. •Popular for flash flood prediction in hilly areas (e.g., Chittagong Hill Tracts). b) HEC-HMS (Hydrologic Modeling System) •Developed by the U.S. Army Corps of Engineers. •Used by Bangladesh Water Development Board (BWDB) and research institutes. •Simulates river basins like the Ganges-Brahmaputra-Meghna (GBM) system. c) MIKE 11 NAM (Nedbør- Afstrømnings-Model) •A conceptual rainfall-runoff model by DHI (Denmark). •Used for flood forecasting in major rivers (e.g., Brahmaputra, Padma).
  • 21.
    Methods Used inBangladesh for Flood Estimation In Bangladesh, flood estimation involves a combination of empirical, statistical, and hydrodynamic models due to the country's complex river systems, monsoon climate, and frequent flooding. Here are the primary methods used: 2. Hydrodynamic (River Flow) Models a) MIKE 11 / MIKE 21 (DHI) •1D/2D hydrodynamic models for river and floodplain simulation. •Used by BWDB and FFWC (Flood Forecasting and Warning Centre). •Predicts flood inundation in low-lying areas (e.g., Dhaka, Sylhet). b) HEC-RAS (U.S. Army Corps of Engineers) •Simulates river hydraulics and floodplain mapping. •Applied in projects like Bangladesh Delta Plan 2100. c) Delft3D (Deltares, Netherlands)
  • 22.
    Methods Used inBangladesh for Flood Estimation In Bangladesh, flood estimation involves a combination of empirical, statistical, and hydrodynamic models due to the country's complex river systems, monsoon climate, and frequent flooding. Here are the primary methods used: 3. Statistical & Empirical Methods a) Flood Frequency Analysis (FFA) •Uses historical flood data (e.g., Gumbel, Log-Pearson Type III distributions). •Applied by BWDB for design flood estimation (e.g., embankments, bridges). b) Regional Flood Formulas •Empirical equations based on catchment area, rainfall intensity. •Example: c) Monsoon Index-Based Forecasting •Correlates monsoon rainfall patterns with flood risk.
  • 23.
    Methods Used inBangladesh for Flood Estimation In Bangladesh, flood estimation involves a combination of empirical, statistical, and hydrodynamic models due to the country's complex river systems, monsoon climate, and frequent flooding. Here are the primary methods used: 4. Satellite & Remote Sensing Techniques •NASA MODIS, Sentinel-1 SAR for real-time flood mapping. •Used by FFWC and SPARRSO (Space Research & Remote Sensing Org.). 5. Integrated Flood Forecasting Systems a) FFWC’s Flood Forecasting Model •Combines HEC-HMS, MIKE 11, and satellite data. •Provides 3-10 day flood warnings (e.g., for Jamuna, Padma rivers). b) Community-Based Early Warning •Localized flood prediction using rain gauges & river sensors.
  • 24.
    24 24 Dams and Reservoirs Purpose: Store excess water during heavy rainfall and release it gradually.  Types: o Storage Dams (e.g., Three Gorges Dam, China) o Detention Dams (temporary storage)  Advantages: o Provides water for irrigation and hydropower. o Reduces downstream flood peaks.  Disadvantages: o High construction cost. o Displacement of communities. o Environmental impact (sedimentation, Flood Control Measures Structural Flood Control Measures
  • 25.
    25 25 Flood Control Measures StructuralFlood Control Measures Levees (Embankments) and Floodwalls  Purpose: Confine floodwaters within river channels.  Materials: Earth, concrete, or steel.  Examples: o Mississippi River Levees (USA) o Netherlands’ Delta Works  Advantages: o Effective for urban flood protection.  Disadvantages: o Can fail catastrophically (e.g., Hurricane Katrina, 2005). o Increases water velocity downstream, worsening erosion.
  • 26.
    26 26 Flood Control Measures StructuralFlood Control Measures Channel Modification  Methods: o Widening & Deepening: Increases flow capacity. o Straightening (Channelization): Reduces meandering. o Lining: Concrete or riprap to prevent erosion.  Advantages: o Reduces flood risk in constrained areas.  Disadvantages: o Destroys aquatic habitats. o May increase downstream flooding.
  • 27.
    27 27 Flood Control Measures StructuralFlood Control Measures Diversion Channels and Spillways  Purpose: Redirect excess water to safer areas.  Examples: o Morganza Spillway (USA): Diverts Mississippi River floods. o Koshi Barrage (Nepal/India): Controls Himalayan river floods.  Advantages: o Protects critical areas (cities, farmland).  Disadvantages: o Requires large land areas. o May displace communities.
  • 28.
    28 28 Flood Control Measures StructuralFlood Control Measures Retention and Detention Basins  Retention Basins: Permanent water storage (e.g., lakes).  Detention Basins: Temporary storage during storms.  Advantages: o Reduces peak flows. o Can be integrated into urban parks.  Disadvantages: o Requires regular maintenance. o Mosquito breeding risk. Stormwater Management Systems  Components: o Underground Tunnels (e.g., Tokyo’s Metropolitan Area Outer Underground Discharge Channel). o Permeable Pavements: Reduce urban runoff. o Green Roofs: Absorb rainwater.
  • 29.
    29 29 Flood Control Measures Non-StructuralFlood Control Measures Floodplain Zoning and Land-Use Planning  Methods: o Prohibiting construction in high-risk zones. o Elevating buildings in flood-prone areas.  Examples: o USA’s National Flood Insurance Program (NFIP) enforces zoning. o Bangladesh’s Flood Action Plan restricts settlements in vulnerable areas. Flood Forecasting and Early Warning Systems  Technologies Used: o Real-time river gauges. o Satellite monitoring (NASA, ESA). o AI-based flood prediction models.  Examples: o India’s Central Water Commission (CWC) Flood Alerts. o European Flood Awareness System (EFAS).
  • 30.
    30 30 Flood Control Measures Non-StructuralFlood Control Measures Watershed Management  Methods: o Afforestation: Slows runoff. o Check Dams: Reduce soil erosion. o Terracing: Controls hill slope runoff. Flood Insurance and Financial Measures  Purpose: Compensate victims and incentivize risk reduction. Community-Based Flood Preparedness  Strategies: o Evacuation drills. o Flood shelters (e.g., Bangladesh’s raised cyclone shelters). o Public awareness campaigns.  Examples: o China’s "Sponge City" Initiative. o Japan’s Forest Conservation Policies.  Examples: o USA’s NFIP. o UK’s Flood Re Insurance Scheme.
  • 31.
    31 31 Flood Control Measures Innovativeand Nature-Based Solutions Green Infrastructure  Examples: o Wetland Restoration (natural sponges). o Bioswales (vegetated drainage channels).  Advantages: o Improves water quality. o Enhances biodiversity. Floating Houses and Amphibious Architecture  Examples: o Netherlands’ Floating Neighborhoods. o Thailand’s Amphibious Homes. Smart Flood Control Technologies  IoT-Based Sensors: Monitor water levels in real-time.  Automated Barriers: Deployable floodgates (e.g., Venice’s MOSE Project).
  • 32.
    Neal Creative © ThankYou! M d . I n z a m u l H a q u e m i h a q u e . i u @ g m a i l . c o m Neal Creative | click & Learn more