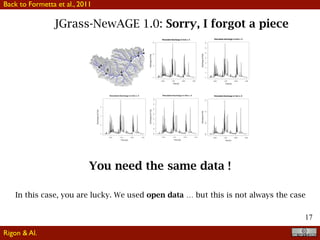
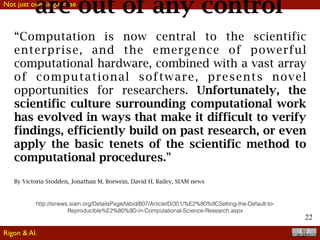
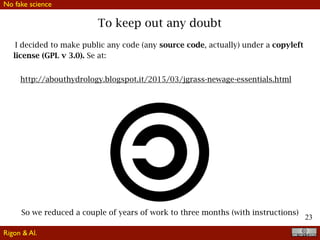
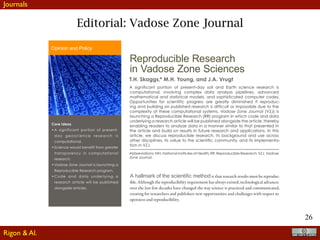
Almost the same as the talk given to Ph.D. students one year ago. It covers the problem of research reproducibility and the tools for doing it. First comes some "theoretical" arguments, then the enumeration of some tools.
The document summarizes the key points of a PhD dissertation on catchment transport and travel time distributions. It presents (1) the development of a unified theory of water age and life expectancy distributions, (2) how age mixing occurs in advection-dispersion systems, and (3) applications of these concepts to model conservative and non-conservative solute transport in three catchments. The dissertation advances understanding of catchment functioning through the use of time-variant age distributions to simulate reactive transport processes.
A travel time model for estimating the water budget of complex catchmentsRiccardo Rigon
This is the presentation given by Marialaura Bancheri for her admission to the final exam to achieve a Ph.D. in Environmental Engineering. It contains a synthesis of her studies about spatially integrated models of the water budget, and about travel time theory. A model structure is also presented preliminarily containing five reservoirs.
This document discusses storage selection functions (SAS) as a tool for characterizing dispersion processes and solute transport at the catchment scale. SAS functions link the age distributions of water stored in a catchment to the age distributions exported from the catchment. They can be used to derive travel time distributions and model concentrations of conservative solutes. The formulation incorporates temporal variability in hydrologic fluxes and can represent spatial heterogeneity through distinct SAS functions for different catchment units. Case studies demonstrate how SAS functions capture catchment-scale age selection dynamics and can reproduce observed solute concentrations in streams.
- Abiotic controls, like precipitation and evaporation, dominate soil moisture spatiotemporal variability in wet climates, while biotic controls from vegetation become more important in Mediterranean climates.
- The relationship between the coefficient of variation (Cv) and mean soil moisture (Θ) was found to be unique and well described by an exponential or linear function for locations in Switzerland, but strong hysteretic cycles were observed for Mediterranean locations.
- Heterogeneity in soil properties increases Cv and tends to obscure any hysteresis, masking climatic and biotic controls on soil moisture variability. Heterogeneity can therefore hide the influences of climate and vegetation on soil moisture spatiotemporal patterns.
This document discusses preparatory work for coupling reactive solute transport modeling with flow modeling in the Cathy model. The objectives are to develop a 3D coupled surface and subsurface flow and reactive solute transport model based on Cathy, validate it using field data from two hillslopes in France, and upscale the model from hillslope to catchment scale. An existing subsurface flow model (Cathy) and solute transport model (Tran3d) will be merged to allow modeling of non-steady state cases. The merged model will be validated using two test cases from literature and applied to a site in Beaujolais, France.
This document describes a numerical study of flow and energy dissipation in stepped spillways using the FLUENT software. Two stepped spillway models with 5 and 10 steps were analyzed for different flow rates. The k-ε turbulence model and volume of fluid method were used to model turbulence and free surface flow. Numerical results for flow patterns, velocities, and energy dissipation were compared to experimental data from other studies, showing good agreement with errors less than 2%. The results indicate that increasing the flow rate or number of steps reduces energy dissipation, while decreasing step height or length also reduces dissipation.
This document summarizes work on developing an integrated surface-subsurface hydrological model using a Darcy multi-domain approach. It describes the model, its validation using benchmark problems, and participation in an international model intercomparison project. The integrated model couples surface and subsurface flows using a single pressure head equation. It was able to successfully simulate several benchmark problems, including a superslab test case with heterogeneous soils, though very small grid cells and many iterations were required.
Two concurring hydrological models (M1 and M2) that performed equally well when calibrated using only streamflow data showed important differences when microgravity data was added. The shape of the Pareto fronts obtained from multi-objective calibration using both streamflow and microgravity data provided useful insights to identify model limitations and indicated the value of including geophysical data to better constrain the inversion procedure. Time-lapse, relative microgravity surveys conducted over multiple field campaigns in the Vermigliana catchment in the Italian Alps allowed obtaining spatially distributed estimates of subsurface water storage changes to inform hydrological modeling.
GroundWater Age and Large Scale Mixing, Cargese 2015, JR de Dreuzyjrdreuzy
Cargese Summer School on Flow and Transport in Porous and Fractured Media, Development, Protection, Management and Sequestration of Subsurface Fluids, July 20th - August 1st 2015
Greetings all,
This month’s newsletter is devoted to data assimilation and its application to Ocean Reanalyses.
Brasseur is introducing this newsletter telling us about the history of Ocean Reanalyses, the need for such Reanalyses for
MyOcean users in particular, and the perspective of Ocean Reanalyses coupled with biogeochemistry or regional systems for
example.
Scientific articles about Ocean Reanalyses activities are then displayed as follows: First, Cabanes et al. are presenting CORA, a
new comprehensive and qualified ocean in-situ dataset from 1990 to 2008, developped at the Coriolis Data Centre at IFREMER
and used to build Ocean Reanalyses. A more comprehensive article will be devoted to the CORA dataset in our next April 2010
issue. Then, Remy at Mercator in Toulouse considers large scale decadal Ocean Reanalysis to assess the improvement due to
the variational method data assimilation and show the sensitivity of the estimate to different parameters. She uses a light
configuration system allowing running several long term reanalysis. Third, Ferry et al. present the French Global Ocean
Reanalysis (GLORYS) project which aims at producing eddy resolving global Ocean Reanalyses with different streams spanning different time periods and using different technical choices. This is a collaboration between Mercator and French research
laboratories, and is a contribution to the European MyOcean project. Then, Masina et al. at CMCC in Italy are presenting the
implementation of data assimilation techniques into global ocean circulation model in order to investigate the role of the ocean on
climate variability and predictability. Fifth, Smith et al. are presenting the Ocean Reanalyses studies at ESSC in the U.K. which
aim at reconstructing water masses variability and ocean transports. Finally, Langlais et al. are giving an example of the various
uses of ocean reanalyses: they are using the Australian BlueLink Reanalysis in order to look into details at the various Southern
Ocean fronts.
The next April 2010 newsletter will introduce a new editorial line with a common newsletter between the Mercator
Ocean Forecasting Center in Toulouse and the Coriolis Data Center at Ifremer in Brest. Some papers will be
dedicated to observations only, when others will display collaborations between the 2 aspects: Observations and
Model. The idea is to wider and complete the subjects treated in our newsletter, as well as to trigger interactions
between observations and modeling communities. This common Mercator-Coriolis Newsletter is a test for which
we will take the opportunity to ask for your feedback.
We wish you a pleasant reading!
The concepts related of the New Model of River Adige, and especially an analysys of the existing OMS components ready and their interpretation on the basis of travel time approaches
This document provides an overview of a project studying the effects of subsurface heterogeneity at hillslope scales using the Parflow modeling system. It discusses motivations to better understand upscaling rules when applying distributed hydrological models with heterogeneous parameters. Initial tests are presented examining the impact of soil property variability on soil moisture and discharge dynamics for flat fields and hillslopes. Preliminary results show that state dynamics are well represented by homogeneous models, but heterogeneity increases non-equilibrium and impacts could depend on the ergodic or non-ergodic nature of the domain. Further work is planned to generalize the tests and analyze coarsening effects at the catchment scale.
This document summarizes geomorphological aspects of hydrological modeling from 1979 to the present. It discusses how geomorphological information has been incorporated into hydrological models over time. In the 1980s, the availability of digital elevation models allowed for isochrones and width functions to be derived from digital data. This provided a finer representation of geomorphology. In the following decades, models incorporated more geomorphological details like separating hillslope and channel flow velocities. Overall, incorporating geomorphological details improved the ability of models to predict rainfall-runoff responses and event hydrographs.
New Approach of Prediction of Sidoarjo Hot Mudflow Disastered Area Based on P...Waqas Tariq
A new approach of prediction of Sidoarjo hot mudflow disastered area based on cellular automata with probabilistic adjustment for minimizing prediction errors is proposed. Sidoarjo hot mudflow has specific characteristics such as plane and complex area, huge mud plumes, high viscosity and surface temperature changes, so that it needs combined approaches of slow debris flow, and material changes caused by viscous fluid and thermal changes. Some deterministic approaches can not show the high state changes. This paper presents a new approach of cellular automata using probabilistic state changing to simulate hot mudflow spreading. The model was calibrated with the time series of topological maps. The experimental results show new inundated areas that are identified as high risk areas where are covered by mud. It is also show that the proposed probabilistic cellular automata approach works well for prediction of hot mudflow spreading areas much accurate than the existing conventional methods.
Evaluation of Standar & Regional Satellite Chlorophyll-a Algorithms for MODIS...Anisa Aulia Sabilah
Review Jurnal Penginderaan Jauh Sinar Tampak "Evaluation of Standar & Regional Satellite Chlorophyll-a Algorithms for MODIS in the Bohai & Yellow Seas, China" oleh Wang et al. (2019)
DSD-INT 2017 The unsaturated zone MetaSWAP-package, recent developments - Van...Deltares
The document describes the MetaSWAP package, a method for simulating unsaturated zone processes in MODFLOW. MetaSWAP uses pre-generated steady-state soil moisture profiles to calculate water balances with computational boxes. This allows faster simulation than Richards equation models like SWAP. The document discusses coupling MetaSWAP to MODFLOW, the salinity model TRANSOL, and the crop model WOFOST. MetaSWAP is shown to simulate unsaturated zone flow and transport processes 10-50 times faster than SWAP with stable coupling to MODFLOW.
Pore scale dynamics and the interpretation of flow processes - Martin Blunt, Imperial College London, at UKCCSRC specialist meeting Flow and Transport for CO2 Storage, 29-30 October 2015
This document summarizes a study that used a numerical model to predict sediment transport processes in the Nzoia River in Kenya. The model calculates bed load and suspended sediment transport rates along the river channel and determines changes in river bed elevation and particle size distribution of bed material. The model was applied to three gauging stations on the Nzoia River. Results showed bed aggradation occurred continuously downstream, with particles becoming finer. Field data is still needed to validate the model results.
IRJET- A Review of Synthetic Hydrograph Methods for Design StormIRJET Journal
This document reviews various synthetic unit hydrograph methods for modeling runoff from design storms in ungauged or data-limited watersheds. It groups the methods into four categories: traditional empirical methods, conceptual methods, probabilistic methods, and geomorphological methods. The document then describes several traditional methods in detail, including the Snyder, Mitchell, Commons, SCS, and Taylor-Schwarz methods. It discusses how these methods relate key watershed characteristics like area, channel length, and slope to unit hydrograph parameters like peak discharge and time to peak. Finally, it introduces some conceptual hydrologic models that have been adapted as synthetic unit hydrograph methods.
flow_through_linear_weir in analysis of the huamrajak
1) The document discusses a numerical study using computational fluid dynamics (CFD) to simulate flow over a linear weir.
2) The CFD simulation results for head-discharge relationships and flow patterns are compared to experimental data from literature and show close agreement.
3) The maximum error between the CFD and experimental results for discharge is within 3% indicating CFD can accurately predict flows over hydraulic structures like weirs.
Advances in Rock Physics Modelling and Improved Estimation of CO2 Saturation, Giorgos Papageorgiou - Geophysical Modelling for CO2 Storage, Leeds, 3 November 2015
Pre-Injection Assessment of Time-Lapse Seismic Repeatability at the Aquistore CO2 Storage Site - presentation by Lisa Roach of the University of Leeds at the UKCCSRC meeting Monitoring of the deep subsurface: leakage pathways – understanding and monitoring the mechanics of CO2 storage, 23 October 2014
This is a presentation of the JGrass-newAGE system held in Potenza on February 24 20117. It contains an overview of concepts, ideas, behing JGrass-NewAGE ans shows some achievements in a critical manner.
1) The atmosphere is not a perfect absorber of radiation like a blackbody, but rather a "gray body" that absorbs some but not all radiation.
2) Radiation passes through the Earth's atmosphere, with 45-50% of incident radiation reaching the ground. Some radiation is reflected and scattered by the atmosphere.
3) Shortwave radiation that enters the atmosphere is transferred to the ground through reflection, absorption, and transmission. The incoming and outgoing radiation must be in balance.
The document provides an introduction to geographic information systems (GIS) and land information systems. It defines GIS as a set of tools for collecting, modeling, manipulating, analyzing and presenting spatially referenced data. GIS allows for the overlay of different data layers to gain a better understanding of the factors that characterize an area. The document discusses the history of GIS, its components and functions, as well as how it represents spatial data through raster files, vector files, and other methods.
The document compares the use of artificial neural networks (ANNs) and model trees (MTs) for rainfall-runoff modelling. It tests these techniques on a European catchment to predict runoff 1, 3, and 6 hours ahead. The results show that both ANNs and MTs produced excellent results for 1-hour ahead prediction, acceptable results for 3-hour prediction, and conditional acceptable results for 6-hour prediction. While the performance of ANNs and MTs was similar for 1-hour predictions, ANNs performed slightly better for longer lead times. However, MTs have the advantage of producing more understandable and adjustable models of varying complexity and accuracy.
This document describes a dissertation on model-data integration for predictive assessment of groundwater reactive transport systems. Specifically, it develops reactive transport models to predict groundwater contamination at a field site where a permeable reactive barrier (PRB) using zero-valent iron is installed. Key challenges addressed include quantifying and reducing conceptual model uncertainty, integrating different types of field data using multivariate methods, and characterizing spatial heterogeneity to estimate model parameters from field measurements.
This document summarizes a study analyzing groundwater flow in the Jakkur catchment area of Bangalore, India using the Visual MODFLOW software. The study area was conceptualized as having two layers - an upper weathered and fractured layer and a lower fractured hard rock layer. Field data on open wells and borewells in the area was collected. A numerical groundwater model was developed in Visual MODFLOW using a 1km by 1km grid. The model was run in steady state and transient conditions and calibrated by adjusting hydraulic conductivity values. Sample results showed calculated heads matched observed heads in 50-60% of wells. The zone budget analysis indicated decreasing groundwater availability over time. The modeling helped quantify inputs, outputs
article multidimensionnal modeling and analysis .pdfrachidaerrahli2
This paper presents an OLAP-based solution for multidimensional modeling and analysis of large watercourse data. The solution includes two data cubes for physicochemical and hydrobiological water quality data, an ETL tool for data integration from various sources, and OLAP tools for exploration. It extends an existing framework to define complex analysis indicators using complex aggregate functions. This allows calculation of indicators and additional analysis dimensions to address heterogeneous measurement units. The system provides water quality practitioners efficient analysis capabilities like thematic, temporal, spatial, and multiscale exploration to help understand watercourse functioning under the Water Framework Directive.
Design , Analysis And Manufacturing of Garbage compactor - a Reviewijiert bestjournal
The collection of waste is vital work that ensures our communities remain pleasant environments in which to live. But major problem we are facing today is transportation of the waste which can be reduced by compacting or reducing size of particular waste. A compactor can be used to reduce the volume of waste streams. The waste weight will remain the same so there will be no savings from the total amount of waste produced. However,savings will occur because waste volume will be reduced by approximately 80% which will decr ease the number of times the dumpster will need to be emptied,therefore resulting in lower pick up fees..
Mesoscopic simulation of incompressible fluid flow in porous mediaeSAT Journals
Abstract
Lattice Boltzmann method is used to simulate cavity driven fluid flow in porous media. A square cavity is considered with the top
lid moving with uniform velocity and other sides kept stationary. Simulation is carried out for values of Darcy number ranging
from 10-6 to10-2 at Reynolds number 10 and 100. Influence of Darcy number and Reynolds number is investigated on velocity
profiles and the streamline plots. Half-way bounce back boundary conditions are employed in the numerical simulation. The
numerical code is first verified with the results available in the literature and then used to simulate the Newtonian fluid flow in
porous media. The Darcy number and the Reynolds number were observed to have great influence on the flow properties and the
location of the primary vortex. Simulation was carried out for a 100100 mesh grid and a fine agreement is established theories
in incompressible fluid flow.
Keywords: Lattice Boltzmann method, incompressible flow, porous media
The document compares the use of artificial neural networks and sediment rating curve models for estimating suspended sediment in the Lokapavani River basin in India. It finds that an artificial neural network using multilayer perceptron with water discharge, accumulated discharge, and accumulated rainfall as inputs achieved an R2 value of 0.88 for estimating suspended sediment, outperforming a sediment rating curve model which achieved an R2 of 0.846. However, the artificial neural network was not as accurate at estimating peak sediment values. Overall, the study found artificial neural networks to be an acceptable method for suspended sediment estimation in this basin, though they have limitations in predicting peaks.
A Review of Criteria of Fit for Hydrological ModelsIRJET Journal
This document reviews criteria for evaluating the performance of hydrological models. It discusses various efficiency criteria that are used to quantify the closeness of observed and simulated hydrological values like streamflow. The document emphasizes that solely relying on correlation-based measures is not suitable for model evaluation and that a combination of different efficiency criteria should be used. It also reviews some commonly used criteria like the Nash-Sutcliffe efficiency and their limitations. The objectives of the paper are to review selected efficiency criteria and their limitations, evaluate factors affecting model performance, and provide guidelines for future hydrological model evaluation.
This document summarizes a study that used lattice Boltzmann methods to simulate fluid flow through porous media. The study varied the Darcy number from 10-6 to 10-2 and the Reynolds number at 10 and 100 to observe their effects. Velocity profiles and streamline plots were produced from the simulations. Decreasing the Darcy number, which represents permeability, was found to significantly influence the flow properties and location of primary vortices within the porous media. The numerical simulations agreed well with existing theories on incompressible fluid flow.
Complexity Neural Networks for Estimating Flood Process in Internet-of-Things...Dr. Amarjeet Singh
With the advancement of the Internet of Things (IoT)-based water conservation computerization, hydrological data is increasingly enriched. Considering the ability of deep learning on complex features extraction, we proposed a flood process forecastin gmodel based on Convolution Neural Network(CNN) with two-dimension(2D) convolutional operation. At first, we imported the spatial-temporal rainfall features of the Xixian basin. Subsequently, extensive experiments were carried out to determine the optimal hyperparameters of the proposed CNN flood forecasting model.
This paper reviews recent developments in the design of microfluidic concentration gradient generators for biological applications. It discusses how gradient generator designs leverage mass transport principles like diffusion and convection to control gradients. The review provides guidance on design considerations for different biological assays and summarizes factors to account for when using gradient generators. It also outlines perspectives on future improvements to gradient generator technology.
This document describes a study that analyzed the void fraction distribution within a hydraulic jump in a USBR II stilling basin. Both a physical and numerical model of the case study were developed. Void fraction measurements were taken at different profiles throughout the hydraulic jump for both models. The results from these models were then compared to data from other studies on void fraction distributions in classical hydraulic jumps. The physical model using an optical fiber probe was able to fully reproduce the aeration of the hydraulic jump, while the numerical model missed some aeration mechanisms. The models provide insight into how the energy dissipation devices in the USBR II basin impact the void fraction distribution within the jump.
The document discusses several topics:
1. A new version of the Garp3 modeling software was released, including improvements to model sharing, sketching, simulation control, and help pages.
2. Issues that modelers encounter when developing qualitative models are described, along with work to automatically detect and solve such issues.
3. An example is given of a modeling issue where a recruitment rate quantity generated inconsistencies during simulation due to being associated with a river rather than a population stage.
4. Work on a qualitative model exploring sustainability in the Brazilian Riacho Fundo water basin is mentioned, which will be presented to stakeholders for evaluation to support understanding and decision-making about water resources management.
Summary: The province of Mendoza can administrate water using digital tools that are used for the Science of Earth, and that way to optimize the use of resource, with an intrinsic impact on Economic Science, it is said projections on its productive array. Thus, early development of abilities on this kind of tools that takes part of the so-called Administration 4.0, allows to the professional future of Economic Science and more specifically to the Public Administrators, being more competitive, keeping up online with the new demands that visualize by the digital revolution that are undertaking.
Application Methods artificial neural network(Ann) Back propagation structure...irjes
This document describes a study that used an artificial neural network with backpropagation (ANN-BP) to predict Manning's roughness coefficient.
- The ANN-BP model was trained on 352 data points from laboratory experiments measuring flow parameters. It used a 7-10-1 network architecture with 10 neurons in the input layer, 10 neurons in the hidden layer, and 1 neuron in the output layer.
- The model achieved a correlation coefficient of 0.980 when comparing predicted and simulated roughness coefficients. The mean squared error was 0.00000177 and the Nash-Sutcliffe efficiency value was 0.597, indicating good model performance.
Watershed models simulate natural processes like water flow, sediment movement, and nutrient cycling within watersheds. They also quantify the impacts of human activities on these processes. Watershed models come in different forms with varying complexity and computational requirements. They are used to address a wide range of environmental and water resource issues like flooding, erosion, pollution, and more. Watershed models can be classified based on how they acquire and treat data, and whether they take a lumped or distributed approach. The key steps in developing and applying a watershed model include establishing objectives, model design, calibration, validation, application, and accounting for uncertainty.
International Journal of Engineering Research and Applications (IJERA) is an open access online peer reviewed international journal that publishes research and review articles in the fields of Computer Science, Neural Networks, Electrical Engineering, Software Engineering, Information Technology, Mechanical Engineering, Chemical Engineering, Plastic Engineering, Food Technology, Textile Engineering, Nano Technology & science, Power Electronics, Electronics & Communication Engineering, Computational mathematics, Image processing, Civil Engineering, Structural Engineering, Environmental Engineering, VLSI Testing & Low Power VLSI Design etc.
ANN Modeling of Monthly and Weekly Behaviour of the Runoff of Kali River Catc...IOSR Journals
Model is a system, by whose operation; the characteristics of other similar systems can be ascertained. Experimental observation made on a model bear a definite relationship with prototype. So, the model analysis or modeling is actually an experimental method of finding solution of complex flow problems like surface water modeling, sub-surface water modeling etc. Many flow situations are not amenable to theoretical analysis. Modeling is a valuable means of obtaining better understanding of particular situation. Inspired by the functioning of the brain and biological nervous system, Artificial Neural Networks (ANNs) has been applied to various hydrological problems in last two decades. In this study, two ANN models using feed forward – back propagation network are developed to correlate a relationship between rainfall and runoff on monthly and weekly basis for Kali river catchment up to Supa dam in Uttara Kannada District of Karnataka State, India. The developed two models are compared and evaluated using standard statistical parameters to know strength and weaknesses. This performance can be further refined by incorporating more input parameters of catchment properties like soil moisture index; land use and land cover details etc.
NUMERICAL STUDY OF FLUID FLOW AROUND A DIVER HELPERijmech
Having access to high speed diving without the use of mechanical science and discovery centers have been
considered. Production of simple, yet effective tool to reduce energy consumption and associated diver is
very valuable. Assistant diver device that works with human muscle power, includes a pair of ballets. This
system reduces the energy required to dive to less than half as the speed increases to 2 to 5 knot. Using
numerical methods can answer a lot of questions and a simulation of the dynamic behavior of the device. In
this article, modeling of fluid flow around the Diver helper of FLUENT software and using Dynamic Mesh
have been done.
Flow lines show an increase in the angle of the fins and causes development of vortices behind them.
Pressure Cantor can also be used in the analysis of the fins. The drag coefficient ballet based on the device
at various angles in a period is reported in charts.
Similar to Research reproducibility - Code etc. (20)
This is a short introduction to understand just a little how hydrological models and some hydraulics works. Much relies on the oral presentation. Unfortunately this is is Italian
A short introduction to some hydrological extreme phenomenaRiccardo Rigon
For high School teachers. Kept at MUSE on October 20th 2017. It covers the typology of some phenomena giving a little of explanation of the diverse dynamics. Is a product of LIFE FRANCA EU project
This is the presentation given for the admission to his second year of Ph.D. studies by Michele Bottazzi. Besides sumamrizing the work done during the first year, Michele traces his pathways into the second year with an abrupt change of direction towards simulating and discussion transpiration from plants.
This is the presentation for his admission to the third year of his Ph.D.. It talks about the several direction his work had taken and look forward to the conclusion of some task in form of code release and published papers.
This contains a summary of the data available for torrente Meledrio. We are using it for the project SteepsStreams, and we want to estimate its water and sediment budgets.
This contains the talk given at the 2017 meeting of the SteepStream ERANET project. It is assumed to talk about the hydrological cycle of the Noce river in Val di Sole valley (Trentino, Italy). It is a preliminary view of what we are going to do in the project.
This contains some hints and discussions about how to implement Grids in a Object Oriented language. Specifically the discussion is made with Java in mind, but obviosly, not limited to it.
How to implement unstructured grids in Java (or BTW in another OO language). First start from understanding what grids are and how they are described in algebraic topology. Mathematics first, can be a good idea. No explicit implementation here, but concept and literature to study and start from..
Virtual water refers to the water used in the production of agricultural and industrial products. Large amounts of water are required to produce many goods - for example, 1kg of beef requires 16,000kg of water. Countries import virtual water when they import water-intensive goods produced elsewhere. This is important for water-stressed countries. For example, in Southern Africa the average annual runoff in South Africa is 45.2km3/year, while Lesotho contributes an additional 5.2km3/year through water transfers. Several countries in the region are already experiencing water stress according to common definitions. The document provides statistics on water availability and usage in several Southern African countries.
John Dalton established quantitative hydrology in 1799 by creating a water balance for England and Wales using rainfall and river flow data. He attributed the origin of springs to rainfall, rejecting long-held myths and laying the foundation for the modern understanding of the hydrological cycle. Recent work has focused on understanding soil evaporation dynamics at the pore scale, finding that as the soil surface dries, the spacing between pores increases, leading to higher evaporative flux per pore that can maintain an overall constant evaporation rate despite a decreasing surface area. This pore-scale model provides insights into evaporation rates, surface resistance, and energy partitioning during drying.
Projecting Climate Change Impacts on Water Resources in Regions of Complex To...Riccardo Rigon
The title describes it all. Jeremy Pal's student Brianna Pagàn and coworkers put an impressive set of tools to estimate the impacts of land use and climate change on water resources of south California.
The document discusses modern approaches to flood forecasting. It begins by noting the importance of data collection and organization for hydrological modeling and forecasting. Key tools mentioned for hydrological modeling include HEC-HMS, SWAT, and SWMM. The document also discusses the importance of using multiple linked models to account for hydrological and hydraulic processes. Examples provided include systems used by ARPAE in Italy and the state of Iowa in the US. These contemporary approaches are characterized as using high-resolution data, multi-objective multi-process models, and cyberinfrastructure to run complex distributed hydrological models. However, the document notes that while such sophisticated systems provide valuable information, there are still open questions around verification at small scales
Hydrological Extremes and Human societies Riccardo Rigon
This is the talk given by Giuliano di Baldassarre at the Summer School on Hydrological Modeling kept in Cagliari this here. The topic is very up-to-date and important. He presented an analysis of a few case studies and suggested some literature.
The Science of Water Transport and Floods from Theory to Relevant Application...Riccardo Rigon
This is the presentation given by Ricardo Mantilla at University of Iowa in 2017. It talks about the system implemented in Iowa for flood forecasting in real time
These are the slides presented at EGU 2017 General Meeting, the Pico session was entlited: Monitoring and modelling flow paths, supply and quality in a changing mountain cryosphere
Executive Directors Chat Leveraging AI for Diversity, Equity, and InclusionTechSoup
Let’s explore the intersection of technology and equity in the final session of our DEI series. Discover how AI tools, like ChatGPT, can be used to support and enhance your nonprofit's DEI initiatives. Participants will gain insights into practical AI applications and get tips for leveraging technology to advance their DEI goals.
LAND USE LAND COVER AND NDVI OF MIRZAPUR DISTRICT, UPRAHUL
This Dissertation explores the particular circumstances of Mirzapur, a region located in the
core of India. Mirzapur, with its varied terrains and abundant biodiversity, offers an optimal
environment for investigating the changes in vegetation cover dynamics. Our study utilizes
advanced technologies such as GIS (Geographic Information Systems) and Remote sensing to
analyze the transformations that have taken place over the course of a decade.
The complex relationship between human activities and the environment has been the focus
of extensive research and worry. As the global community grapples with swift urbanization,
population expansion, and economic progress, the effects on natural ecosystems are becoming
more evident. A crucial element of this impact is the alteration of vegetation cover, which plays a
significant role in maintaining the ecological equilibrium of our planet.Land serves as the foundation for all human activities and provides the necessary materials for
these activities. As the most crucial natural resource, its utilization by humans results in different
'Land uses,' which are determined by both human activities and the physical characteristics of the
land.
The utilization of land is impacted by human needs and environmental factors. In countries
like India, rapid population growth and the emphasis on extensive resource exploitation can lead
to significant land degradation, adversely affecting the region's land cover.
Therefore, human intervention has significantly influenced land use patterns over many
centuries, evolving its structure over time and space. In the present era, these changes have
accelerated due to factors such as agriculture and urbanization. Information regarding land use and
cover is essential for various planning and management tasks related to the Earth's surface,
providing crucial environmental data for scientific, resource management, policy purposes, and
diverse human activities.
Accurate understanding of land use and cover is imperative for the development planning
of any area. Consequently, a wide range of professionals, including earth system scientists, land
and water managers, and urban planners, are interested in obtaining data on land use and cover
changes, conversion trends, and other related patterns. The spatial dimensions of land use and
cover support policymakers and scientists in making well-informed decisions, as alterations in
these patterns indicate shifts in economic and social conditions. Monitoring such changes with the
help of Advanced technologies like Remote Sensing and Geographic Information Systems is
crucial for coordinated efforts across different administrative levels. Advanced technologies like
Remote Sensing and Geographic Information Systems
9
Changes in vegetation cover refer to variations in the distribution, composition, and overall
structure of plant communities across different temporal and spatial scales. These changes can
occur natural.
A workshop hosted by the South African Journal of Science aimed at postgraduate students and early career researchers with little or no experience in writing and publishing journal articles.
This presentation includes basic of PCOS their pathology and treatment and also Ayurveda correlation of PCOS and Ayurvedic line of treatment mentioned in classics.
A review of the growth of the Israel Genealogy Research Association Database Collection for the last 12 months. Our collection is now passed the 3 million mark and still growing. See which archives have contributed the most. See the different types of records we have, and which years have had records added. You can also see what we have for the future.
हिंदी वर्णमाला पीपीटी, hindi alphabet PPT presentation, hindi varnamala PPT, Hindi Varnamala pdf, हिंदी स्वर, हिंदी व्यंजन, sikhiye hindi varnmala, dr. mulla adam ali, hindi language and literature, hindi alphabet with drawing, hindi alphabet pdf, hindi varnamala for childrens, hindi language, hindi varnamala practice for kids, https://www.drmullaadamali.com
How to Make a Field Mandatory in Odoo 17Celine George
In Odoo, making a field required can be done through both Python code and XML views. When you set the required attribute to True in Python code, it makes the field required across all views where it's used. Conversely, when you set the required attribute in XML views, it makes the field required only in the context of that particular view.
How to Manage Your Lost Opportunities in Odoo 17 CRMCeline George
Odoo 17 CRM allows us to track why we lose sales opportunities with "Lost Reasons." This helps analyze our sales process and identify areas for improvement. Here's how to configure lost reasons in Odoo 17 CRM
Walmart Business+ and Spark Good for Nonprofits.pdfTechSoup
"Learn about all the ways Walmart supports nonprofit organizations.
You will hear from Liz Willett, the Head of Nonprofits, and hear about what Walmart is doing to help nonprofits, including Walmart Business and Spark Good. Walmart Business+ is a new offer for nonprofits that offers discounts and also streamlines nonprofits order and expense tracking, saving time and money.
The webinar may also give some examples on how nonprofits can best leverage Walmart Business+.
The event will cover the following::
Walmart Business + (https://business.walmart.com/plus) is a new shopping experience for nonprofits, schools, and local business customers that connects an exclusive online shopping experience to stores. Benefits include free delivery and shipping, a 'Spend Analytics” feature, special discounts, deals and tax-exempt shopping.
Special TechSoup offer for a free 180 days membership, and up to $150 in discounts on eligible orders.
Spark Good (walmart.com/sparkgood) is a charitable platform that enables nonprofits to receive donations directly from customers and associates.
Answers about how you can do more with Walmart!"
The simplified electron and muon model, Oscillating Spacetime: The Foundation...RitikBhardwaj56
Discover the Simplified Electron and Muon Model: A New Wave-Based Approach to Understanding Particles delves into a groundbreaking theory that presents electrons and muons as rotating soliton waves within oscillating spacetime. Geared towards students, researchers, and science buffs, this book breaks down complex ideas into simple explanations. It covers topics such as electron waves, temporal dynamics, and the implications of this model on particle physics. With clear illustrations and easy-to-follow explanations, readers will gain a new outlook on the universe's fundamental nature.
The simplified electron and muon model, Oscillating Spacetime: The Foundation...
Research reproducibility - Code etc.
1. Theory and Practice of Reproducible
Research
OGRS, Perugia, October 12, 2016
Riccardo Rigon, Francesco Serafin, Marialaura Bancheri
AntonioCanova,Letregrazie
2. 2
Antonio Canova gypsum statues bring a series of
little signs. They served the stonemasons to
reproduce “industrially” the opera. Art became
“reproducible” for the fist time.
Rigon & Al.
Canova ?
3. http://simplystatistics.org/2013/01/23/statisticians-and-computer-scientists-if-there-is-no-code-there-is-no-paper/
I have been frustrated often with statisticians and
computer scientists who write papers where they
develop new methods and seem to demonstrate that
those methods blow away all their competitors. But
then no software is available to actually test and see if
that is true. … In my mind, new methods/analyses
without software are just vaporware … If there is no
code, there is no paper.
By Jeff Leek*
4. 4
Science must be reproducible (i.e. repeatable)
It is the fundamental. It means that everyone (in principle) should
be able to take what you write, the experiment you did, the
mathematics you drew, and doing it again with his own resources.
“In principle means” that science is often
not is not shared … for various reasons …
Why reproducibility ?
Rigon & Al.
5. 5
Not anyone can reproduce scientific achievements
“In principle” means that
S/he must be trained to do it (there are problems of transmission of
information here). And, in fact, more advanced results, can be difficult to
grab, even for the very same autors.
Introduction
Rigon & Al.
9. 9
Reproducible, in this case requires first
Consistency of notation
For what regards to this, the paper is certainly consistent (it is part of
the peer-review process to guarantee it).
A more strong statement would require consistency of notation
through series of companion papers.
But this paper, in particular, is not a heavy
theoretical treatment of some topic, and
notation is not really crucial here.
Notation helps
Rigon & Al.
10. 10
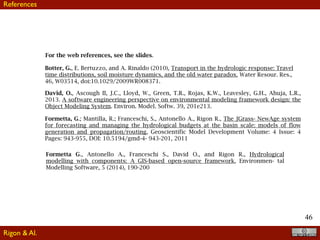
Different story for this paper
(the case of Botter et al., 2010)
Click
Here
for
Full
Article
Transport in the hydrologic response: Travel time
distributions, soil moisture dynamics, and the old
water paradox
Gianluca Botter,1
Enrico Bertuzzo,2
and Andrea Rinaldo1,2
Received 8 July 2009; revised 23 October 2009; accepted 29 October 2009; published 12 March 2010.
[1] We propose a mathematical framework for the general definition and computation of
travel time distributions defined by the closure of a catchment control volume, where the
input flux is an arbitrary rainfall pattern and the output fluxes are green and blue water
flows (namely, evapotranspiration and the hydrologic response embedding runoff
production through soil water dynamics). The relevance of the problem is both practical,
owing to implications in hydrologic watershed modeling, and conceptual for the linkages
and the explanations the theory provides, chiefly concerning the role of geomorphology,
climate, soils, and vegetation through soil water dynamics and the treatment of the so‐
called old water paradox. The work focuses in particular on the origins of the conditional
and time‐variant nature of travel time distributions and on the differences between unit
hydrographs and travel time distributions. Both carrier flow and solute matter transport in
the control volume are accounted for coherently. The key effect of mixing processes
occurring within runoff production is also investigated, in particular by a model that
assumes that mobilization of soil water involves randomly sampled particles from the
available storage. Travel time distributions are analytically expressed in terms of the major
water fluxes driving soil moisture dynamics, irrespectively of the specific model used to
compute them. Relevant numerical examples and a set of generalized applications are
provided and discussed.
Citation: Botter, G., E. Bertuzzo, and A. Rinaldo (2010), Transport in the hydrologic response: Travel time distributions, soil
moisture dynamics, and the old water paradox, Water Resour. Res., 46, W03514, doi:10.1029/2009WR008371.
1. Introduction
[2] The age of water (or residence time) represents the
time spent by water molecules ideally sampled from a given
hydrologic system within the reference control volume
(measured since the entry through rainfall). Thus, the age of
water blends in a single quantitative attribute information
about hydrological and chemical storages, flow pathways,
and water sources [e.g., McGuire and McDonnell, 2006].
Several field observations (especially built through exten-
sive rainfall/runoff dating by isotope hydrology) and a few
theoretical results have established the so‐called “old water
paradox,” according to which a sizable part of the runoff
within the hydrologic response of catchment transport vo-
lumes is constituted by aged water particles (i.e., by water
particles injected at times preceding the event causally re-
lated to the observed runoff) [e.g., Maloszewski and Zuber,
1982; McDonnell, 1990; McDonnell et al., 1991; Stewart
and McDonnell, 1991; Wilson et al., 1991a, 1991b;
Leaney et al., 1993; Rodhe et al., 1996; Cirmo and
McDonnell, 1998; Nyberg et al., 1999; Peters and
Ratcliffe, 1998; Burns et al., 1998; Weiler et al., 2003;
McGuire et al., 2007; Botter et al., 2007, 2008a, 2009]. The
release of old water has been explained by the propagation
of pressure waves induced by precipitation inputs with a
celerity exceeding the pore water velocity [e.g., Beven,
1981, 1989b], including displacement of water previously
immobilized within the soil matrix into preferential flow
pathways [e.g., Beven and Germann, 1982]. However, some
of the physical processes controlling the release of preevent
water from catchments are still poorly understood or
roughly modeled, and the observational data do not suggest
either universal behaviors, nor do they support linear and
time‐invariant behaviors as assumed by unit hydrograph
schemes [e.g., Weiler and McDonnell, 2006]. The com-
plexity of the mixing patterns involving event and preevent
waters in hillslopes is partly a byproduct of the structural
complexity of subsurface environments, which are typically
characterized by pronounced heterogeneity and time vari-
able connectivity of flow pathways. For this reason, it is
inappropriate to use the point‐scale physical laws deter-
mining the movement of water and solutes within hillslopes
to make predictions at larger scales because of the nonlin-
earity of flow processes and the uncertain distribution of
hydrologic, geological and morphological properties of
control volumes [e.g., Beven, 1989a, 2006; Kirchner, 2009].
Hence, lumped approaches are frequently employed to
describe in an effective manner the overall behavior of
hillslopes/catchments. In particular, the water travel time
1
Dipartimento di Ingegneria Idraulica Marittima Ambientale e
Geotecnica, Università degli Studi di Padova, Padua, Italy.
2
Laboratory of Ecohydrology, Faculte´ ENAC, Ecole Polytechinque
Federale, Lausanne, Switzerland.
Copyright 2010 by the American Geophysical Union.
0043‐1397/10/2009WR008371
WATER RESOURCES RESEARCH, VOL. 46, W03514, doi:10.1029/2009WR008371, 2010
W03514 1 of 18
R. Rigon
Botter et al., 2010
11. 11
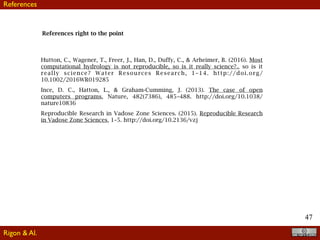
This is an outstanding paper dealing with transport for residence time, which
I read several times during the last months, in order to reproduce their
research (with my own tools)
Click
Here
for
Full
Article
Transport in the hydrologic response: Travel time
distributions, soil moisture dynamics, and the old
water paradox
Gianluca Botter,1
Enrico Bertuzzo,2
and Andrea Rinaldo1,2
Received 8 July 2009; revised 23 October 2009; accepted 29 October 2009; published 12 March 2010.
[1] We propose a mathematical framework for the general definition and computation of
travel time distributions defined by the closure of a catchment control volume, where the
input flux is an arbitrary rainfall pattern and the output fluxes are green and blue water
flows (namely, evapotranspiration and the hydrologic response embedding runoff
production through soil water dynamics). The relevance of the problem is both practical,
owing to implications in hydrologic watershed modeling, and conceptual for the linkages
and the explanations the theory provides, chiefly concerning the role of geomorphology,
climate, soils, and vegetation through soil water dynamics and the treatment of the so‐
called old water paradox. The work focuses in particular on the origins of the conditional
and time‐variant nature of travel time distributions and on the differences between unit
hydrographs and travel time distributions. Both carrier flow and solute matter transport in
the control volume are accounted for coherently. The key effect of mixing processes
occurring within runoff production is also investigated, in particular by a model that
assumes that mobilization of soil water involves randomly sampled particles from the
available storage. Travel time distributions are analytically expressed in terms of the major
water fluxes driving soil moisture dynamics, irrespectively of the specific model used to
compute them. Relevant numerical examples and a set of generalized applications are
provided and discussed.
Citation: Botter, G., E. Bertuzzo, and A. Rinaldo (2010), Transport in the hydrologic response: Travel time distributions, soil
moisture dynamics, and the old water paradox, Water Resour. Res., 46, W03514, doi:10.1029/2009WR008371.
1. Introduction
[2] The age of water (or residence time) represents the
time spent by water molecules ideally sampled from a given
hydrologic system within the reference control volume
(measured since the entry through rainfall). Thus, the age of
water blends in a single quantitative attribute information
about hydrological and chemical storages, flow pathways,
and water sources [e.g., McGuire and McDonnell, 2006].
Several field observations (especially built through exten-
sive rainfall/runoff dating by isotope hydrology) and a few
theoretical results have established the so‐called “old water
paradox,” according to which a sizable part of the runoff
within the hydrologic response of catchment transport vo-
lumes is constituted by aged water particles (i.e., by water
particles injected at times preceding the event causally re-
lated to the observed runoff) [e.g., Maloszewski and Zuber,
1982; McDonnell, 1990; McDonnell et al., 1991; Stewart
and McDonnell, 1991; Wilson et al., 1991a, 1991b;
Leaney et al., 1993; Rodhe et al., 1996; Cirmo and
McDonnell, 1998; Nyberg et al., 1999; Peters and
Ratcliffe, 1998; Burns et al., 1998; Weiler et al., 2003;
McGuire et al., 2007; Botter et al., 2007, 2008a, 2009]. The
release of old water has been explained by the propagation
of pressure waves induced by precipitation inputs with a
celerity exceeding the pore water velocity [e.g., Beven,
1981, 1989b], including displacement of water previously
immobilized within the soil matrix into preferential flow
pathways [e.g., Beven and Germann, 1982]. However, some
of the physical processes controlling the release of preevent
water from catchments are still poorly understood or
roughly modeled, and the observational data do not suggest
either universal behaviors, nor do they support linear and
time‐invariant behaviors as assumed by unit hydrograph
schemes [e.g., Weiler and McDonnell, 2006]. The com-
plexity of the mixing patterns involving event and preevent
waters in hillslopes is partly a byproduct of the structural
complexity of subsurface environments, which are typically
characterized by pronounced heterogeneity and time vari-
able connectivity of flow pathways. For this reason, it is
inappropriate to use the point‐scale physical laws deter-
mining the movement of water and solutes within hillslopes
to make predictions at larger scales because of the nonlin-
earity of flow processes and the uncertain distribution of
hydrologic, geological and morphological properties of
control volumes [e.g., Beven, 1989a, 2006; Kirchner, 2009].
Hence, lumped approaches are frequently employed to
describe in an effective manner the overall behavior of
hillslopes/catchments. In particular, the water travel time
1
Dipartimento di Ingegneria Idraulica Marittima Ambientale e
Geotecnica, Università degli Studi di Padova, Padua, Italy.
2
Laboratory of Ecohydrology, Faculte´ ENAC, Ecole Polytechinque
Federale, Lausanne, Switzerland.
Copyright 2010 by the American Geophysical Union.
0043‐1397/10/2009WR008371
WATER RESOURCES RESEARCH, VOL. 46, W03514, doi:10.1029/2009WR008371, 2010
W03514 1 of 18
It is mostly a theoretical paper, with an application to an idealised case study
Botter et al., 2010
Rigon & Al.
12. 12
JGrass-NewAGE 1.0
Hymod and RHymod in fig.(7.9).
Figure 7.9: Modelling solutions: Hymod (in red dashed line) and RHymod (in blued dashed line).
Back to Formetta et al., 2011
Rigon & Al.
13. 13
JGrass-NewAGE 1.0: more
Therefore, to reproduce JGrass-NewAGE 1.0 results, one has to know
the theory of any of the above components. Unfortunately, this is
only the first impression. You have to know actually more
6. NEWAGE-JGRASS SHORTWAVE RADIATION MODEL
Figure 6.1: OMS3 SWRB components of NewAge-JGrass and the flowchart to model shortwave
radiation at the terrain surface with generic sky conditions. Where not specified, quantity for input
Back to Formetta et al., 2011
Rigon & Al.
14. 14
JGrass-NewAGE 1.0: even more
for di↵erent time steps. The outputs could be or a .csv file or a raster map with the interpolated
values.
Comparisons with the R-package Gstat (115) are presented in Appendix 1 in order to test
the implemented algorithms (ordinary and local kriging).
Figure 5.3: The Kriging flowchart.
Back to Formetta et al., 2011
Rigon & Al.
15. 15
JGrass-NewAGE 1.0: even more than more
The analysis of the catchment, starts with the acquisition of a Digital Terrain Model (DTM)
of the catchment, e.g. (159). It is performed as illustrated in fig.(4.1) and summarized for the
reader below.
Figure 4.1: The workflow for the basin delineation in NewAge-JGrass -
4.2.1 Geomorphological analysis
Back to Formetta et al., 2011
Rigon & Al.
17. 17
JGrass-NewAGE 1.0: Sorry, I forgot a pieceG. Formetta et al.: The JGrass-NewAge System for forecasting and managing hydrological budgets 953
Fig. 9. Application of the JGrass-NewAge model for the period 01/01/2002 to 31/12/2003.
case of two submodels for runoff production, one of which,
whilst appealing from a theoretical point of view, revealed
unfeasible during calibration. This models was, in fact, eas-
ily substituted by another without the need to rebuild the
whole model system.
The versatility of the modeling approach was also tested
by implementing two different modeling chains, one sub-
stantially performing simulation with a very lumped appli-
cation of the model, just using Hymod for the whole catch-
ment, the other representing a more distributed “version” of
the same Hymod runoff generating mechanism, connected
with a routing scheme. The forecasts were tested by analysis
of the residuals and through the estimation of some objective
indices, which were also implemented as software compo-
nents. These allowed us to objectively state that, at least for
the case in study, the performances of the distributed ver-
sion of the modeling chain was significantly better than the
lumped version, thus supporting the idea that the increase in
model complexity was worthwhile. It is noteworthy that this
comparison was made between systems where most of the
code was the same, thus guaranteeing, in our opinion, the
The modeling chain, although seemingly very traditional,
was actually implemented using advanced specifications of
the geographical objects, as required by OGC, and uses a
particular specification of the river network hierarchy and the
related hillslopes that was built upon the Pfafstetter ordering
scheme.
Even though the overall performances of the forecasting
can be considered very good, in the future some new compo-
nents could substitute the older ones and be compared consis-
tently along the same lines, even if further improvements in
the ability to forecast measured discharge could not be con-
sidered significant without a proper assessment of the uncer-
tainties inherent to the description of the processes.
These comparisons could be made by the same authors
or independently by other researchers, since the JGrass-
NewAge modeling system is freely available, with just the
new component requiring coding. In this sense the infras-
tructure promotes independent testing and verification of re-
search results with unprecedented easiness. In this perspec-
tive a component by component and interoperability com-
parison of the JGrass-NewAge system with others, such as
You need the same data !
In this case, you are lucky. We used open data … but this is not always the case
Back to Formetta et al., 2011
Rigon & Al.
18. 18
Assuming you are bold and smart
This will take for you at least a couple of years for putting all the parts
together for your own and just following verbatim the indication you can get
from the paper. (We think we put all of the information in the paper
necessary: but, you know, this is practically unverifiable)
Mumbling
Rigon & Al.
19. 19
Our paper is theoretically reproducible … but practically not: it requires
a trained person to do it, having all the right tools in her hands (including
programming skills)…
If you are a Ph.D. student that starts from the scratch you cannot
afford it ! Almost nobody goes back and repeats something that's
already been published, though.*
*http://arstechnica.com/science/2012/08/scientific-reproducibility-for-fun-and-profit/
Mumbling Mumbling
Rigon & Al.
20. 20
So are we doing science or just cheating of doing
science ?
Theoretically reproducible … but practically not: means that
theoretically we are doing science, but practically not ?
Mumbling Mumbling Mumbling
Rigon & Al.
21. 21
This is even worse than believed in today sciences
Because of the massive use of computation.
Computation is now central to the scientific
enterprise and it adds a further layer of
complexity to the science visible in papers.
Some paper that comes
out from computation
are out of any control
Not just one single case
Rigon & Al.
22. Not just one single case
22
“Computation is now central to the scientific
enterprise, and the emergence of powerful
computational hardware, combined with a vast array
of computational software, presents novel
opportunities for researchers. Unfortunately, the
scientific culture surrounding computational work
has evolved in ways that make it difficult to verify
findings, efficiently build on past research, or even
apply the basic tenets of the scientific method to
computational procedures.”
By Victoria Stodden, Jonathan M. Borwein, David H. Bailey, SIAM news
http://sinews.siam.org/DetailsPage/tabid/607/ArticleID/351/%E2%80%9CSetting-the-Default-to-
Reproducible%E2%80%9D-in-Computational-Science-Research.aspx
are out of any control
Rigon & Al.
23. 23
To keep out any doubt
I decided to make public any code (any source code, actually) under a copyleft
license (GPL v 3.0). Se at:
http://abouthydrology.blogspot.it/2015/03/jgrass-newage-essentials.html
So we reduced a couple of years of work to three months (with instructions)
No fake science
Rigon & Al.
24. 24
An we plan to make our work
Replicable
in any paper not only Reproducible
but we are not alone
No fake science
Rigon & Al.
25. 25
Editorial: The publication of geoscientific model
developments v1.0
one of the EGU’s Open Access journals, i.f. 3.6
Journals
Rigon & Al.
26. 26
Editorial: Vadose Zone Journal
Reproducible Research
in Vadose Zone Sciences
T.H. Skaggs,* M.H. Young, and J.A. Vrugt
A significant portion of present-day soil and Earth science research is
computational, involving complex data analysis pipelines, advanced
mathematical and statistical models, and sophisticated computer codes.
Opportunities for scientific progress are greatly diminished if reproduc-
ing and building on published research is difficult or impossible due to the
complexity of these computational systems. Vadose Zone Journal (VZJ) is
launching a Reproducible Research (RR) program in which code and data
underlying a research article will be published alongside the article, thereby
enabling readers to analyze data in a manner similar to that presented in
the article and build on results in future research and applications. In this
article, we discuss reproducible research, its background and use across
other disciplines, its value to the scientific community, and its implementa-
tion in VZJ.
Abbreviations: NIH, National Institutes of Health; RR, Reproducible Research; VZJ, Vadose
Zone Journal.
A hallmark of the scientific method is that research results must be reproduc-
ible. Although the reproducibility requirement has always existed, technological advances
over the last few decades have changed the way science is practiced and communicated,
creating for researchers and publishers new opportunities and challenges with respect to
openness and reproducibility.
One set of opportunities involves increased reuse of experimental data. The internet and
related information technologies have allowed greater archiving and sharing of environmen-
tal and geoscience data. Data sharing makes the validation of scientific findings possible,
lessenstheneedforwastefulduplicationofresearchefforts,andfacilitatesnewdatasynthesis
and aggregation activities. A number of environmental and geoscience publishers have pro-
Core Ideas
• A significant portion of present-
day geoscience resea rch is
computational.
• Science would benefit from greater
transparency in computational
research.
• Vadose Zone Journal is launching a
Reproducible Research program.
• Code and data underlying a
research article will be published
alongside articles.
Opinion and Policy
Published October 12, 2015
Journals
Rigon & Al.
27. 27
1 Make our source code open source (actually not necessary just the
executable could serve the scope) and available through
https://github.com/
Counterattack: a strategy to make our work replicable
Rigon & Al.
28. 28
a) Documenting our code as best as possible, according to a
standard format (still to define … but we are working on it).
b) Documenting our algorithms.
c) Using the Object modelling System v3 (David et al., 2013,
Formetta et al, 2014)
Rigon & Al.
2
Counterattack: a strategy to make our work replicable
29. 29
Counterattack: a strategy to make our work replicable
3
Using the appropriate building tools
https://gradle.org/
Rigon & Al.
30. 30
Use standard names for hydrological variable. For instance use the
Basic Model Interface standards BMI
http://csdms.colorado.edu/wiki/BMI_Description
Rigon & Al.
Counterattack: a strategy to make our work replicable
4
31. 31
Using Authorea for uploading complementary material and
documentation.
https://www.authorea.com/
Rigon & Al.
Counterattack: a strategy to make our work replicable
You can use also Jupyter or Beaker
32. 32
A strategy to make our paper replicable
Using as much as possible Open Data in our research and making
available openly our data*.
*
is a Nature Journal
http://www.nature.com/sdata/
https://en.wikipedia.org/wiki/Open_data
Rigon & Al.
Counterattack: a strategy to make our work replicable
33. 33
Other (more valuable experiences)
The R community
(https://cran.r-project.org/web/views/ReproducibleResearch.html)
Communities
Rigon & Al.
37. 37
Become a Reproducible Research Warrior !
Do not wait! Make your stuff available
on the Web (whatever format)
under an open license*.
*Same as Tim Berners-Lee - Waiting to have it in better shape will delays the publication forever,
and your contribution will be lost (like tears in rain): http://5stardata.info/
R2
The
stairs
For yourself
Rigon & Al.
38. 38
M a k e i t a v a i l a b l e w i t h
documentation (e.g. a README
file for any data set and for any
model)
R2
The
stairs
For yourself
Rigon & Al.
39. 39
Provide examples of runs, and give
some reference. Structure your
documentation. Include figures and
their making.
R2
The
stairs
For yourself
Rigon & Al.
40. 40
Use URLs and providers like Github
to store code and data, so people
can point at your stuff, and browse
it freely*
R2
The
stairs
For yourself
Rigon & Al.
41. 41
Maintain a user group (and answer to
questions when asked). Provide any run you
do on the web with the appropriate
metadata.** ***
**: https://earthsystemcog.org/projects/es-doc-models/
***http://abouthydrology.blogspot.it/2014/10/naming-things-in-hydrological-models.html
R2
The
stairs
For yourself
Rigon & Al.
42. 42
R. Rigon
Maintain a user group (and answer to
questions when asked). Provide any run you
do on the web with the appropriate
metadata.** ***
**: https://earthsystemcog.org/projects/es-doc-models/
***http://abouthydrology.blogspot.it/2014/10/naming-things-in-hydrological-models.html
Use URLs and providers like Github
to store code and data, so people
can point at your stuff, and browse
it freely*
M a k e i t a v a i l a b l e w i t h
documentation (e.g. a README
file for any data set and for any
model)
Provide examples of runs, and give
some reference. Structure your
documentation. Include figures and
their making.
Do not wait! Make your stuff available
on the Web (whatever format)
under an open license*.
*http://5stardata.info/
R2
The
stairs
For yourself
44. 44
In conclusion
Conclusions
• Research must be reproducible
• In many case it would be better it is replicable
• Making our research replicable can be an advantage
• It can favour the progress of science
• Do not be shy: share your research
• Nobody is going to hurt you
Rigon & Al.
Find your own way to Reproducible Research
45. !45
Find this presentation at
http://abouthydrology.blogspot.com
Ulrici,2000?
Other material at
Questions ?
http://abouthydrology.blogspot.it/2015/07/theory-and-practice-of-reproducible.html
Rigon & Al.
46. 46
For the web references, see the slides.
Formetta, G.; Mantilla, R.; Franceschi, S., Antonello A., Rigon R., The JGrass- NewAge system
for forecasting and managing the hydrological budgets at the basin scale: models of flow
generation and propagation/routing, Geoscientific Model Development Volume: 4 Issue: 4
Pages: 943-955, DOI: 10.5194/gmd-4- 943-201, 2011
Botter, G., E. Bertuzzo, and A. Rinaldo (2010), Transport in the hydrologic response: Travel
time distributions, soil moisture dynamics, and the old water paradox, Water Resour. Res.,
46, W03514, doi:10.1029/2009WR008371.
Formetta G., Antonello A., Franceschi S., David O., and Rigon R., Hydrological
modelling with components: A GIS-based open-source framework, Environmen- tal
Modelling Software, 5 (2014), 190-200
David, O., Ascough II, J.C., Lloyd, W., Green, T.R., Rojas, K.W., Leavesley, G.H., Ahuja, L.R.,
2013. A software engineering perspective on environmental modeling framework design: the
Object Modeling System. Environ. Model. Softw. 39, 201e213.
References
Rigon & Al.
47. 47
References right to the point
Hutton, C., Wagener, T., Freer, J., Han, D., Duffy, C., & Arheimer, B. (2016). Most
computational hydrology is not reproducible, so is it really science?,, so is it
really science? Water Resources Research, 1–14. http://doi.org/
10.1002/2016WR019285
Ince, D. C., Hatton, L., & Graham-Cumming, J. (2013). The case of open
computers programs, Nature, 482(7386), 485–488. http://doi.org/10.1038/
nature10836
Reproducible Research in Vadose Zone Sciences. (2015). Reproducible Research
in Vadose Zone Sciences, 1–5. http://doi.org/10.2136/vzj
Rigon & Al.
References