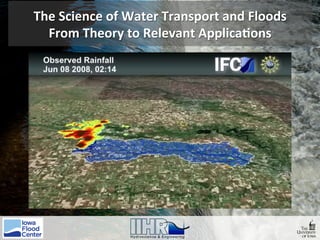
This is the presentation given by Ricardo Mantilla at University of Iowa in 2017. It talks about the system implemented in Iowa for flood forecasting in real time
Aquifer recharge from flash floods in the arid environment: A mass balance ap...Amro Elfeki
Estimation of the infiltration/natural recharge to groundwater from rainfall is an important issue in hydrology, particularly in arid regions. This paper proposes the application of The Natural Resources Conservation Service (NRCS) mass balance model to develop infiltration (F)–rainfall (P) relationship from flash flood events. Moreover, the NRCS method is compared with the rational and the Ф-index methods to investigate the discrepancies between these methods. The methods have been applied to five gauged basins and their 19 sub-basins (representative basins with detailed measurements) in the southwestern part of Saudi Arabia with 161 storms recorded in 4 years. The F–P relationships developed in this study based on NRCS method are: F = 39% P with R2 = 0.932 for the initial abstraction factor, λ = 0.2. However, F = 77% P with R2 = 0.986 for λ = 0.01. The model at λ = 0.01 is the best to fit the data, therefore, it is recommended to use the formula at λ = 0.01. The results show that the NRCS model is appropriate for the estimation of the F–P relationships in arid regions when compared with the rational and the Ф index methods. The latter overestimates the infiltration because they do not take λ into account. There is no significant difference between F–P relationships at different time scales. This helps the prediction of infiltration rates for aquifer recharge at ungauged basins from monthly and annual rainfall data with a single formula.
Flood frequency analysis of river kosi, uttarakhand, india using statistical ...eSAT Journals
Abstract In the present study, flood frequency analysis has been applied for river Kosi in Uttarakhand. The river Kosi is an important tributary of Ganga river system, which arising from Koshimool near Kausani, Almora district flows on the western side of the study area and to meet at Ramganga River. The annual flood series analysis has been carried out to estimate the flood quantiles at different return period at Kosi barrage site of river Kosi. The statistical approach provided a significant advantage of estimation of flood at any sites in the homogenous region with very less or no data. In the at –site analysis of annual flood series the Normal, Log normal, Pearson type III, Log Pearson type III, Gumbel and Log Gumbel distribution were applied using method of moments . From the analysis of different goodness of fit tests, it has been found that the Log Gumbel distribution with method of moment as parameters estimation found to be the best-fit distribution for Kosi River and other sites in the region. It is recommended that the regional parameters for Kosi Basin may be used only for primary estimation of flood and should be reviewed when more regional data available. Keywords: Flood Frequency Analysis, River Kosi, Annual Peak Flood discharge, Return Period, Goodness of fit Test.
It is based on Journal Paper named
"Mukherjee, M.K.2013, ’Flood Frequency Analysis of River Subernarekha, India, Using Gumbel’s extreme Value Distribution’, IJCER,Vol-3,Issue-7,pp-12-18."
I have studied the journal and make a PPT in the following.
I
The climate and earth sciences have recently undergone a rapid transformation from a data-poor
to a data-rich environment. In particular, massive amount of data about Earth and its
environment is now continuously being generated by a large number of Earth observing satellites
as well as physics-based earth system models running on large-scale computational platforms.
These massive and information-rich datasets offer huge potential for understanding how the
Earth's climate and ecosystem have been changing and how they are being impacted by humans’
actions. This talk will discuss various challenges involved in analyzing these massive data sets
as well as opportunities they present for both advancing machine learning as well as the science
of climate change in the context of monitoring the state of the tropical forests and surface water
on a global scale.
DSD-INT 2017 Using XBeach to train a Bayesian network for coastal hazard pred...Deltares
Presentation by Haris Plomaritis (University of Algarve-CIMA) at the XBeach X (10th Year Anniversary) Conference, during Delft Software Days - Edition 2017. Wednesday, 1 November 2017, Delft.
2011 liongson-modeling studies flood control dams-professorial chair lectureleony1948
HYDROLOGICAL MODELING STUDIES FOR PROPOSED FLOOD-CONTROL DAMS IN THE MARIKINA RIVER BASIN
Leonardo Q. Liongson
Team Energy Professorial Chair
& Professor, Institute of Civil Engineering and National Hydraulic Research Center, University of the Philippines, Diliman, Quezon City, Philippines
Abstract
Tropical Storm Ondoy (Ketsana) crossed Metro Manila and the adjacent river basins in a late wet-season episode of 2009, starting in the evening of September 25, 2009 and continuing into the next day of September 26, 2009. TS Ondoy brought very intense and heavy rainfall to the region - record amounts of rains fell over a very short time period of 12 hours to 24 hours, which are estimated to occur at an average annual frequency of 1 in 100 years or even higher, depending on the measuring location in the region. The rains generated record-magnitude flood flows and inundation in the Pasig-Marikina River Basin in Metro Manila, and the Laguna de Bay region. This paper describes the application of the distributed watershed rainfall-runoff model SWATCH in order to simulate the TS Ondoy floods and other floods of lower return periods (2 years to 100 years) in the upper Marikina River Basin, using as input the spatially-interpolated rainfall network data and available topographic, soil/geology and river-geometry data. The SWATCH model consists of a tree-network of several variable rectangular surface/soil/aquifer storage nodes and overland/channel flow links, with accounting of soil moisture, evapotranspiration, infiltration, and recharge to groundwater, and routing of overland and channel flows, interflow and baseflow into aggregated total streamflows. Using the model-computed inflow flood hydrographs, the options of single or cascade of flood-control storage dams (with selected reservoir-storage and spillway capacities) for attenuation of floods peaks and volumes, and downstream flood hazard reduction are initially evaluated by flood-routing studies.
Aerodynamic and Acoustic Parameters of a Coandã Flow – a Numerical Investigationdrboon
Coandã flows have been the study of aircraft designers primarily for the prospect of achieving higher lift coefficient wings. Recently the environmental problem of noise pollution attracted further interest on the matter. The approach used is numerical; the computations were made using a large eddy simulation (LES) technique coupled with a Ffowcs-Williams-Hawkings (FWH) acoustic analysis. The spectrum of the flow was measured at three locations in the vicinity of the ramp showing that the low frequency region is dominant. The findings may be used as reference for the development of quiet aircraft that use super-circulation, as it is the case with the Upper Surface Blown (USB) configurations.
Flood Risk Assessment Using GIS Tools, By Dr. Omar Elbadawy, CEDARE, Land and Water Days in Near East & North Africa, 15-18 December 2013, Amman, Jordan
DSD-INT 2019 Implementation and application of the SANTOSS sand transport for...Deltares
Presentation by Jebbe van der Werf, Deltares, at the Delft3D and XBeach User Day: Coastal morphodynamics, during Delft Software Days - Edition 2019. Wednesday, 13 November 2019, Delft.
Wavelet estimation for a multidimensional acoustic or elastic earthArthur Weglein
A new and general wave theoretical wavelet estimation
method is derived. Knowing the seismic wavelet
is important both for processing seismic data and for
modeling the seismic response. To obtain the wavelet,
both statistical (e.g., Wiener-Levinson) and deterministic
(matching surface seismic to well-log data) methods
are generally used. In the marine case, a far-field
signature is often obtained with a deep-towed hydrophone.
The statistical methods do not allow obtaining
the phase of the wavelet, whereas the deterministic
method obviously requires data from a well. The
deep-towed hydrophone requires that the water be
deep enough for the hydrophone to be in the far field
and in addition that the reflections from the water
bottom and structure do not corrupt the measured
wavelet. None of the methods address the source
array pattern, which is important for amplitude-versus-
offset (AVO) studies.
Wavelet estimation for a multidimensional acoustic or elastic earth- Arthur W...Arthur Weglein
A new and general wave theoretical wavelet estimation
method is derived. Knowing the seismic wavelet
is important both for processing seismic data and for
modeling the seismic response. To obtain the wavelet,
both statistical (e.g., Wiener-Levinson) and deterministic
(matching surface seismic to well-log data) methods
are generally used. In the marine case, a far-field
signature is often obtained with a deep-towed hydrophone.
The statistical methods do not allow obtaining
the phase of the wavelet, whereas the deterministic
method obviously requires data from a well. The
deep-towed hydrophone requires that the water be
deep enough for the hydrophone to be in the far field
and in addition that the reflections from the water
bottom and structure do not corrupt the measured
wavelet. None of the methods address the source
array pattern, which is important for amplitude-versus-
offset (AVO) studies
DSD-INT 2017 The unsaturated zone MetaSWAP-package, recent developments - Van...Deltares
Presentation by Paul van Walsum (Wageningen University & Research) at the iMOD International User Day, during Delft Software Days - Edition 2017. Tuesday, 31 October 2017, Delft.
This is a short introduction to understand just a little how hydrological models and some hydraulics works. Much relies on the oral presentation. Unfortunately this is is Italian
A short introduction to some hydrological extreme phenomenaRiccardo Rigon
For high School teachers. Kept at MUSE on October 20th 2017. It covers the typology of some phenomena giving a little of explanation of the diverse dynamics. Is a product of LIFE FRANCA EU project
This is the presentation given for the admission to his second year of Ph.D. studies by Michele Bottazzi. Besides sumamrizing the work done during the first year, Michele traces his pathways into the second year with an abrupt change of direction towards simulating and discussion transpiration from plants.
This is the presentation for his admission to the third year of his Ph.D.. It talks about the several direction his work had taken and look forward to the conclusion of some task in form of code release and published papers.
This contains a summary of the data available for torrente Meledrio. We are using it for the project SteepsStreams, and we want to estimate its water and sediment budgets.
This contains the talk given at the 2017 meeting of the SteepStream ERANET project. It is assumed to talk about the hydrological cycle of the Noce river in Val di Sole valley (Trentino, Italy). It is a preliminary view of what we are going to do in the project.
This contains some hints and discussions about how to implement Grids in a Object Oriented language. Specifically the discussion is made with Java in mind, but obviosly, not limited to it.
How to implement unstructured grids in Java (or BTW in another OO language). First start from understanding what grids are and how they are described in algebraic topology. Mathematics first, can be a good idea. No explicit implementation here, but concept and literature to study and start from..
This is the outstanding lecture given by Dani Or when receiving his Dalton Prize at 2017 Wien EGU General Assembly. It is a must-read for who deals with ET and good material also for teaching to students.
Projecting Climate Change Impacts on Water Resources in Regions of Complex To...Riccardo Rigon
The title describes it all. Jeremy Pal's student Brianna Pagàn and coworkers put an impressive set of tools to estimate the impacts of land use and climate change on water resources of south California.
This is the English translation, with some relevant corrections, of the talk I gave at University of Calabria, about the contemporary and post-contemporary flood forecasting.
Hydrological Extremes and Human societies Riccardo Rigon
This is the talk given by Giuliano di Baldassarre at the Summer School on Hydrological Modeling kept in Cagliari this here. The topic is very up-to-date and important. He presented an analysis of a few case studies and suggested some literature.
These are the slides presented at EGU 2017 General Meeting, the Pico session was entlited: Monitoring and modelling flow paths, supply and quality in a changing mountain cryosphere
Freezing Soil for the class of Environmental ModellingRiccardo Rigon
This is similar to the lecture Niccolò gave in Ottawa during his staying in Carleton University. This also contains further results from his Ph.D. thesis
Macroeconomics- Movie Location
This will be used as part of your Personal Professional Portfolio once graded.
Objective:
Prepare a presentation or a paper using research, basic comparative analysis, data organization and application of economic information. You will make an informed assessment of an economic climate outside of the United States to accomplish an entertainment industry objective.
Welcome to TechSoup New Member Orientation and Q&A (May 2024).pdfTechSoup
In this webinar you will learn how your organization can access TechSoup's wide variety of product discount and donation programs. From hardware to software, we'll give you a tour of the tools available to help your nonprofit with productivity, collaboration, financial management, donor tracking, security, and more.
Operation “Blue Star” is the only event in the history of Independent India where the state went into war with its own people. Even after about 40 years it is not clear if it was culmination of states anger over people of the region, a political game of power or start of dictatorial chapter in the democratic setup.
The people of Punjab felt alienated from main stream due to denial of their just demands during a long democratic struggle since independence. As it happen all over the word, it led to militant struggle with great loss of lives of military, police and civilian personnel. Killing of Indira Gandhi and massacre of innocent Sikhs in Delhi and other India cities was also associated with this movement.
Synthetic Fiber Construction in lab .pptxPavel ( NSTU)
Synthetic fiber production is a fascinating and complex field that blends chemistry, engineering, and environmental science. By understanding these aspects, students can gain a comprehensive view of synthetic fiber production, its impact on society and the environment, and the potential for future innovations. Synthetic fibers play a crucial role in modern society, impacting various aspects of daily life, industry, and the environment. ynthetic fibers are integral to modern life, offering a range of benefits from cost-effectiveness and versatility to innovative applications and performance characteristics. While they pose environmental challenges, ongoing research and development aim to create more sustainable and eco-friendly alternatives. Understanding the importance of synthetic fibers helps in appreciating their role in the economy, industry, and daily life, while also emphasizing the need for sustainable practices and innovation.
The French Revolution, which began in 1789, was a period of radical social and political upheaval in France. It marked the decline of absolute monarchies, the rise of secular and democratic republics, and the eventual rise of Napoleon Bonaparte. This revolutionary period is crucial in understanding the transition from feudalism to modernity in Europe.
For more information, visit-www.vavaclasses.com
Biological screening of herbal drugs: Introduction and Need for
Phyto-Pharmacological Screening, New Strategies for evaluating
Natural Products, In vitro evaluation techniques for Antioxidants, Antimicrobial and Anticancer drugs. In vivo evaluation techniques
for Anti-inflammatory, Antiulcer, Anticancer, Wound healing, Antidiabetic, Hepatoprotective, Cardio protective, Diuretics and
Antifertility, Toxicity studies as per OECD guidelines
Model Attribute Check Company Auto PropertyCeline George
In Odoo, the multi-company feature allows you to manage multiple companies within a single Odoo database instance. Each company can have its own configurations while still sharing common resources such as products, customers, and suppliers.