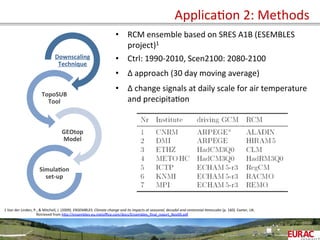
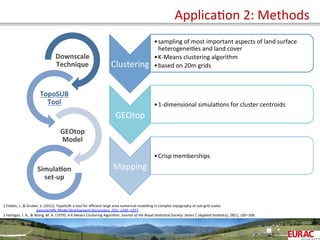
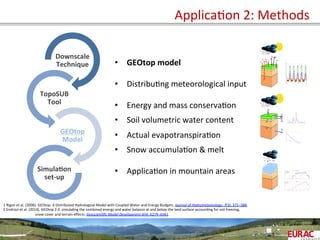
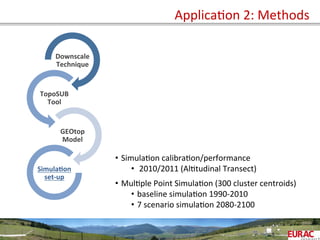
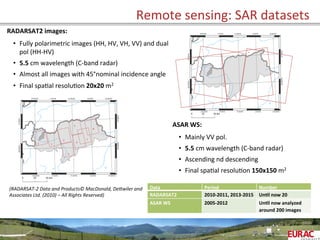
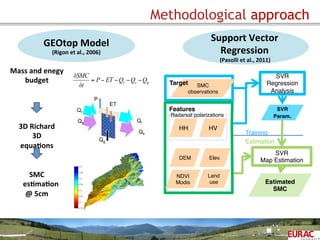
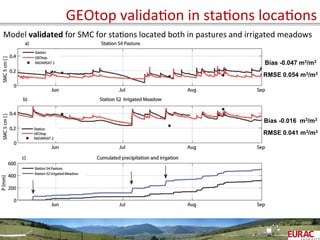
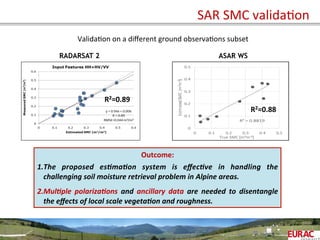
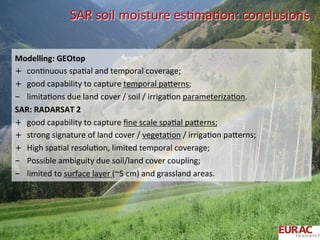
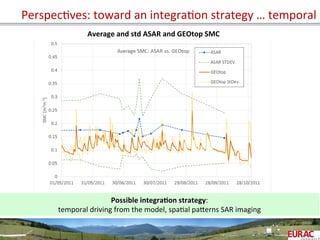
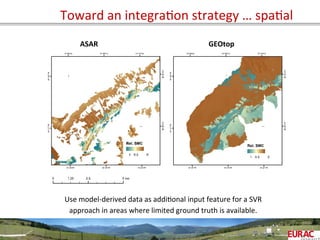
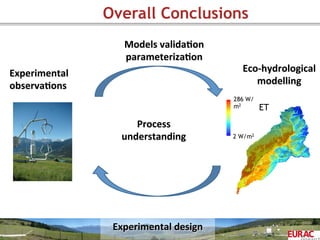
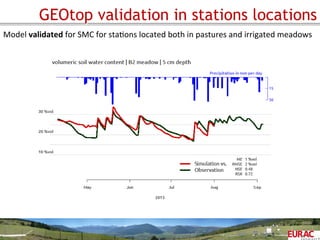
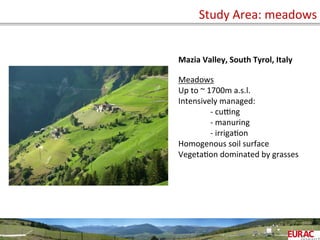
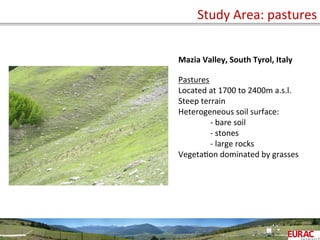
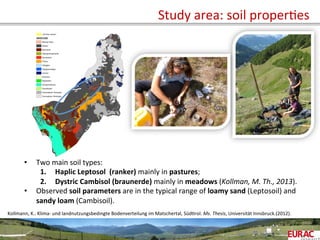
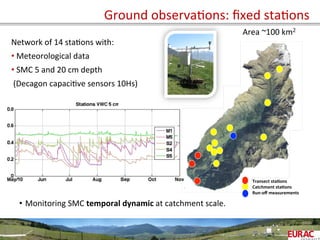
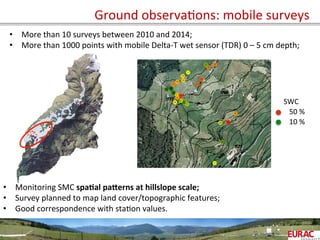
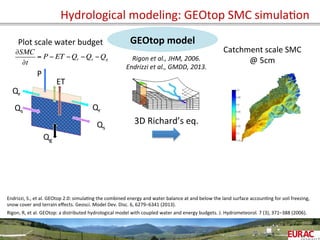
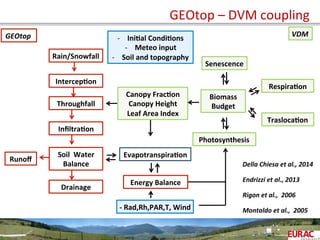
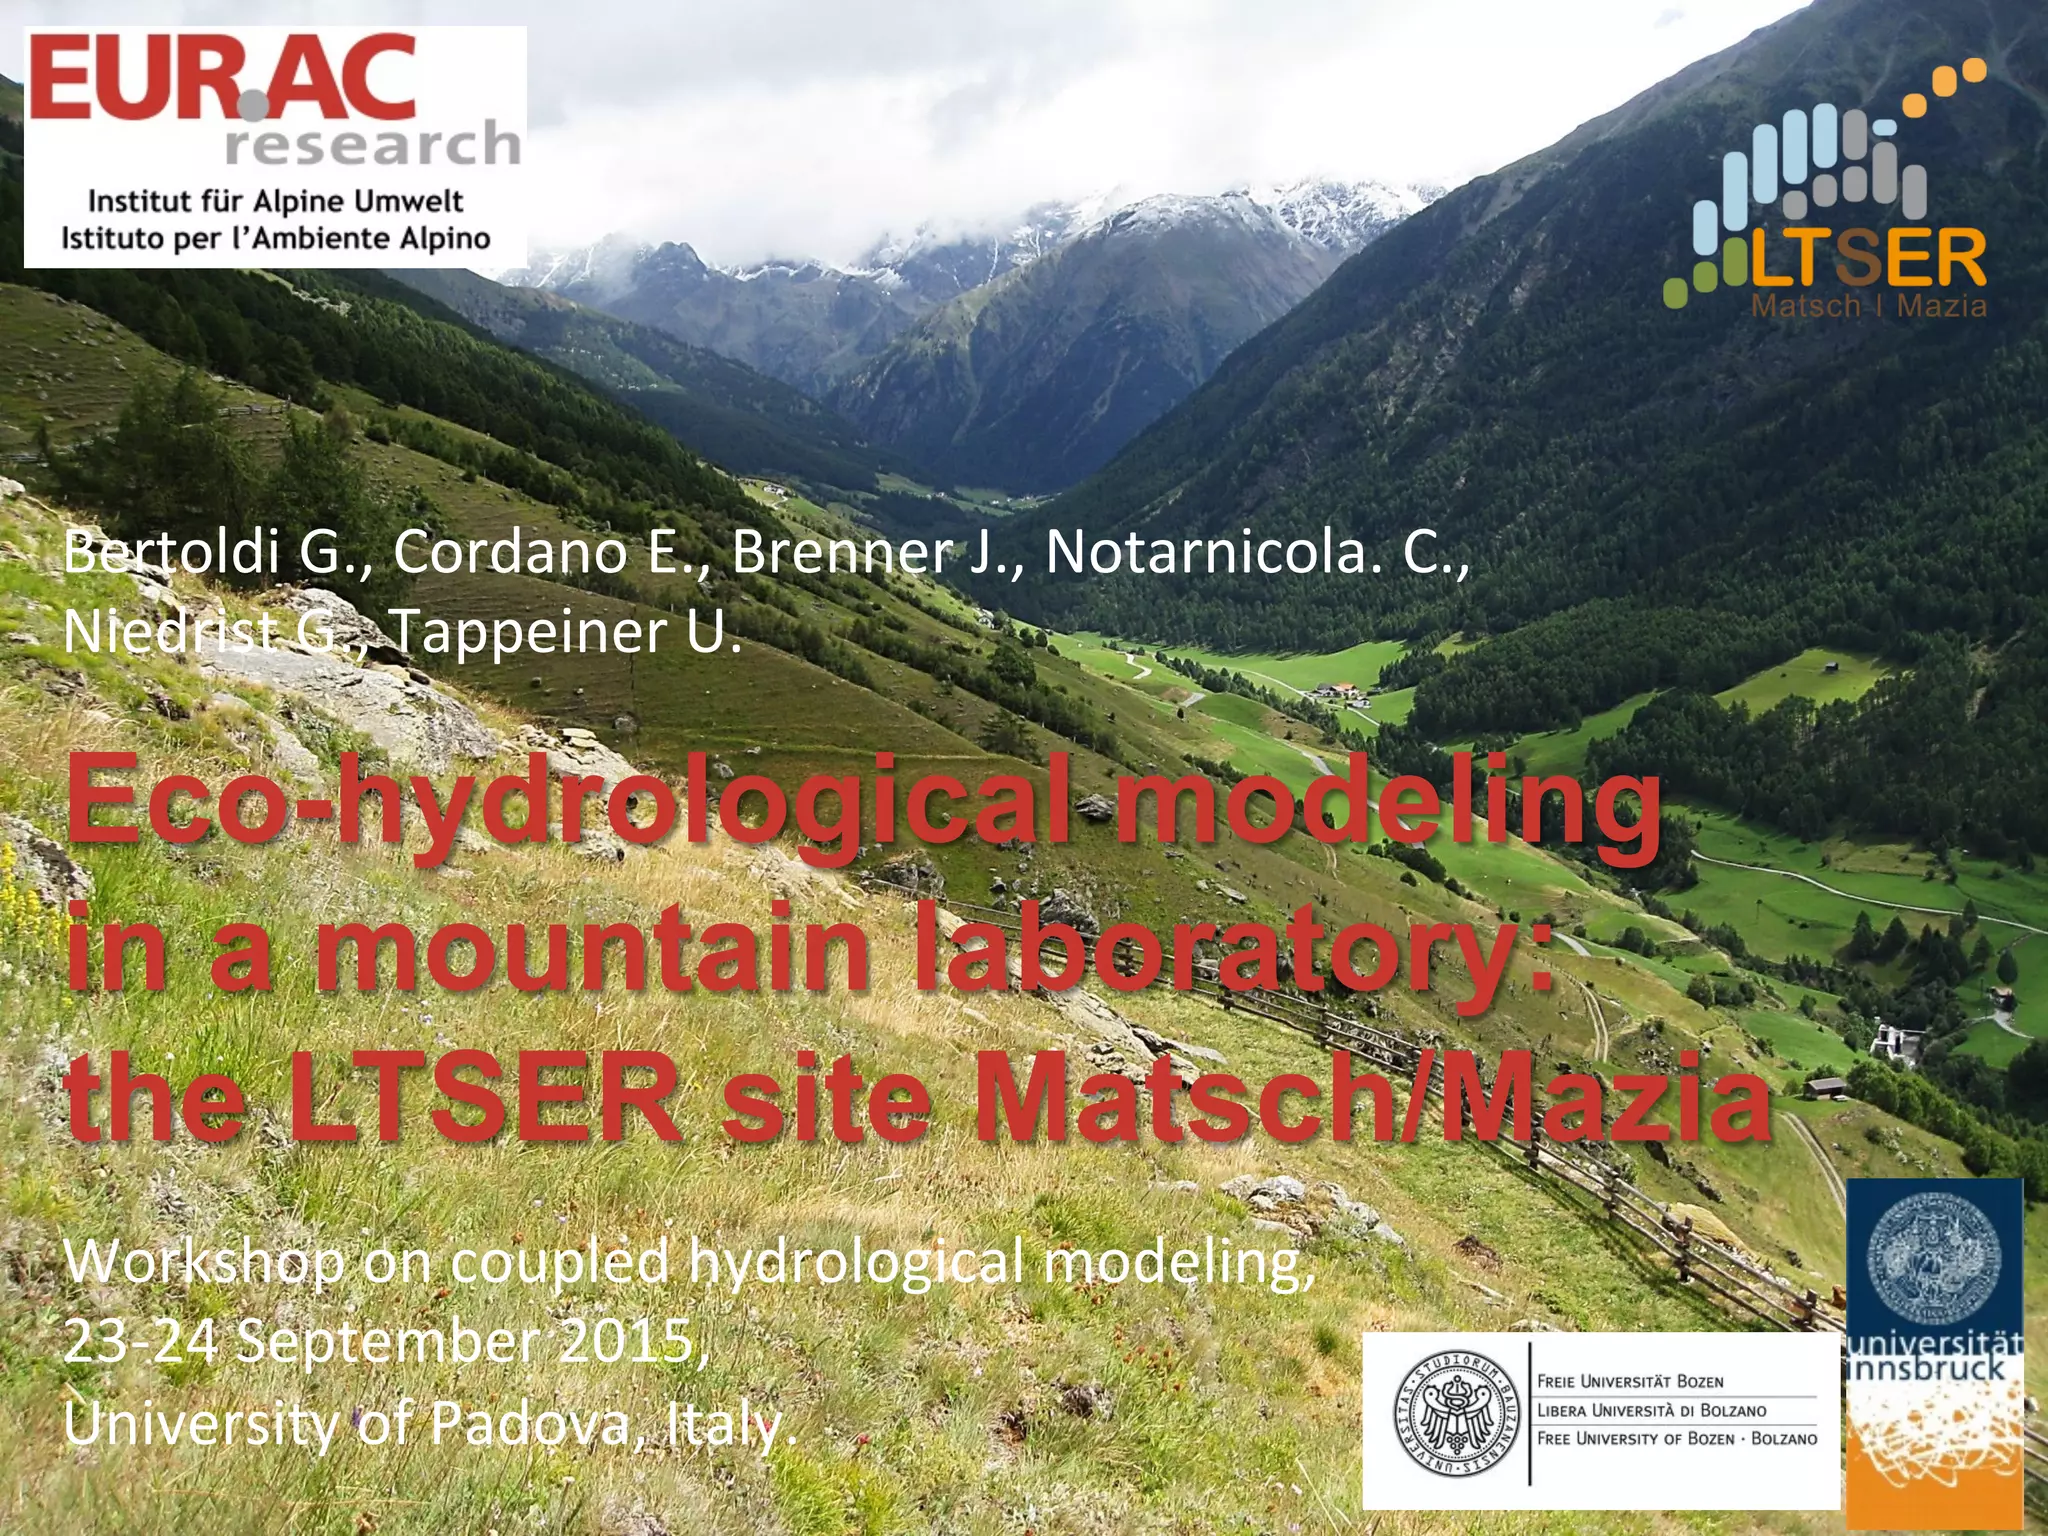
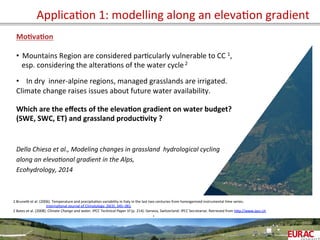
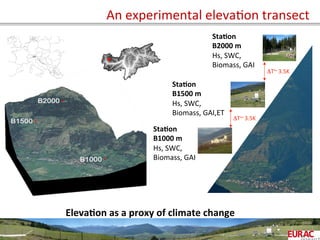
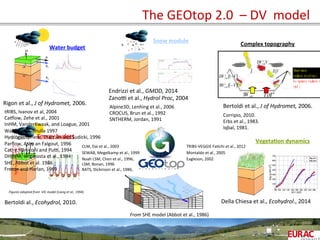
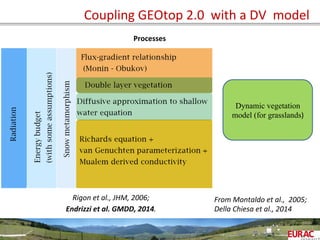
The document outlines an eco-hydrological modeling study conducted in the Matsch/Mazia region, focusing on climate change impacts on snow, soil moisture, and evapotranspiration across different elevation gradients. It describes various applications of the Geotop 2.0 model, including plot and catchment scale experiments, and highlights challenges and uncertainties in hydrological modeling in mountainous areas. The study emphasizes the importance of monitoring and modeling efforts to assess climate change vulnerabilities in the region, supported by collaborations with multiple research institutions.
![ElevaOon
gradient:
validaOon
MulOple
variables
validaOon:
SWE,
SWC,
above
ground
biomass
(Bag),
ET
Two
years
of
data:
calibra=on
in
B1500,
valida=on
in
B1000,
B2000
B2000
m
B1500
m
B1000
m
Snow
Height
[cm]
SWC
5cm
[]
ET
[mm]
Not
Measured
Not
Measured
r2=0.66
RMSE=7.1
r2=0.57
RMSE=5.9
r2=0.55
RMSE=2.9
r2=0.80
r2=0.78
r2=0.82
Bag
[gDMm-‐2]
RMSE=0.04
RMSE=0.05
RMSE=0.04
r2=0.93
RMSE=58.39](https://image.slidesharecdn.com/giacomobertoldiseminar30padova08-150925080554-lva1-app6892/85/Giacomo-bertoldi-seminar_30_padova_08-14-320.jpg)
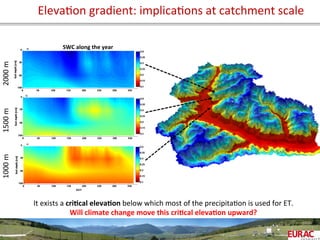
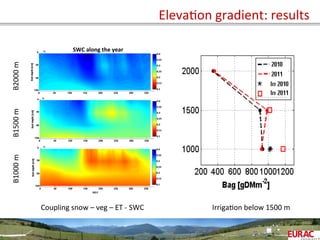
![Simula=on
extension
to
20
year
Coupling
snow
–
veg
–
ET
-‐
SWC
Water
limitaOon
below
1500
m
SWC
along
the
year
SWC
[]
2000
m
1500
m
1000
m
SWC
along
the
year
Water
source
Water
sink
CriOcal
elevaOon
ElevaOon
gradient:
soil
moisture
and
ET](https://image.slidesharecdn.com/giacomobertoldiseminar30padova08-150925080554-lva1-app6892/85/Giacomo-bertoldi-seminar_30_padova_08-15-320.jpg)