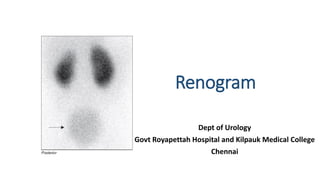
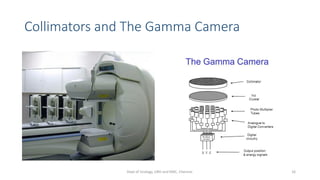
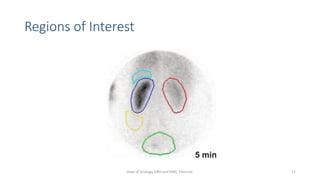
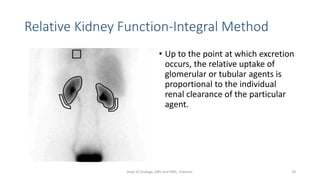
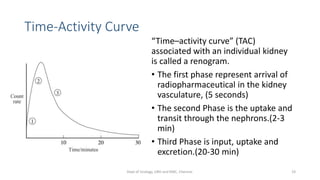
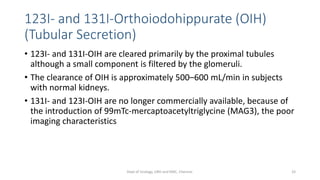
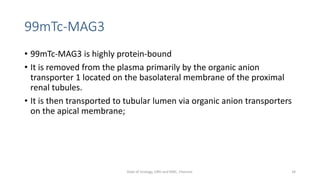
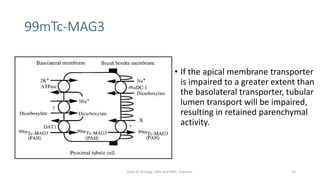
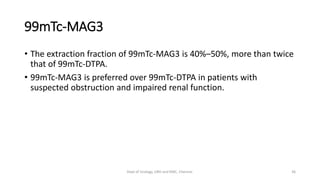
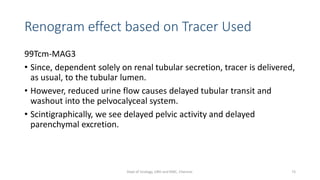
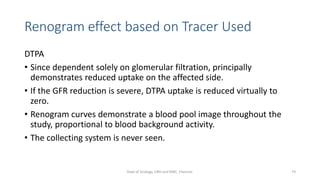
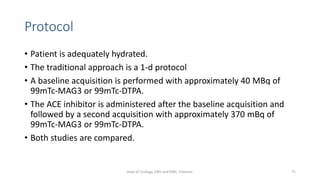
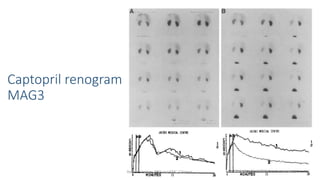
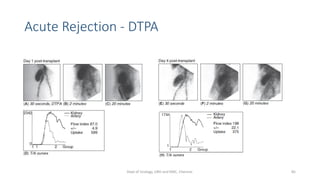
This document describes the renogram procedure. It provides details on:
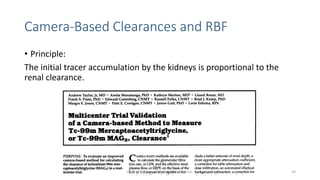
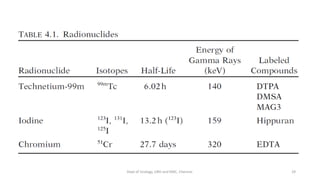
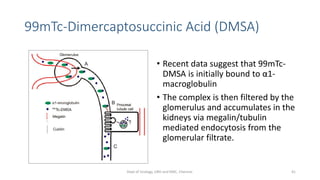
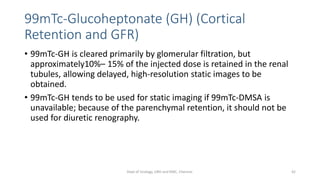
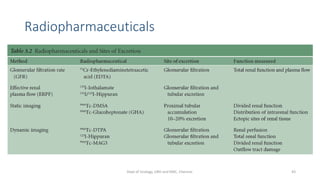
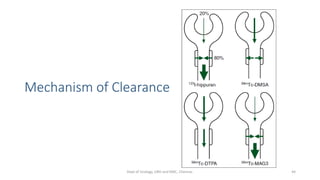
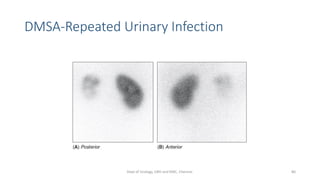
- The radiopharmaceuticals used, including 99mTc-DTPA, 99mTc-MAG3, and 99mTc-DMSA
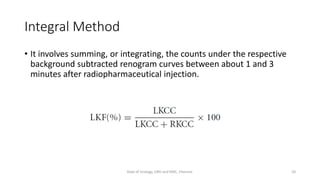
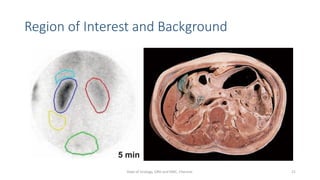
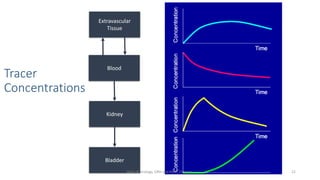
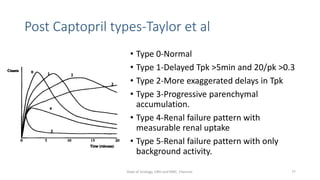
- How the procedure is performed, including patient preparation, image acquisition, and time-activity curve analysis
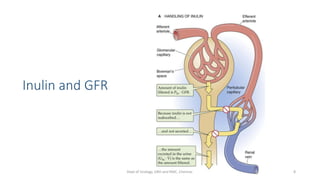
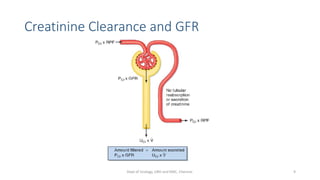
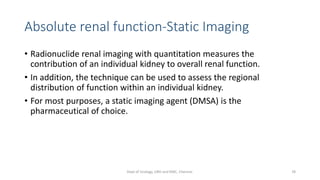
- The roles of the radiopharmaceuticals in evaluating renal blood flow, glomerular filtration rate, and renal handling and excretion
- Factors that can affect the procedure such as hydration, medications, and kidney positioning


![PERI-PROSTHETIC FRACTURE NAIL-PLATE CONSTRUCT [NPC].pptx](https://cdn.slidesharecdn.com/ss_thumbnails/drarunkumardrmohamedashrafperiprostheticfrasturenail-plateconstructnpc-260209164459-7e9d15a1-thumbnail.jpg?width=640&height=640&fit=bounds)


![ONFH[AVN HIP] -TRIPLE REGIME -A NOVAL SURGICAL CONCEPT .pptx](https://cdn.slidesharecdn.com/ss_thumbnails/onfhavnhip2026koaconcalicutdrgokuldevdrmashraf-260210064517-213ec005-thumbnail.jpg?width=640&height=640&fit=bounds)