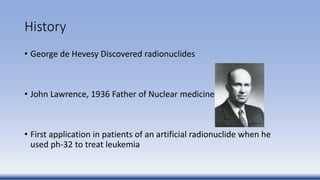
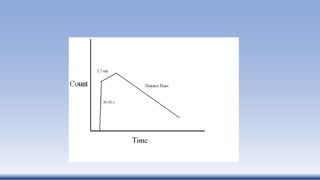
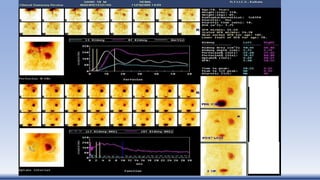
Radionuclides In Urology
By
Dr.Roshan V Shetty
History
• George de Hevesy Discovered radionuclides
• John Lawrence, 1936 Father of Nuclear medicine
• First application in patients of an artificial radionuclide when he
used ph-32 to treat leukemia
• Nuclear medicine tests - Physiological function
• Other imaging modalities- Anatomical imaging
• Principle of radioactive decay
Isotopes
• Isotopes have unstable nuclear configuration greater stability by
decay/disintegration to a more stable form
• Isotopes attempting to reach stability by emitting radiation are called
radionuclides/radioisotopes
Radionuclides
• Photon Emitting(imaging) Tc99m; Mo99; I123; Ga67; In113; Kr81
• Positron Emitting(imaging) C11; N13; O15; F18; Rb82
• Used for therapy- P32; Sr89; Y90; I131; Sm153
Radionuclides for Imaging
Desirable characteristics
• Minimum particulate emission
• Primary photon energy between 50-500 keV
• Physical T 1/2 > time required to prepare material
• Effective T1/2 longer than examination time
• Low toxicity
• Stability or near stability of the product
• Functional and anatomic information
• More organ / tissue specific than c/t whole body scans
• RADIOPHARMACEUTICALS = RADIONUCLIDES + PHARMACEUTICAL
Technetium99m
• Fulfills many criteria of ideal radionuclide
• No particulate emission
• 6 hour half life
• A predominant (98%) 148KeV photon conversion
• Used in > 70% of nuclear imaging procedures in United States
TECHNIQUES
• 2D Scintigraphy - use of internal radionuclides to create two dimensional
images.
• 3D SPECT - tomographic technique using gamma camera data from many
projections and reconstructed in different planes
• HYBRID SCAN - SPECT/CT and PET/CT
INDICATIONS
• Renal perfusion and function(Renal clearance measurements)
• Urinary Tract Obstruction (Furosemide renal scan)
• Reno-vascular HTN (Captopril renal scan)
• Infection (renal morphology scan)
• Pre-surgical quantitation (nephrectomy)
• Renal transplantation
• Congenital anomalies/masses(renal morphology scan)
Radiopharmaceutical Agents
• Grouped into three categories:
Those excreted by glomerular filtration,
Those excreted by tubular secretion,
Those retained in the renal tubules for long periods
1.Glomerular Agents
• Tc 99m DTPA
• 51Cr-EDTA
• I 125 Iothalamate
Tc 99m DTPA
• Inulin clearance remains the gold standard to measure GFR, but it is
expensive, time consuming, and requires a steady-state plasma
concentration and accurate and timed urine collection.
• 99mTc-DTPA is recommended agent is for GFR measurement.
• 5- 10% plasma protein binding, so it tends to underestimate the
GFR(insignificant)
• Peak renal activity after 3 – 4 min.
• 90 % filtered within 4 hours.
• The extraction fraction of 99mTc-DTPA is approximately 20 per cent;
for this reason, not useful for imaging , in patients with impaired
renal function. Sr.Creat upto 3mg/dl.
• In such cases, agents with higher extraction efficiencies such as
99mTc-MAG3 more appropriate.
• 51Cr-EDTA, which may provide more accurate values for GFR, but
cannot be used for imaging.
2.Tubular secreting agents
• Tc99m MAG3
• Tc99m EC
• I131/I123 OIH
Tc99m MAG3
• 70 – 90 % PROTEIN BINDING
• 89% TUBULAR SECRETION
• 11% GLOMERULAR FILTRATION
• Extraction fraction of 40-50%.
• Provides a high target-to-background ratio, good image quality, and
more accurate numerical values, particularly when the kidney
function is low or immature
• 5 TO 10 mCi i.v. ( ADULTS)
EC: Ethylene cysteine
• Metabolite of the L,L-ECD( ethylene cysteine dimer) with cortical
uptake
• Secretion in proximal convoluted tubules
• Plasma protein binding is 50%
• Exact excretion mechanism is not known
• Clearance is 69-85% of OIH
• Sr. Creat Upto 7mg/dl
3.Cortical Binding Agents
• Tc99m DMSA
• Tc99m GHA
Tc99m DMSA
• PYELONEPHRITIS, INFARCTS, SCARS, ANOMALIES
• 75% protien binding in 6 hrs
• 5- 20 % excretion 2 hrs
• 37% excretion in 24 hrs
• 40-50% cortical localisation
• Maximum activity at 3-6 hrs
• 2 TO 5 mCi i.v.
• Images at 2–4 hrs
Basic Renal Scan
• Procedure
Patient Preparation
Patient must be well hydrated
Give 5-10 ml/kg water (2-4 cups 30-60 min) pre-injection
Can measure U - specific gravity (<1.015)
Void before injection
Void at end of study
Acquisition
• Supine position preferred
• Flow (angiogram) : 2-3 sec / fr x 1 min
• Dynamic: 15-30 sec / frame x 20-30 min
(display @ 1-3 min/frame)
• Obtain a 30-60 sec. image over injection site at end of study
(if infiltration >0.5% dose do not report clearance)
• Obtain post-void supine image of kidneys at end of study
Radionuclide Renal Evaluation
A)Functional Imaging(visual assessment of perfusion and function)
B)Renography (time activity curve representative of renal function)
C)Quantification of renal function(GFR & ERPF)
D)Anatomic imaging( cortical imaging)
A)Functional Imaging
Perfusion imaging
• Evaluation of renal blood flow and function of native kidneys –
posterior projection ; transplanted kidneys – anterior projection
• 10-20mCi of radiopharmaceutical injected iv in antecubital vein.
• Imaging renal perfusion is usually begun as soon as bolus is seen in
abdominal aorta
• Subsequent images are taken every 1-5 secs
• In normal renal blood flow
• By 3 sec aorta is fully visualized.
• By 5-6 sec, both kidneys are seen.
• Maximal kidney activity is reached in 30-60 sec.
At the end of perfusion sequence
Functional imaging
• Dynamic or sequential static; 3-5 min Tc99m.
• DTPA or MAG3 are then obtained over 20-30 mins.
• Evaluation is similar to an IVP with – anatomy, position, symmetry and adequacy
of function & collecting system patency.
• With Tc99m MAG3 maximal parenchymal activity is seen at 3-5 min
• Activity in collecting system and bladder by 4-8 mins.
DTPA normal
B)Renography
• A Time Activity Curve
• Graphic representation of uptake and excretion of
radiopharmaceutical
• Information is displayed from time of injection to about 20-30 mins
Renogram Phases
FLOW PHASE
• I.Vascular phase
(RADIONUCLETIDE
ANGIOGRAM)
• Last for 30-60 sec.
• Max activity 4-6 sec
after peak aortic
activity
FUNCTIONAL PHASE
30 MIN
• II. Parenchymal
phase(uptake)
• Max activity 3 to 5
min
UPTAKE AT 2 TO 3 MIN
FOR SPLIT FUNCTION
• III. Washout
(excretory) phase no
activity after 30 min
Data obtained from renogram
• Time to peak cortical activity- 3-5 min
• Half-time excretion- time for half of peak activity to be cleared from
kidney. N – 8-12 mins
• Cortical activity at 20 min/ peak activity :< 0.30 on MAG3 renogram.
• RELATIVE/SPLIT FUNCTION
• Contribution of each kidney to the total function
% Lt kid = net cts in Lt ROI/net cts Lt + net cts Rt ROI x 100%
• Normal 50/50 - 56/44
• Borderline 57/43 - 59/41
• Abnormal > 60/40
C)Quantitation of Renal Function
GFR & ERPF measurement
• Two methods :
1.Plasma sample based clearances :
The amount of activity remaining in blood at prefixed times is a
measurement of activity not yet cleared – indirect measure of activity
already cleared.
More accurate ,but requires determination of pharmaceuticals levels in
plasma and some times in urine.
2.Camera based clearances
• Counts are obtained from syringe before inj. & subsequently over kidneys
after injection.
• No blood and urine collection.
• Sufficiently reliable method
D)Anatomic(Cortical) Imaging
• (Tc99m DMSA or GH )
• Images obtained after 2 to 4 hrs of injection
• Posterior/ right post. Oblique/ left post. Oblique
NORMAL FINDINGS
• Smooth contour with Homogeneous activity
• Less uptake in medulla
• No activity in PCS
Diuretic (Furosemide) Renal Scan
• Obstructive uropathy (hydronephrosis, hydroureter) may lead to
obstructive nephropathy (loss of renal function)
• Indications:
-Evaluate functional significance of hydronephrosis
-Determine need for surgery
-obstructive hydronephrosis - surgical Rx
-non-obstructive hydronephrosis - medical Rx/ follow up
-Monitor effect of therapy
PRINCIPLE
• Hydronephrosis - tracer pooling in dilated renal pelvis
• Furesemide induces increased urine flow
• If obstructed >>> will not wash out
• If dilated, non-obstructed >>> will wash out
• Can quantitate rate of washout (T1/2)
PROTOCOL
• Oral hydration prior to study
• NS @ 15ml/kg over 30 min 15 min prior to injection & continued in
study @ 200ml/kg/24 hr
• Bladder catheterization is required in children
• Tc 99m MAG3 – agent of choice in children with limited function,high
target-to-background ratio, good image quality, and more accurate
numerical values
• Pre requisite – residual function to respond
• Diuretic given ( infants- 1mg/kg, children 0.5mg/kg, 40 mg adults )
20-30 min after radiotracer injection
• Imaging for 20 – 30 minutes, post micturition image
• Functional images, renogram time/activity curve( before & after ),
wash out half time calculated
• Symmetric uptake and good washout is by definition not obstructed
Diuretic Renal Scan
•Washout
•(diuretic response)
•T1/2
• time required for 50% tracer to leave
• the dilated unit
• i.e. time required for activity to fall
• to 50% of peak
•T1/2
• Normal < 10 min
• Obstructed > 20 min
• Indeterminate 10 - 20 min
Scintigraphic evaluation of
Hydronephrosis
• Showing non-obstructive hydronephrosis of the left kidney,
• The arrow indicating a brisk response to intravenous diuretic.
• Showing obstructive hydronephrosis of the right kidney,
• The arrow indicating a no response to intravenous diuretic.
“F minus 15” Diuretic
• Renogram
• Furosemide (Lasix) injected 15 min before radiopharmaceutical
• Rationale: kidney in maximal diuresis,under maximal stress
• Some equivocals will become clearly positive, some clearly negative
Renal Cortical Scintigraphy
• Indications
• Determine involvement of upper tract (kidney) in acute UTI (acute
pyelonephritis)
• Detect cortical scarring (chronic pyelonephr.)
• Follow-up post Rx
• gold standard 99mTc DMSA
• The radiotracer is taken up only by functioning PCT mass
• Pyelonephritis impairs tubular uptake of radiotracer, these areas
appear as unexposed or underexposed
• Persisting areas on follow up indicates irreversible renal damage or
scarring.
• Cold Defect
-Acute or chronic PN
-Cyst
-Tumors
-Infarct
-Trauma (contusion, laceration,hematoma)
• Cortical defects are not always d/t infection & all
DMSA defects are not necessarily scars.
—2-year-old girl with fever
Renal Cortical Scintigraphy
• Congenital Anomalies
Agenesis
Ectopy
Fusion (horseshoe, crossed fused ectopia)
Polycystic kidney
Multicystic dysplastic kidney
Pseudotumors (fetal lobulation, hypertrophic column of Bertin , lobar
nephronia)
Normal DMSA scan
Horse shoe kidney
RENAL AGENESIS
Patient with Recurrent UTI
• Tc99m-DMSA renal SPECT scintigraphy
• Ectopic left kidney with multiple scars
Renal transplants scintigraphy
• Surgical complications
• Urinary leak-Initial photopenic defect with progressive accumulation
of radiotracer
• Hematoma/ Abscess- Initial photopenic defect not changing with
time.
• Lymphocele- Initial photopenic defect- equal to background activity in
delayed images.
• Ureteral obstruction
• Arterial stenosis and hypertension
Urinary Leak
Hematoma/abscess
Lymphocele
Conclusion
• Role of nuclear medicine – in investigation of renal parenchymal
function and upper urinary tract abnormalities
• Radiation burden low
• Do not require sedation or specific patient preparation
• Easy to perform
• Knowledge of renal patho-physiology and recognition of limitation
and technical pitfalls is essential

Radionuclides in urology

  • 1.
  • 2.
    History • George deHevesy Discovered radionuclides • John Lawrence, 1936 Father of Nuclear medicine • First application in patients of an artificial radionuclide when he used ph-32 to treat leukemia
  • 3.
    • Nuclear medicinetests - Physiological function • Other imaging modalities- Anatomical imaging • Principle of radioactive decay
  • 4.
    Isotopes • Isotopes haveunstable nuclear configuration greater stability by decay/disintegration to a more stable form • Isotopes attempting to reach stability by emitting radiation are called radionuclides/radioisotopes
  • 5.
    Radionuclides • Photon Emitting(imaging)Tc99m; Mo99; I123; Ga67; In113; Kr81 • Positron Emitting(imaging) C11; N13; O15; F18; Rb82 • Used for therapy- P32; Sr89; Y90; I131; Sm153
  • 6.
    Radionuclides for Imaging Desirablecharacteristics • Minimum particulate emission • Primary photon energy between 50-500 keV • Physical T 1/2 > time required to prepare material • Effective T1/2 longer than examination time • Low toxicity • Stability or near stability of the product
  • 7.
    • Functional andanatomic information • More organ / tissue specific than c/t whole body scans • RADIOPHARMACEUTICALS = RADIONUCLIDES + PHARMACEUTICAL
  • 8.
    Technetium99m • Fulfills manycriteria of ideal radionuclide • No particulate emission • 6 hour half life • A predominant (98%) 148KeV photon conversion • Used in > 70% of nuclear imaging procedures in United States
  • 9.
    TECHNIQUES • 2D Scintigraphy- use of internal radionuclides to create two dimensional images. • 3D SPECT - tomographic technique using gamma camera data from many projections and reconstructed in different planes • HYBRID SCAN - SPECT/CT and PET/CT
  • 10.
    INDICATIONS • Renal perfusionand function(Renal clearance measurements) • Urinary Tract Obstruction (Furosemide renal scan) • Reno-vascular HTN (Captopril renal scan) • Infection (renal morphology scan) • Pre-surgical quantitation (nephrectomy) • Renal transplantation • Congenital anomalies/masses(renal morphology scan)
  • 11.
    Radiopharmaceutical Agents • Groupedinto three categories: Those excreted by glomerular filtration, Those excreted by tubular secretion, Those retained in the renal tubules for long periods
  • 12.
    1.Glomerular Agents • Tc99m DTPA • 51Cr-EDTA • I 125 Iothalamate
  • 13.
    Tc 99m DTPA •Inulin clearance remains the gold standard to measure GFR, but it is expensive, time consuming, and requires a steady-state plasma concentration and accurate and timed urine collection. • 99mTc-DTPA is recommended agent is for GFR measurement. • 5- 10% plasma protein binding, so it tends to underestimate the GFR(insignificant)
  • 14.
    • Peak renalactivity after 3 – 4 min. • 90 % filtered within 4 hours. • The extraction fraction of 99mTc-DTPA is approximately 20 per cent; for this reason, not useful for imaging , in patients with impaired renal function. Sr.Creat upto 3mg/dl. • In such cases, agents with higher extraction efficiencies such as 99mTc-MAG3 more appropriate. • 51Cr-EDTA, which may provide more accurate values for GFR, but cannot be used for imaging.
  • 15.
    2.Tubular secreting agents •Tc99m MAG3 • Tc99m EC • I131/I123 OIH
  • 16.
    Tc99m MAG3 • 70– 90 % PROTEIN BINDING • 89% TUBULAR SECRETION • 11% GLOMERULAR FILTRATION • Extraction fraction of 40-50%. • Provides a high target-to-background ratio, good image quality, and more accurate numerical values, particularly when the kidney function is low or immature • 5 TO 10 mCi i.v. ( ADULTS)
  • 17.
    EC: Ethylene cysteine •Metabolite of the L,L-ECD( ethylene cysteine dimer) with cortical uptake • Secretion in proximal convoluted tubules • Plasma protein binding is 50% • Exact excretion mechanism is not known • Clearance is 69-85% of OIH • Sr. Creat Upto 7mg/dl
  • 18.
    3.Cortical Binding Agents •Tc99m DMSA • Tc99m GHA
  • 19.
    Tc99m DMSA • PYELONEPHRITIS,INFARCTS, SCARS, ANOMALIES • 75% protien binding in 6 hrs • 5- 20 % excretion 2 hrs • 37% excretion in 24 hrs • 40-50% cortical localisation • Maximum activity at 3-6 hrs • 2 TO 5 mCi i.v. • Images at 2–4 hrs
  • 21.
    Basic Renal Scan •Procedure Patient Preparation Patient must be well hydrated Give 5-10 ml/kg water (2-4 cups 30-60 min) pre-injection Can measure U - specific gravity (<1.015) Void before injection Void at end of study
  • 22.
    Acquisition • Supine positionpreferred • Flow (angiogram) : 2-3 sec / fr x 1 min • Dynamic: 15-30 sec / frame x 20-30 min (display @ 1-3 min/frame) • Obtain a 30-60 sec. image over injection site at end of study (if infiltration >0.5% dose do not report clearance) • Obtain post-void supine image of kidneys at end of study
  • 23.
    Radionuclide Renal Evaluation A)FunctionalImaging(visual assessment of perfusion and function) B)Renography (time activity curve representative of renal function) C)Quantification of renal function(GFR & ERPF) D)Anatomic imaging( cortical imaging)
  • 24.
    A)Functional Imaging Perfusion imaging •Evaluation of renal blood flow and function of native kidneys – posterior projection ; transplanted kidneys – anterior projection • 10-20mCi of radiopharmaceutical injected iv in antecubital vein. • Imaging renal perfusion is usually begun as soon as bolus is seen in abdominal aorta • Subsequent images are taken every 1-5 secs
  • 25.
    • In normalrenal blood flow • By 3 sec aorta is fully visualized. • By 5-6 sec, both kidneys are seen. • Maximal kidney activity is reached in 30-60 sec.
  • 26.
    At the endof perfusion sequence Functional imaging • Dynamic or sequential static; 3-5 min Tc99m. • DTPA or MAG3 are then obtained over 20-30 mins. • Evaluation is similar to an IVP with – anatomy, position, symmetry and adequacy of function & collecting system patency. • With Tc99m MAG3 maximal parenchymal activity is seen at 3-5 min • Activity in collecting system and bladder by 4-8 mins.
  • 27.
  • 28.
    B)Renography • A TimeActivity Curve • Graphic representation of uptake and excretion of radiopharmaceutical • Information is displayed from time of injection to about 20-30 mins
  • 29.
    Renogram Phases FLOW PHASE •I.Vascular phase (RADIONUCLETIDE ANGIOGRAM) • Last for 30-60 sec. • Max activity 4-6 sec after peak aortic activity FUNCTIONAL PHASE 30 MIN • II. Parenchymal phase(uptake) • Max activity 3 to 5 min UPTAKE AT 2 TO 3 MIN FOR SPLIT FUNCTION • III. Washout (excretory) phase no activity after 30 min
  • 31.
    Data obtained fromrenogram • Time to peak cortical activity- 3-5 min • Half-time excretion- time for half of peak activity to be cleared from kidney. N – 8-12 mins • Cortical activity at 20 min/ peak activity :< 0.30 on MAG3 renogram.
  • 32.
    • RELATIVE/SPLIT FUNCTION •Contribution of each kidney to the total function % Lt kid = net cts in Lt ROI/net cts Lt + net cts Rt ROI x 100% • Normal 50/50 - 56/44 • Borderline 57/43 - 59/41 • Abnormal > 60/40
  • 35.
    C)Quantitation of RenalFunction GFR & ERPF measurement • Two methods : 1.Plasma sample based clearances : The amount of activity remaining in blood at prefixed times is a measurement of activity not yet cleared – indirect measure of activity already cleared. More accurate ,but requires determination of pharmaceuticals levels in plasma and some times in urine.
  • 36.
    2.Camera based clearances •Counts are obtained from syringe before inj. & subsequently over kidneys after injection. • No blood and urine collection. • Sufficiently reliable method
  • 37.
    D)Anatomic(Cortical) Imaging • (Tc99mDMSA or GH ) • Images obtained after 2 to 4 hrs of injection • Posterior/ right post. Oblique/ left post. Oblique NORMAL FINDINGS • Smooth contour with Homogeneous activity • Less uptake in medulla • No activity in PCS
  • 38.
    Diuretic (Furosemide) RenalScan • Obstructive uropathy (hydronephrosis, hydroureter) may lead to obstructive nephropathy (loss of renal function) • Indications: -Evaluate functional significance of hydronephrosis -Determine need for surgery -obstructive hydronephrosis - surgical Rx -non-obstructive hydronephrosis - medical Rx/ follow up -Monitor effect of therapy
  • 39.
    PRINCIPLE • Hydronephrosis -tracer pooling in dilated renal pelvis • Furesemide induces increased urine flow • If obstructed >>> will not wash out • If dilated, non-obstructed >>> will wash out • Can quantitate rate of washout (T1/2)
  • 40.
    PROTOCOL • Oral hydrationprior to study • NS @ 15ml/kg over 30 min 15 min prior to injection & continued in study @ 200ml/kg/24 hr • Bladder catheterization is required in children • Tc 99m MAG3 – agent of choice in children with limited function,high target-to-background ratio, good image quality, and more accurate numerical values
  • 41.
    • Pre requisite– residual function to respond • Diuretic given ( infants- 1mg/kg, children 0.5mg/kg, 40 mg adults ) 20-30 min after radiotracer injection • Imaging for 20 – 30 minutes, post micturition image • Functional images, renogram time/activity curve( before & after ), wash out half time calculated • Symmetric uptake and good washout is by definition not obstructed
  • 42.
    Diuretic Renal Scan •Washout •(diureticresponse) •T1/2 • time required for 50% tracer to leave • the dilated unit • i.e. time required for activity to fall • to 50% of peak
  • 43.
    •T1/2 • Normal <10 min • Obstructed > 20 min • Indeterminate 10 - 20 min
  • 44.
    Scintigraphic evaluation of Hydronephrosis •Showing non-obstructive hydronephrosis of the left kidney, • The arrow indicating a brisk response to intravenous diuretic.
  • 45.
    • Showing obstructivehydronephrosis of the right kidney, • The arrow indicating a no response to intravenous diuretic.
  • 46.
    “F minus 15”Diuretic • Renogram • Furosemide (Lasix) injected 15 min before radiopharmaceutical • Rationale: kidney in maximal diuresis,under maximal stress • Some equivocals will become clearly positive, some clearly negative
  • 47.
    Renal Cortical Scintigraphy •Indications • Determine involvement of upper tract (kidney) in acute UTI (acute pyelonephritis) • Detect cortical scarring (chronic pyelonephr.) • Follow-up post Rx
  • 48.
    • gold standard99mTc DMSA • The radiotracer is taken up only by functioning PCT mass • Pyelonephritis impairs tubular uptake of radiotracer, these areas appear as unexposed or underexposed • Persisting areas on follow up indicates irreversible renal damage or scarring.
  • 49.
    • Cold Defect -Acuteor chronic PN -Cyst -Tumors -Infarct -Trauma (contusion, laceration,hematoma) • Cortical defects are not always d/t infection & all DMSA defects are not necessarily scars.
  • 50.
  • 52.
    Renal Cortical Scintigraphy •Congenital Anomalies Agenesis Ectopy Fusion (horseshoe, crossed fused ectopia) Polycystic kidney Multicystic dysplastic kidney Pseudotumors (fetal lobulation, hypertrophic column of Bertin , lobar nephronia)
  • 53.
  • 54.
  • 55.
  • 56.
    Patient with RecurrentUTI • Tc99m-DMSA renal SPECT scintigraphy • Ectopic left kidney with multiple scars
  • 57.
    Renal transplants scintigraphy •Surgical complications • Urinary leak-Initial photopenic defect with progressive accumulation of radiotracer • Hematoma/ Abscess- Initial photopenic defect not changing with time. • Lymphocele- Initial photopenic defect- equal to background activity in delayed images. • Ureteral obstruction • Arterial stenosis and hypertension
  • 58.
  • 59.
  • 60.
  • 61.
    Conclusion • Role ofnuclear medicine – in investigation of renal parenchymal function and upper urinary tract abnormalities • Radiation burden low • Do not require sedation or specific patient preparation • Easy to perform • Knowledge of renal patho-physiology and recognition of limitation and technical pitfalls is essential