Downloaded 192 times

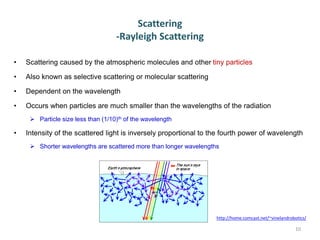
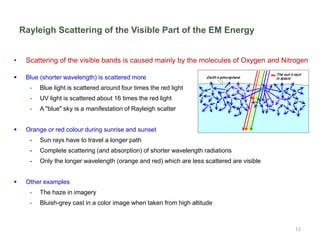
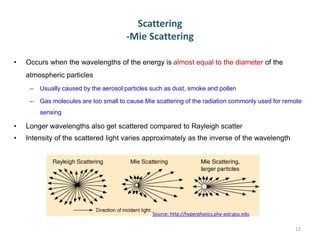


Remote sensing provides data for large areas, including remote and inaccessible regions, in a continuous and inexpensive manner through rapid collection and interpretation of imagery. However, remote sensing data requires skilled interpretation and may need to be verified with field data due to potential misclassification, confusion between data sources, and image distortions. Electromagnetic radiation interacts with atmospheric particles through scattering and absorption processes like Rayleigh scattering and Mie scattering that depend on radiation wavelength and atmospheric conditions.