The document discusses the application of Geographic Information Systems (GIS) and remote sensing in water resource management, emphasizing their importance in natural resource management, decision-making, and environmental protection. It outlines the seven essential elements of the remote sensing process and the methodologies used for image classification, as well as the significance of GIS as a system for spatial data analysis and management. Additionally, various applications of GIS in fields such as agriculture, urban planning, and disaster management are highlighted, showcasing its benefits in enhancing decision-making and efficiency.
PRESENTATION ON APPLICATIONOF GIS, REMOTE
SENSING ON WATER RESOURCES
THE ITEC/SCAAP TRAINING PROGRAMME:
(SPECIALIZED PROGRAMME ON APPLICATION DEVELOPMENT
USING GIS AND REMOTE SENSING) UNDER THE GOVERNMENT
OF INDIA
AT
CENTRE FOR DEVELOPMENT ADVANCING COMPUTING (CDAC),
NOIDA, INDIA
JUNE, 2016
BY
Y. H.Mamdam
2.
What is RemoteSensing
"Remote sensing is the science (and to
some extent, art) of acquiring
information about the Earth's surface
without actually being in contact with
it. This is done by sensing and
recording reflected or emitted energy
and processing, analyzing, and
applying that information.“
3.
What is RemoteSensing
According to the United Nations (95th
Plenary meeting, 3rd December,
1986), Remote Sensing means
sensing of earth’s surface from space
by making use of the properties of
electromagnetic wave emitted,
reflected or diffracted by the sensed
objects, for the purpose of improving
natural resource management, land
use and the protection of the
environment.
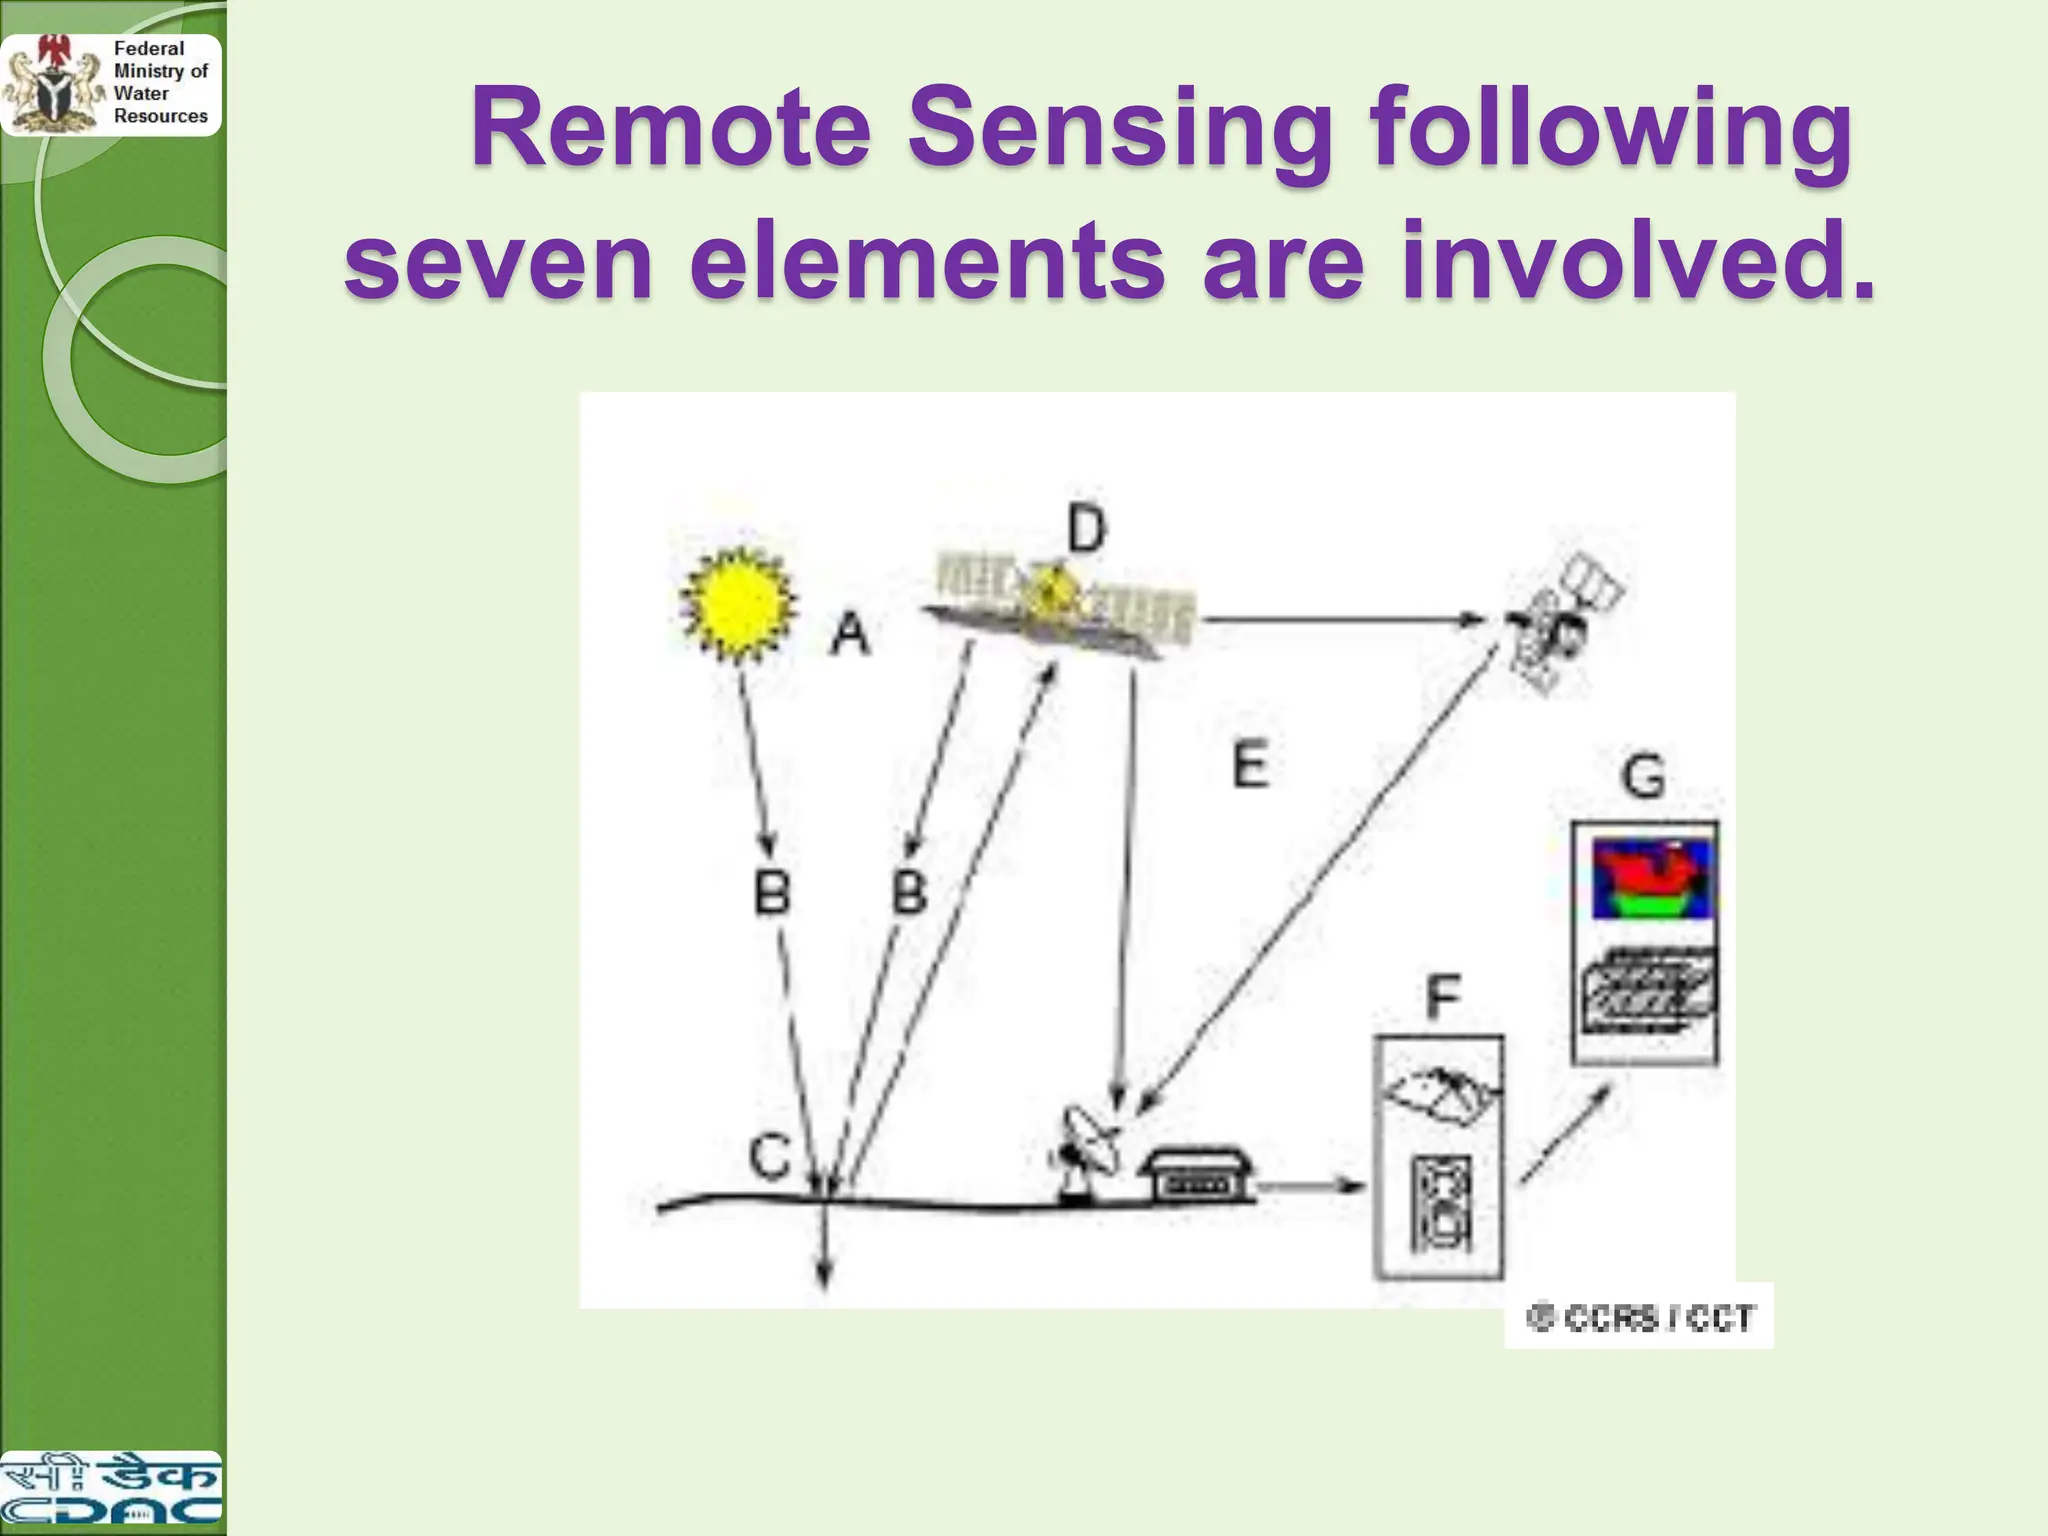
1. Energy Sourceor Illumination (A)
The first requirement for remote sensing is to
have an energy source which illuminates or
provides electromagnetic energy to the
target of interest.
2. Radiation and the Atmosphere (B)
As the energy travels from its source to the
target, it will come in contact with and
interact with the atmosphere it passes
through. This interaction may take place a
second time as the energy travels back
from the target to the sensor.
6.
3. Interaction withthe Target (C)
Once the energy makes its way to the
target through the atmosphere, it
interacts with the target depending on
the properties of both the target and the
radiation.
After the energy has been scattered
by, or emitted from the target, we
require a sensor (remote - not in
contact with the target) to collect and
record the electromagnetic radiation.
4. Recording of Energy by the Sensor
(D)
7.
5. Transmission, Reception,and
Processing (E)
The energy recorded by the sensor has
to be transmitted, often in electronic
form, to a receiving and processing
station where the data are processed
into an image.
6. Interpretation and Analysis (F)
The processed image is interpreted,
visually and/or digitally to extract
information about the target which was
illuminated.
Department Of Water Quality Control & Sanitation
8.
7. Application (G)
The final element of the remote sensing
process is achieved when we apply the
information we have been able to extract
from the imagery about the target in order
to better understand it, reveal some new
information, or assist in solving a
particular problem. These seven
elements comprise the remote sensing
process from beginning to end.
9.
Field surveyconducted covering most of major
Water sources/points. During the field survey GPS
is used to locate the positions in terms of latitude
and longitude. This information used in classifying
the satellite data. These GPS points have been
used as signatures for policies/decision making
areas.
Classification of Soil
Disaster management
Weather forecasting
Detecting and extent of oil spills in the sea
Violation of law
- Any illegal mining in the remote area can be
demarcated
APPLICATIONS TO WATER RESOURCES
10.
In thefield of Geology
Land cover planning
Potential to fishing zone
Agriculture
◦ Crop Acreage Estimation
◦ Crop Health Monitoring
◦ Crop Yield and Production
◦ Agro Ecological zonation Mapping
OTHER AREAS OF APPLICATIONS
11.
Methodology
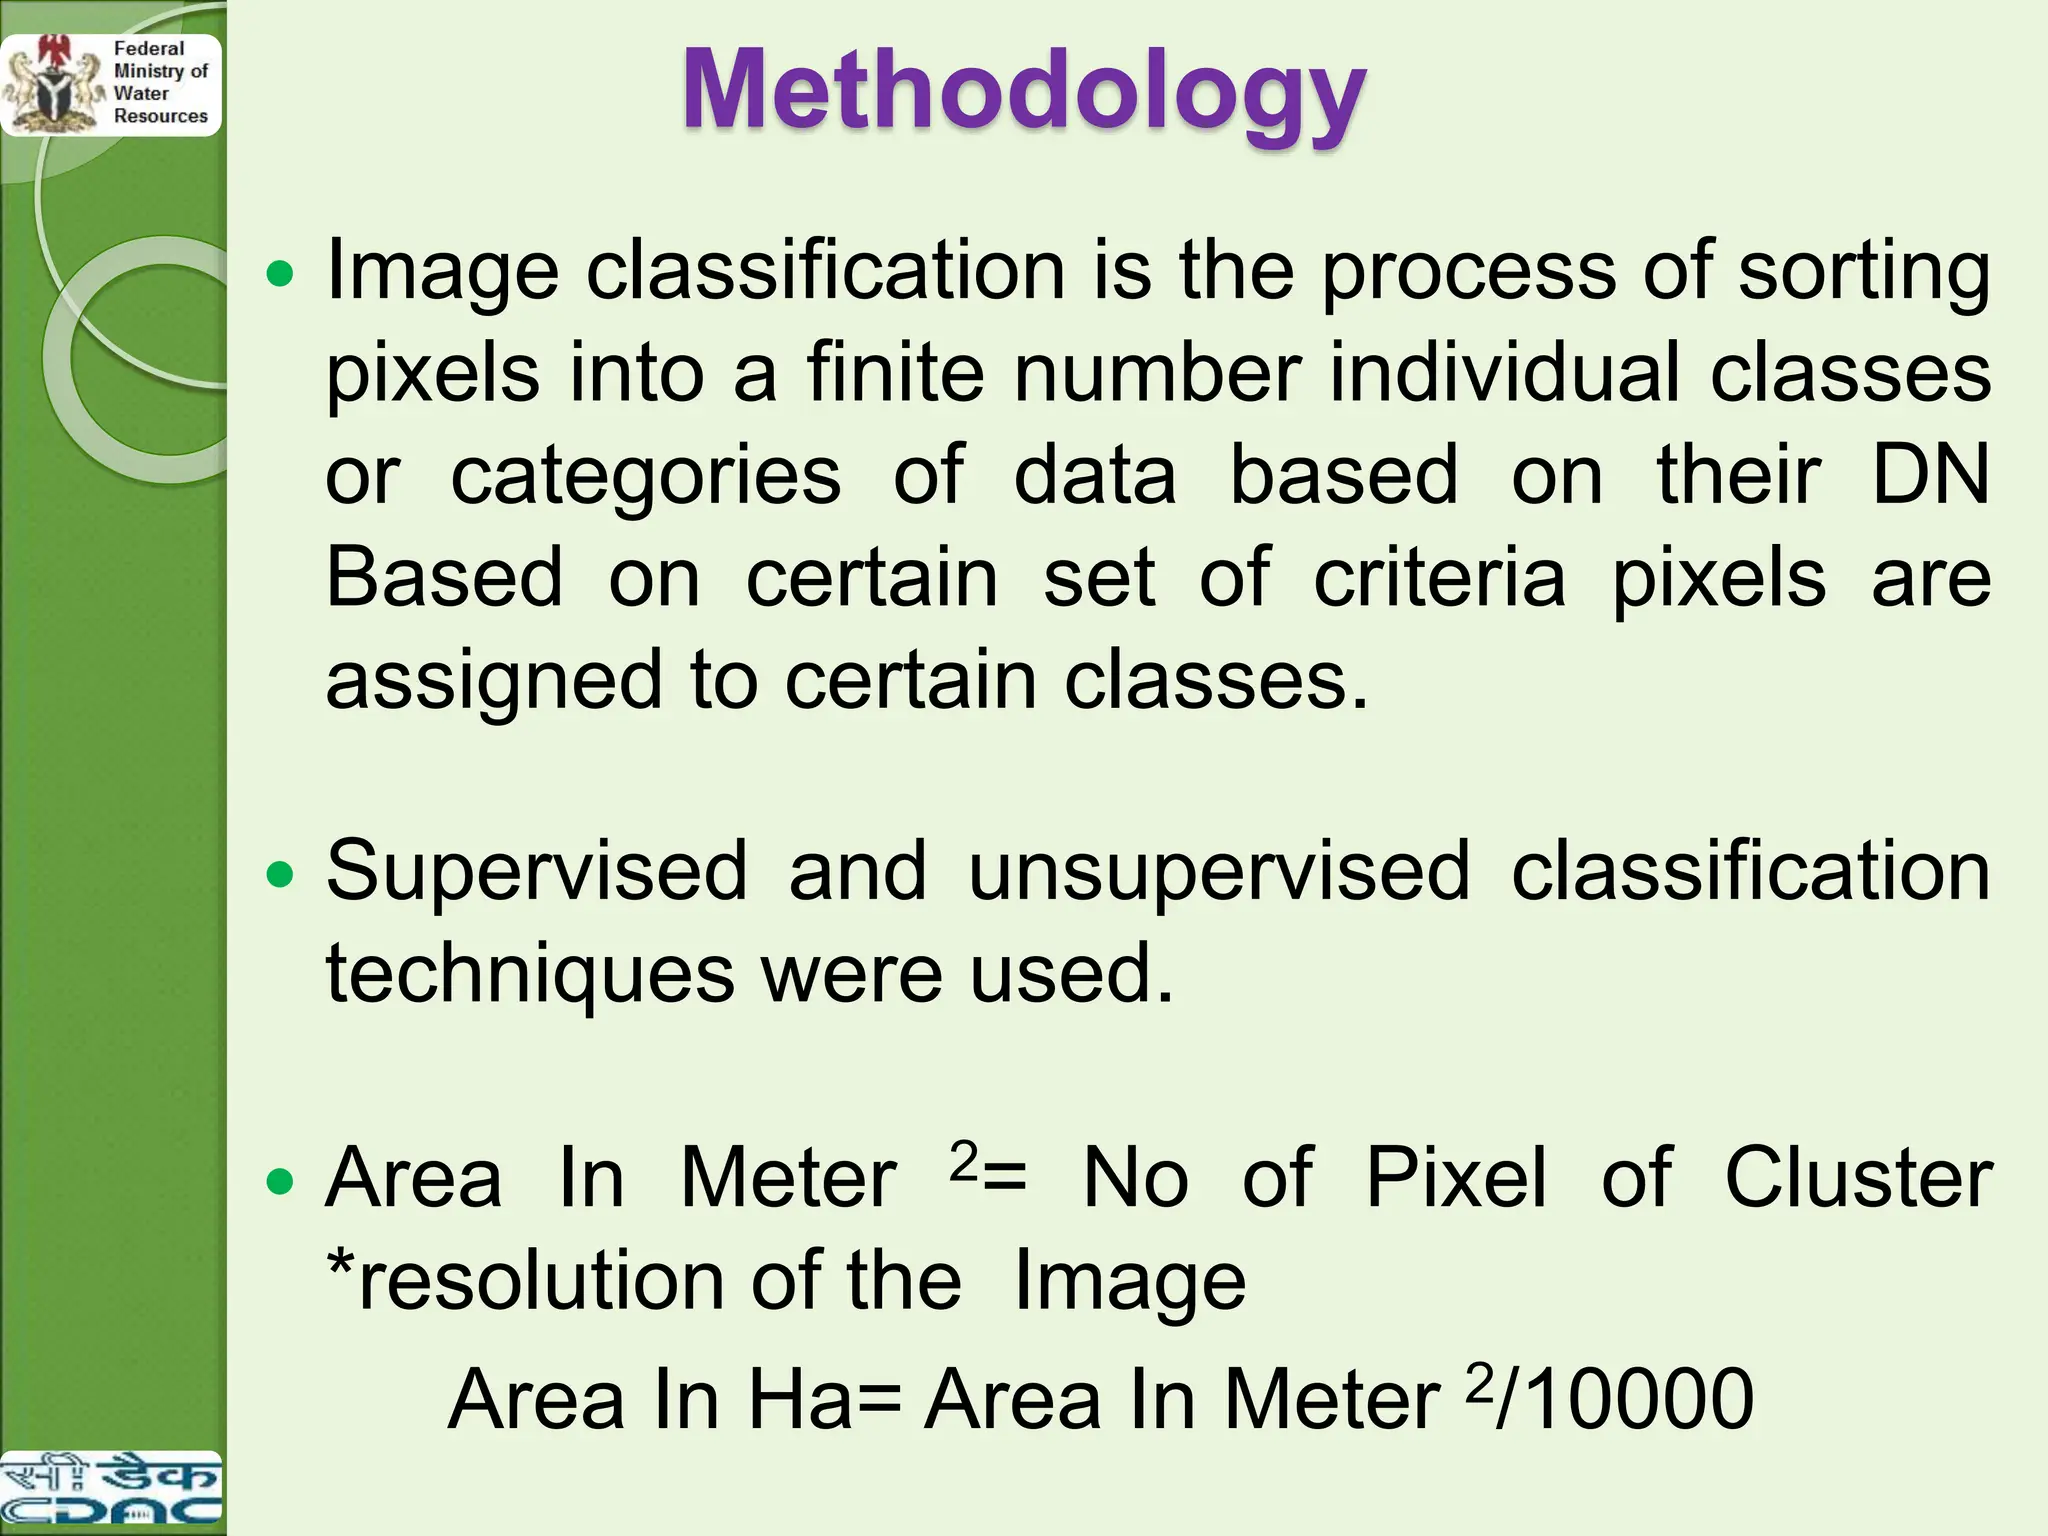
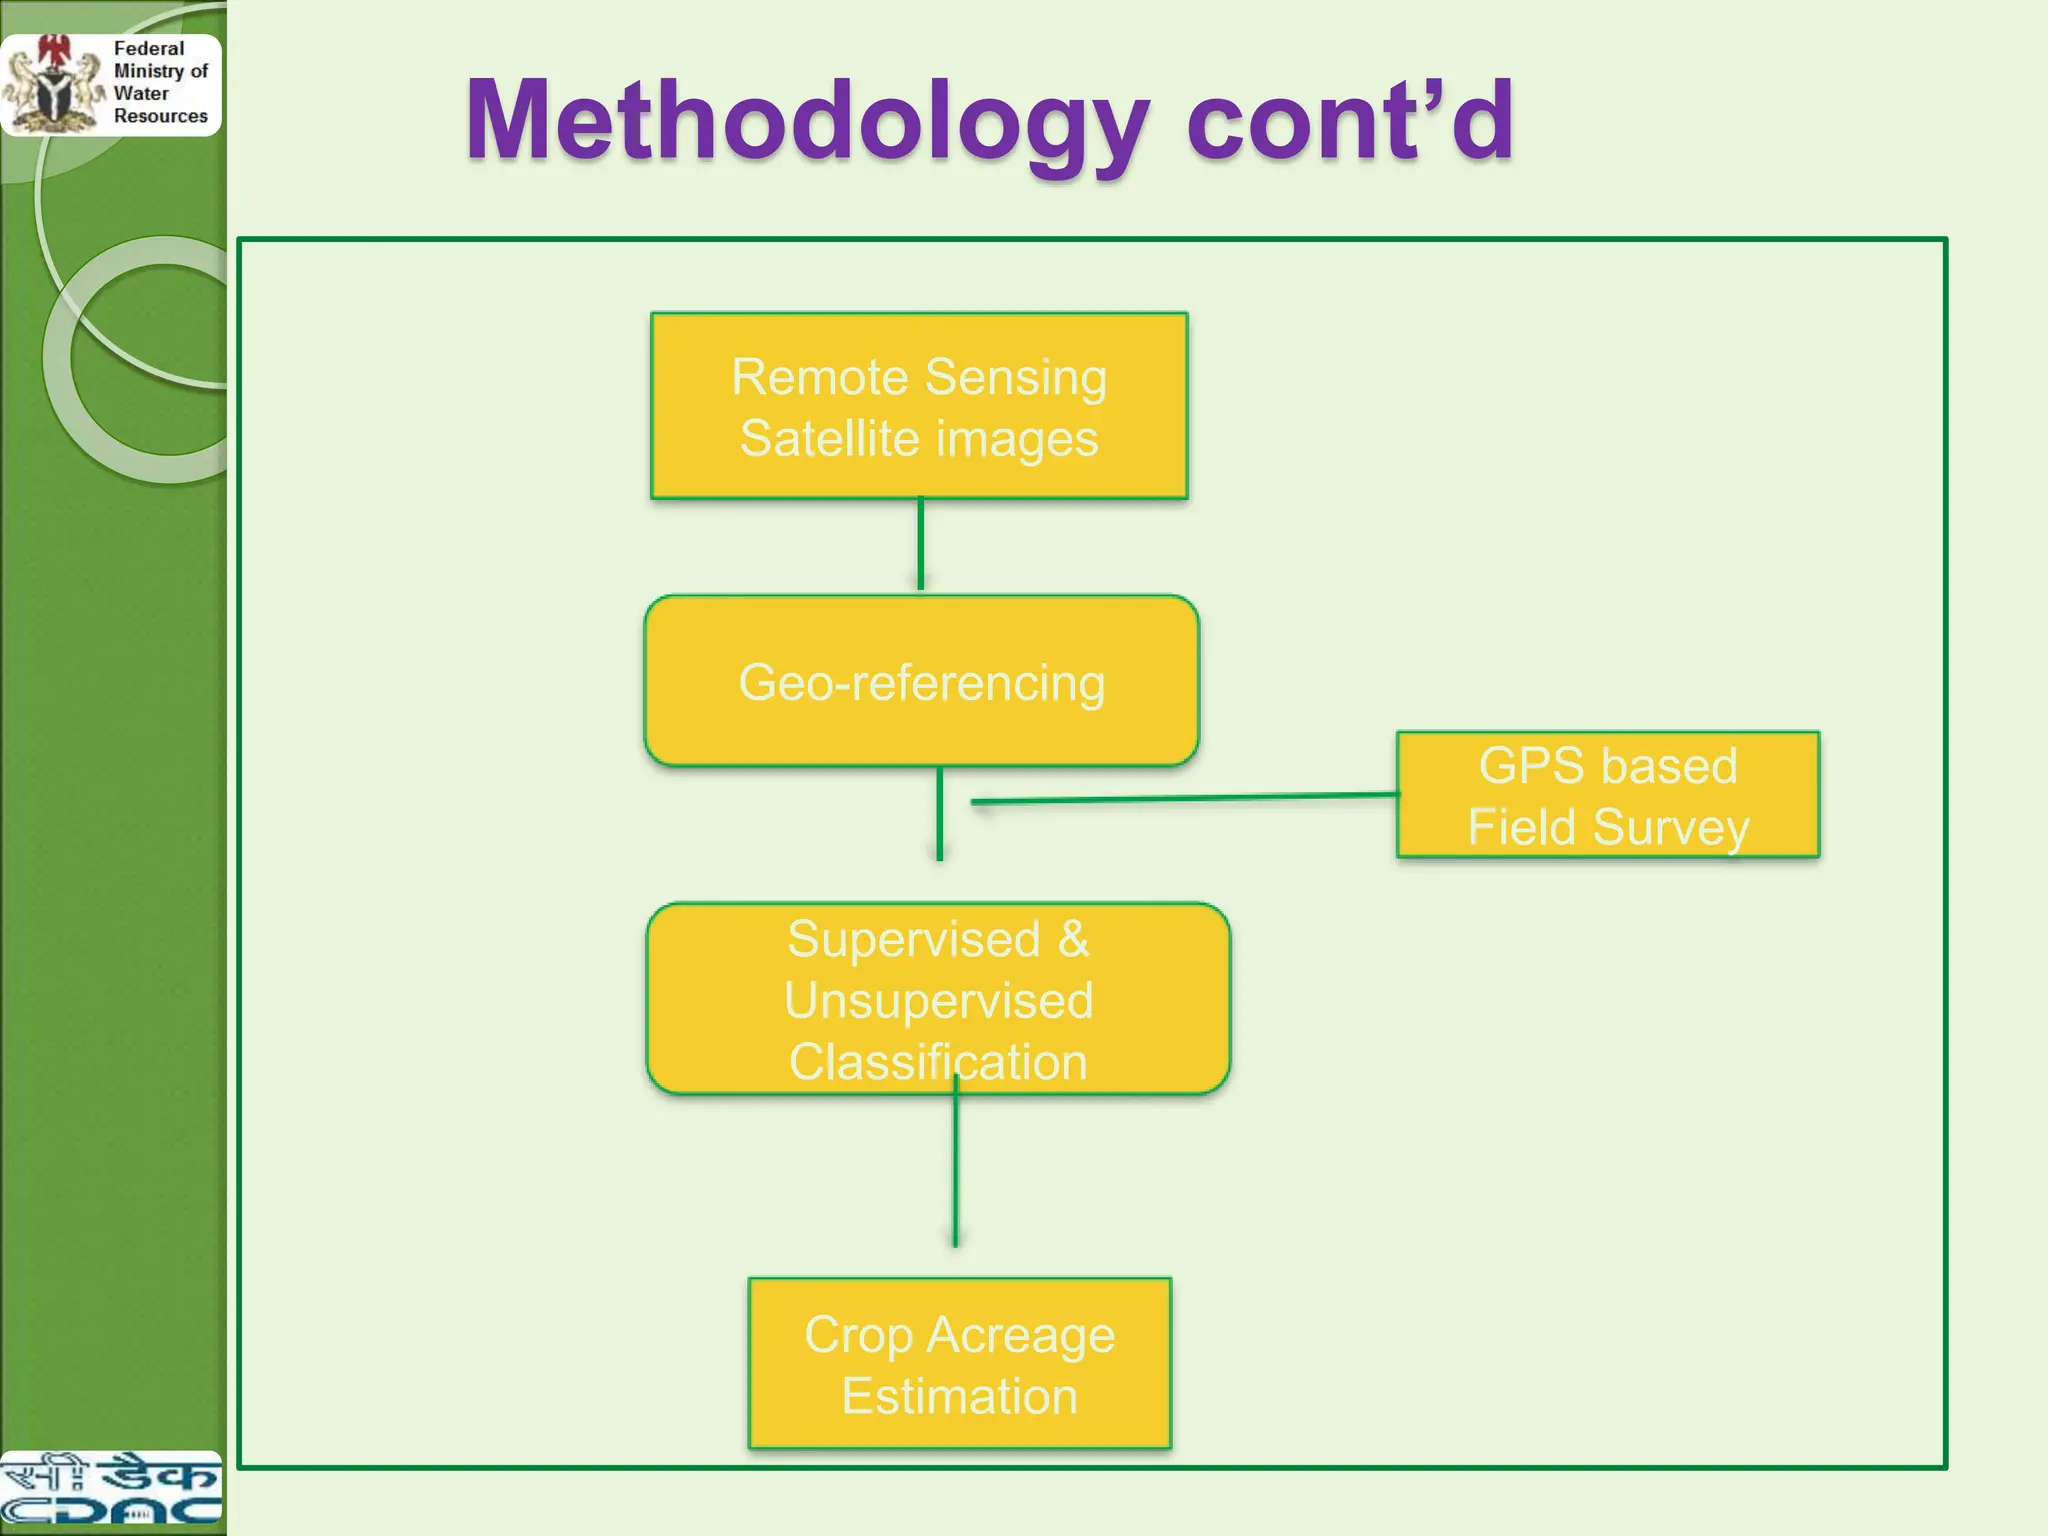
Image classificationis the process of sorting
pixels into a finite number individual classes
or categories of data based on their DN
Based on certain set of criteria pixels are
assigned to certain classes.
Supervised and unsupervised classification
techniques were used.
Area In Meter 2= No of Pixel of Cluster
*resolution of the Image
Area In Ha= Area In Meter 2/10000
GIS
There isa great impact of spatial information on our lives
than we realize.
The geographic knowledge is most often required in our
routine tasks, like finding a route in an unfamiliar town or
searching for the nearest hospital in case of health hazard.
An appropriate tool is required for the handling and
processing of the large volume of the spatial data.
The invention of computer assisted cartography led to the
development of many new tools for spatial analysis of the
data using statistical methods and time series
analyses and produces the digital maps which are always
easy to display spatial data from the real world and analyze
for the particular purpose.
15.
GIS Definition andRelated Terminologies
• Geographic information Systems (GIS) a tool for spatial data
handling also known as Geographical Information System,
Geomatics, geo-informatics, spatial Information System.
The year 1960 saw the
development of the
world's first true
operational GIS, but was
limited only to general
purpose computer
mapping applications and
were used in a small
number of government
agencies and universities
16.
GIS Definitions
Asystem of hardware, software and procedures designed to
support the capture, management, manipulation, analysis
modeling and display of spatially referenced data for
solving complex planning and management problems.
A computer system capable of assembling, storing
manipulating and displaying geographically referenced
information i.e. data identified according to their location.
A powerful set of fools for collecting, storing, and
retrieving at will and transforming and displaying
spatial data from the real world (Burrough 1987).
17.
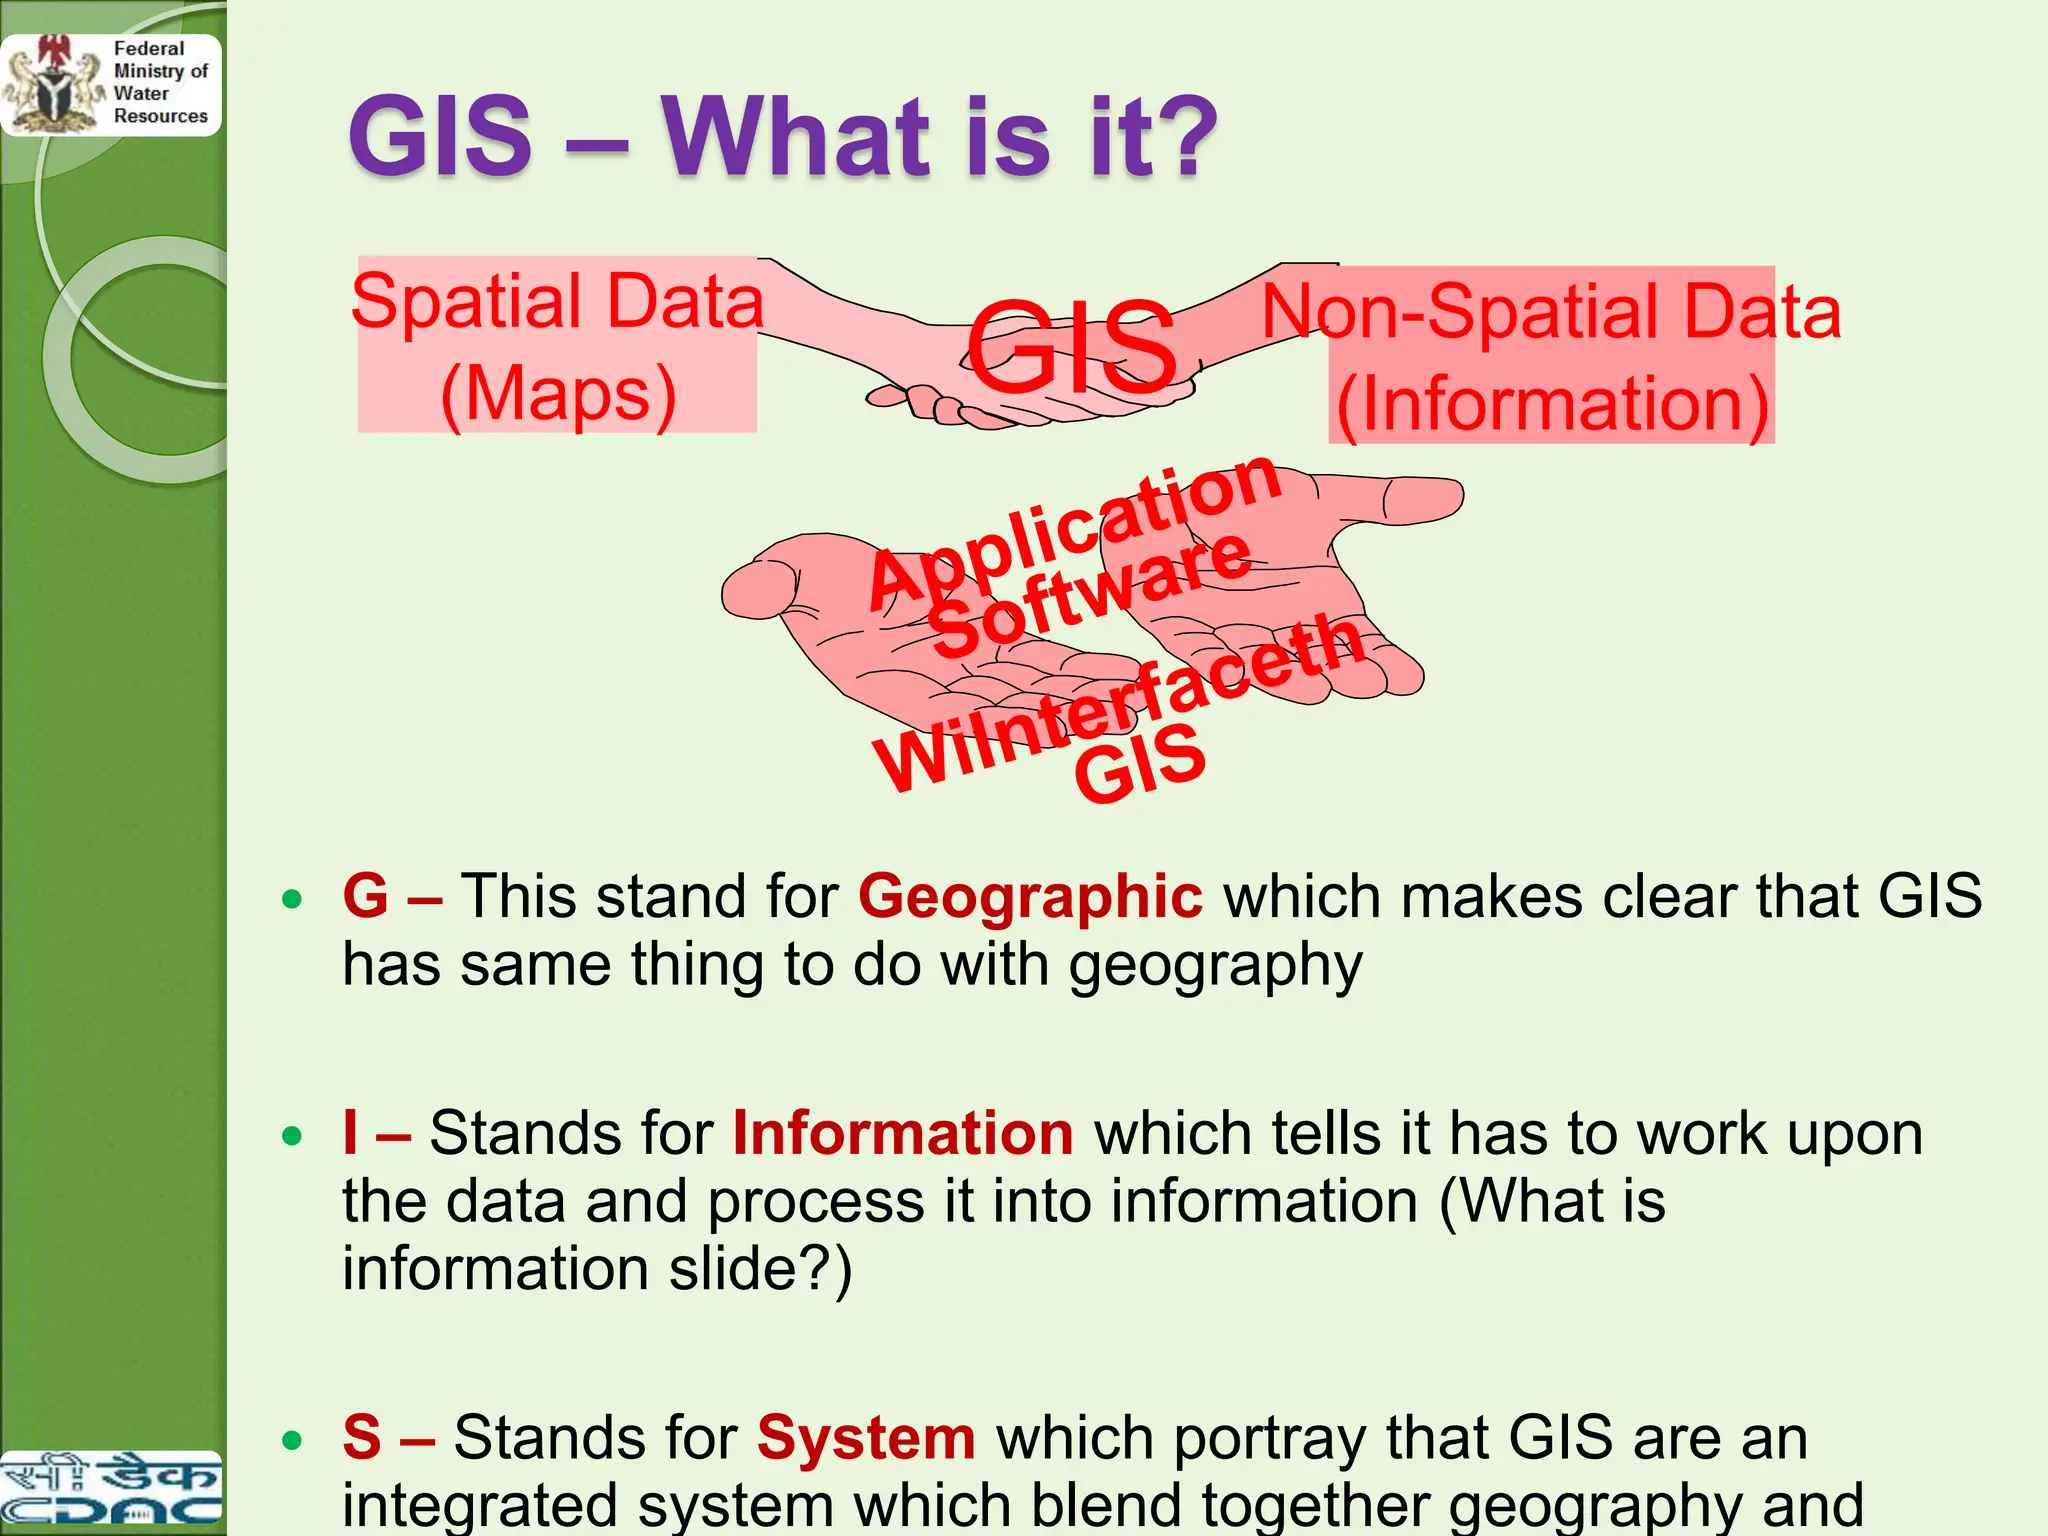
GIS – Whatis it?
G – This stand for Geographic which makes clear that GIS
has same thing to do with geography
I – Stands for Information which tells it has to work upon
the data and process it into information (What is
information slide?)
S – Stands for System which portray that GIS are an
integrated system which blend together geography and
GIS
Spatial Data
(Maps)
Non-Spatial Data
(Information)
18.
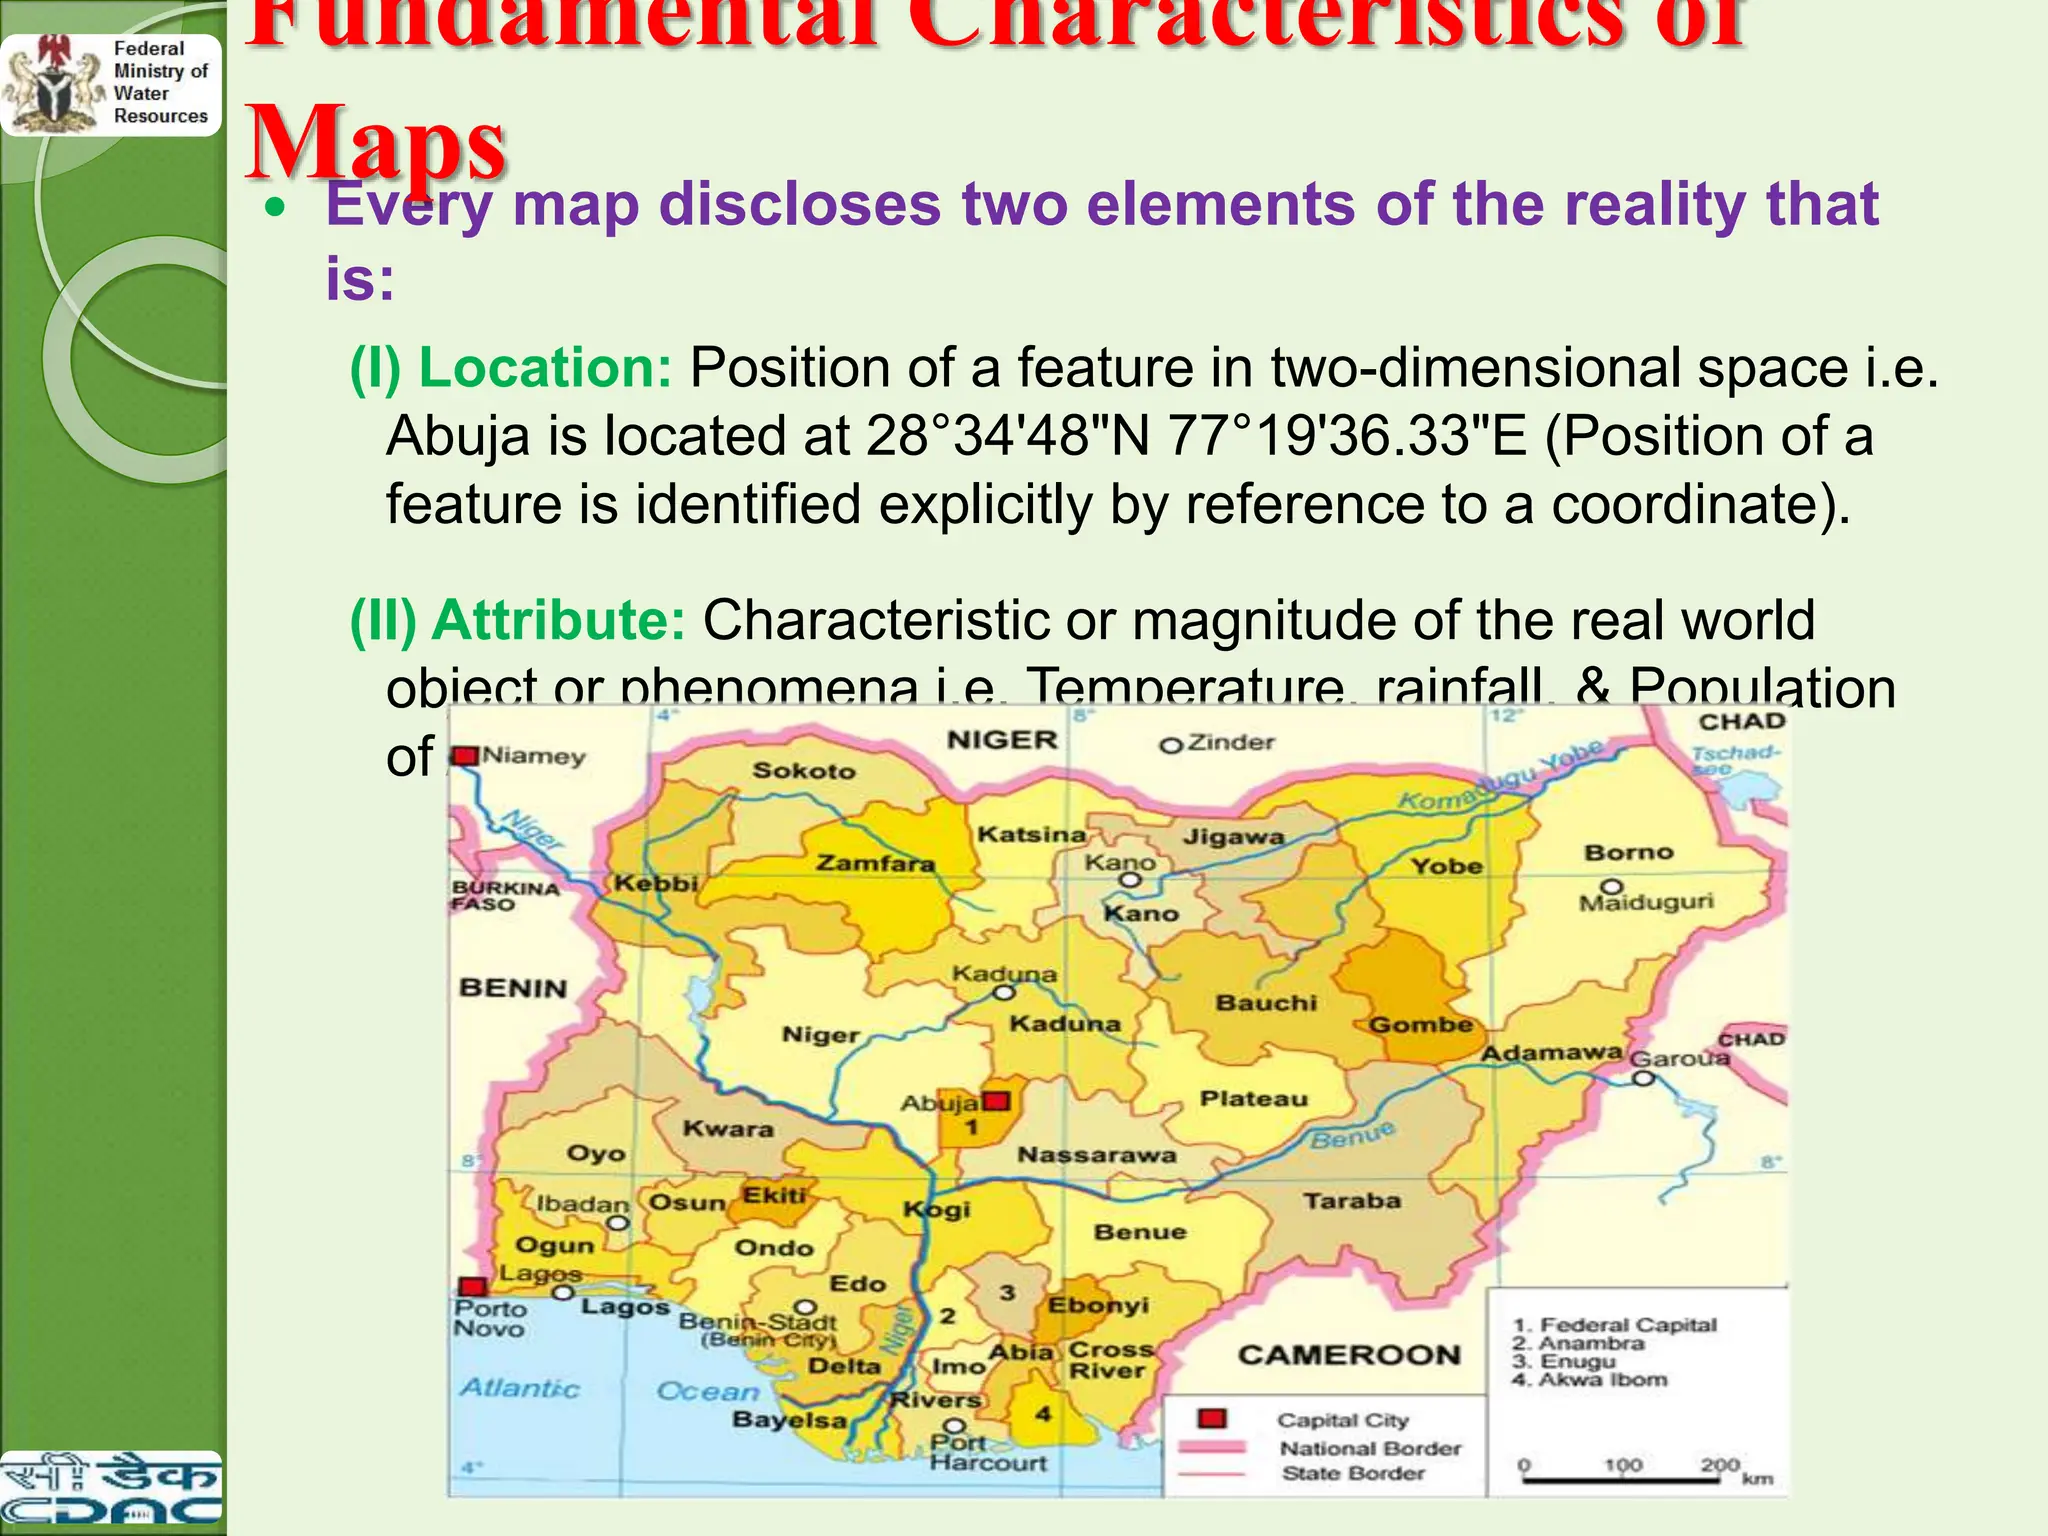
Every mapdiscloses two elements of the reality that
is:
(I) Location: Position of a feature in two-dimensional space i.e.
Abuja is located at 28°34'48"N 77°19'36.33"E (Position of a
feature is identified explicitly by reference to a coordinate).
(II) Attribute: Characteristic or magnitude of the real world
object or phenomena i.e. Temperature, rainfall, & Population
of Abuja.
Fundamental Characteristics of
Maps
19.
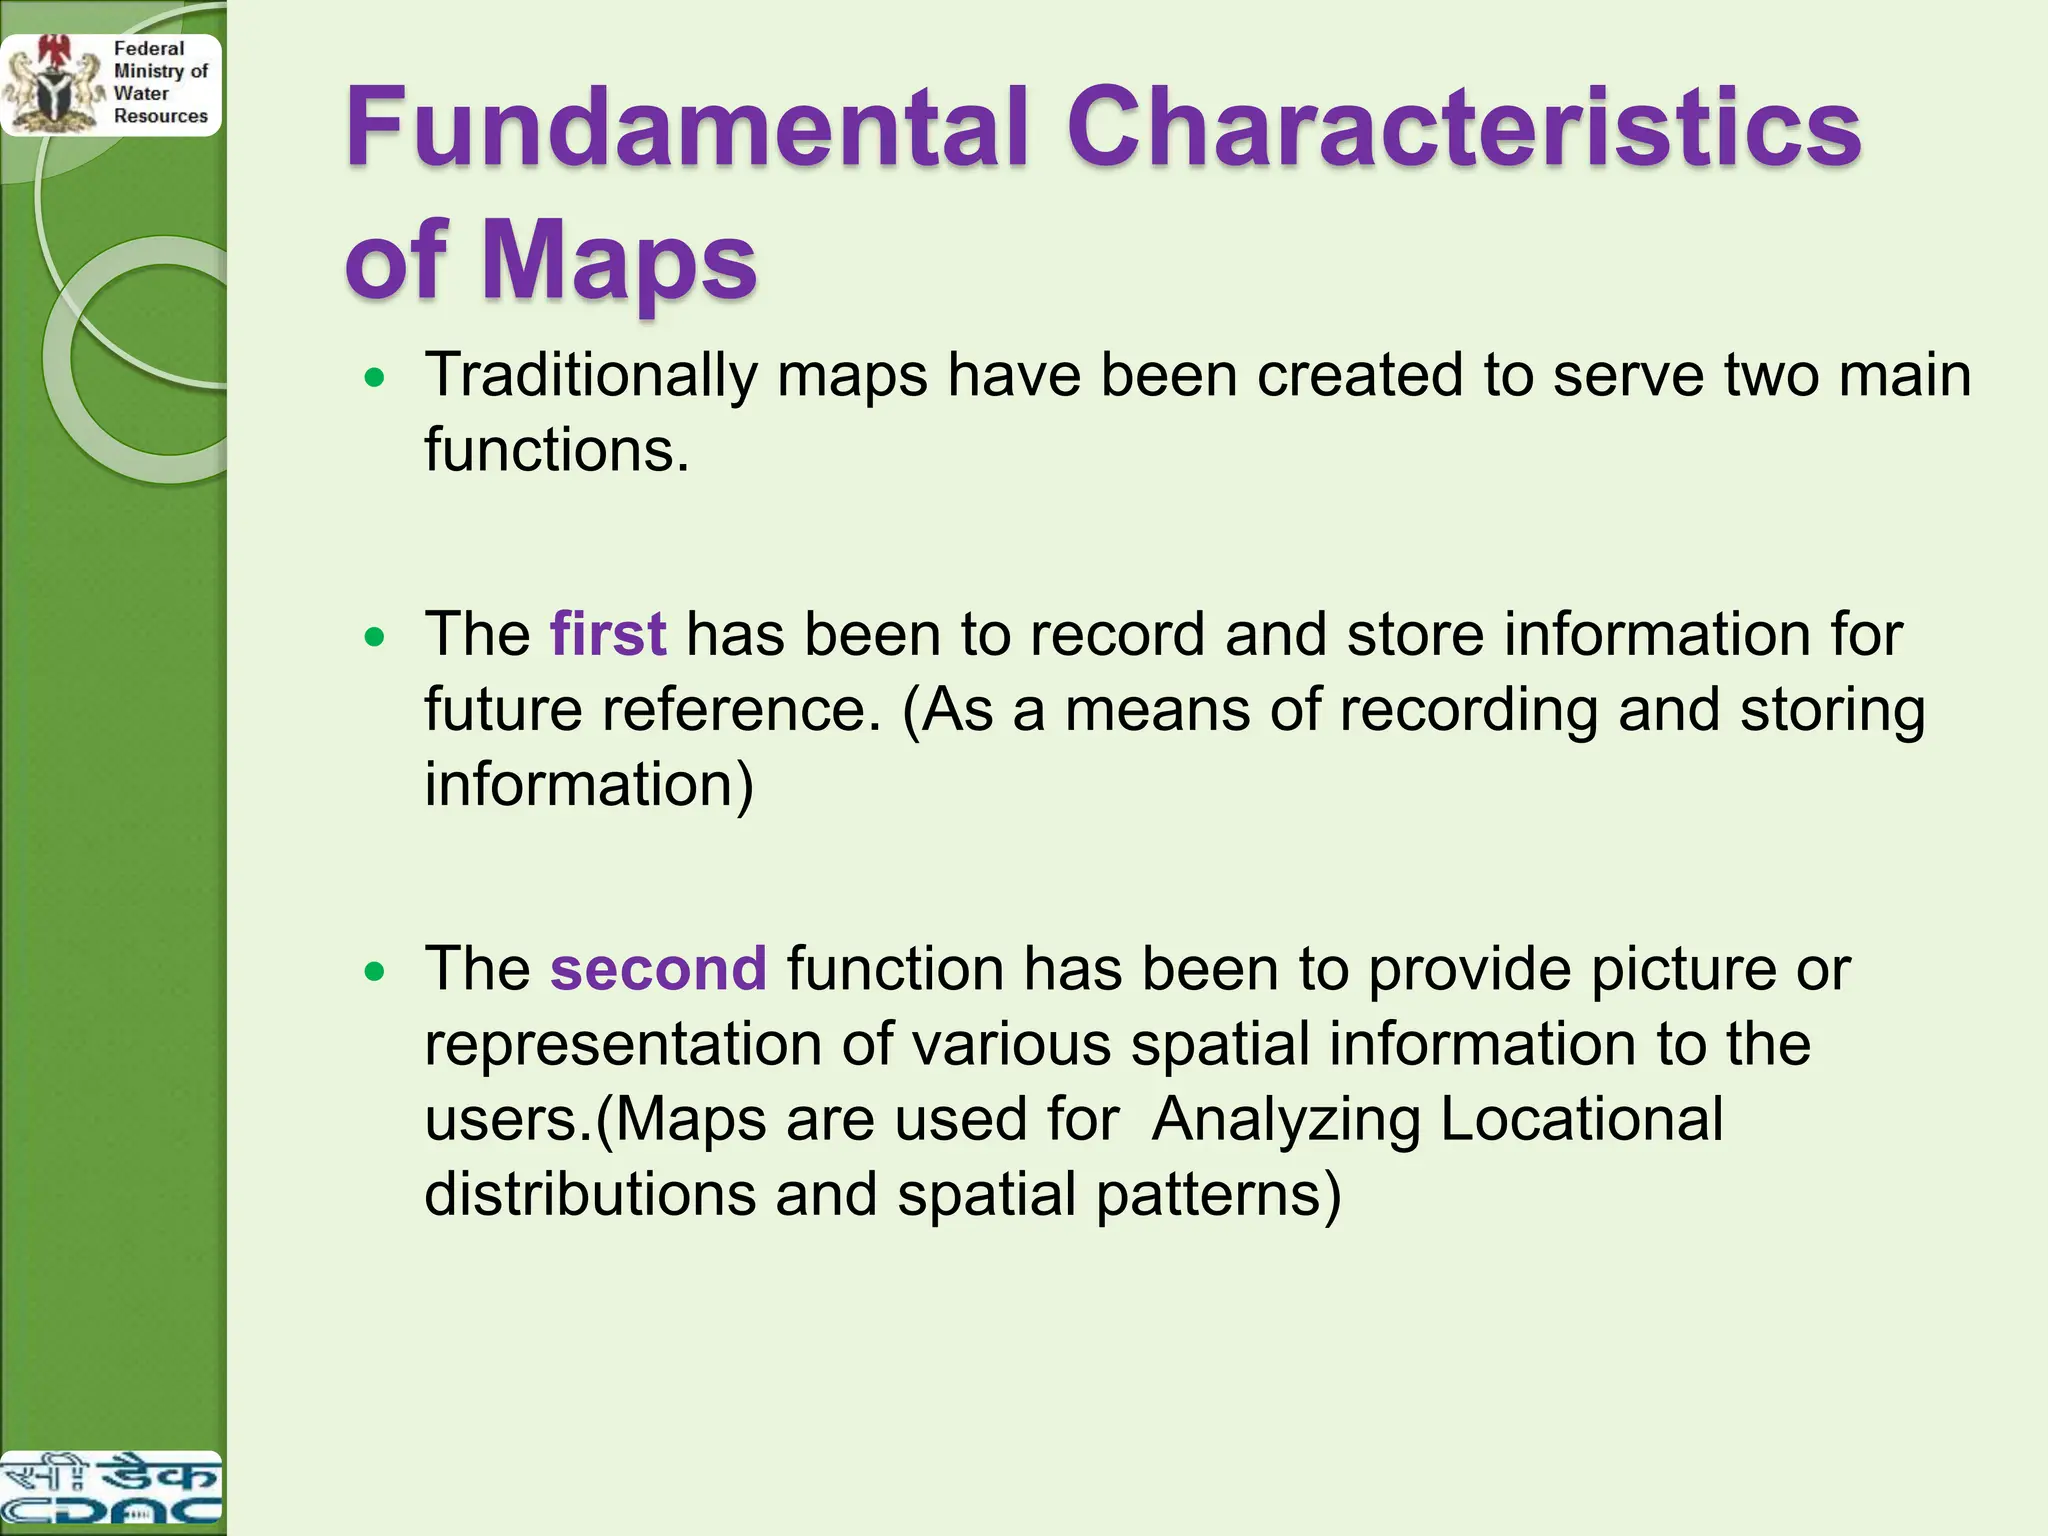
Fundamental Characteristics
of Maps
Traditionally maps have been created to serve two main
functions.
The first has been to record and store information for
future reference. (As a means of recording and storing
information)
The second function has been to provide picture or
representation of various spatial information to the
users.(Maps are used for Analyzing Locational
distributions and spatial patterns)
20.
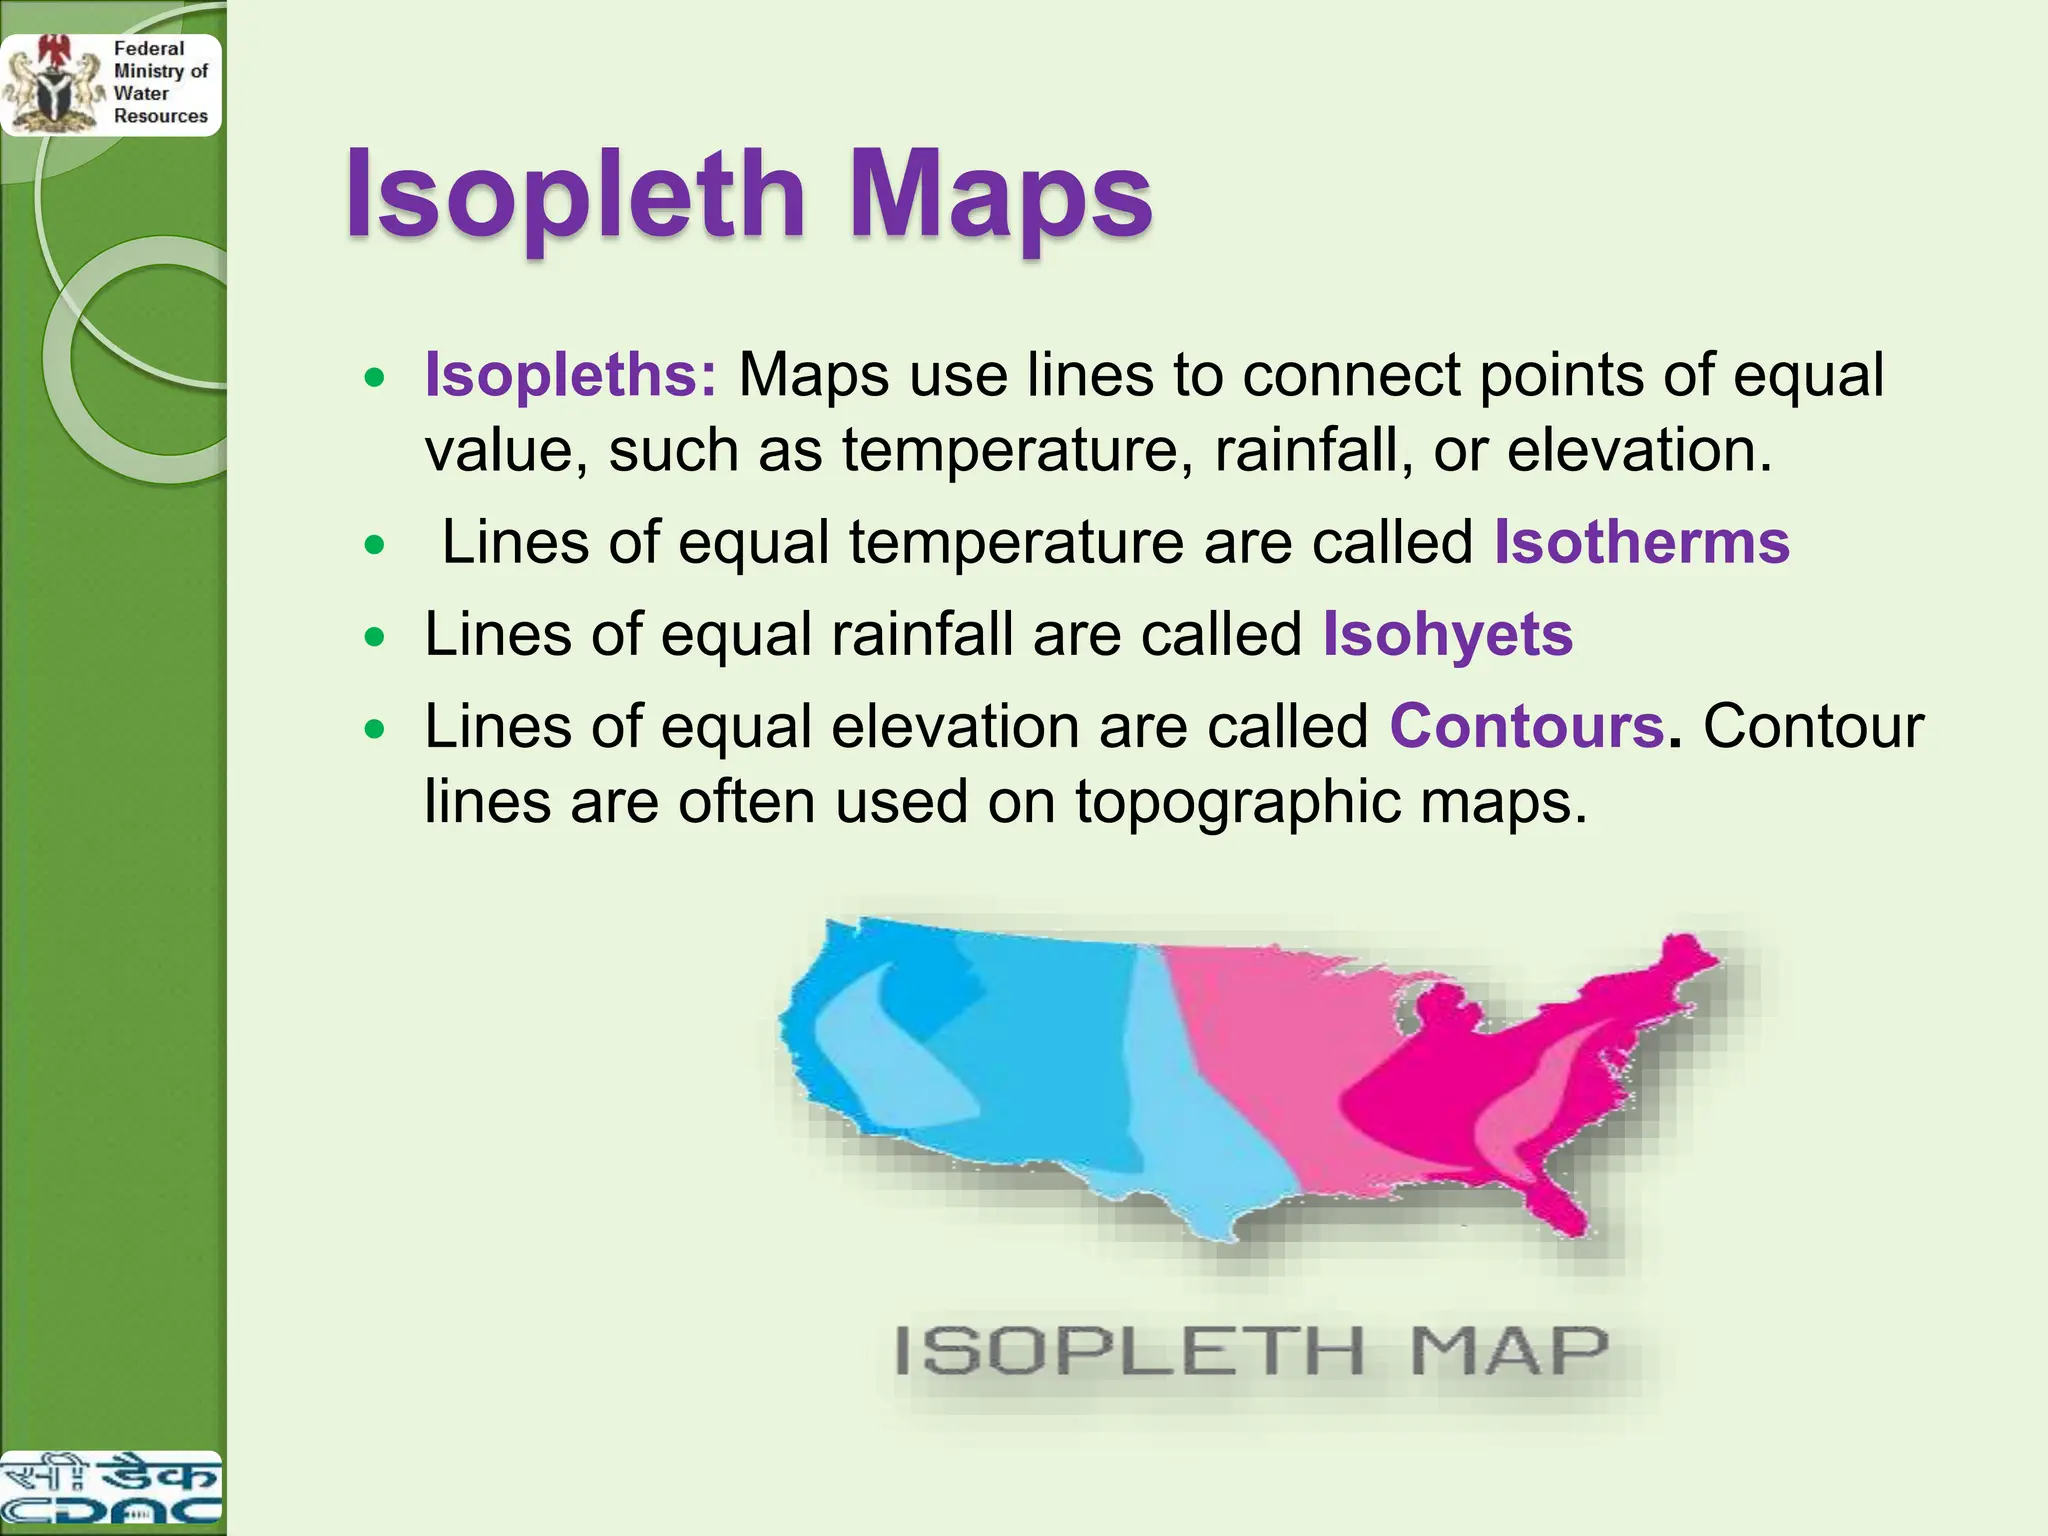
Isopleth Maps
Isopleths:Maps use lines to connect points of equal
value, such as temperature, rainfall, or elevation.
Lines of equal temperature are called Isotherms
Lines of equal rainfall are called Isohyets
Lines of equal elevation are called Contours. Contour
lines are often used on topographic maps.
21.
Map Scale andGIS
As the denominator of the representative fraction gets larger and the
ratio gets smaller, the scale of the map decreases.
A small scale map would be more generalized
A large scale map will be less generalized
The traditional concept of scale in terms of distance does not apply
in GIS, because the scale of a digital map is not fixed.
By performing zooming operations like zoom in and out, the map
can be shown at any scale in GIS.
In a GIS, the term scale is used to indicate the scale of the data
from which the map was captured.
22.
Some EssentialMap Elements are as follows:
◦ Title
◦ Scale
◦ North arrow
◦ Legend
◦ Grid Or Location information (e.g. Latitude and
Longitude)
Some additional Map Elements are as follows that may
or may not be present on a map:
◦ Neat line, Insets, Graphs, Text, Border etc.
Map Elements
23.
Geographic Data versus
GeographicInformation
Geographic data are the raw materials from which geographic
information systems are developed.
Spatial data sets are unique in providing geographic location and
their features related to known coordinate systems, specifying the
attributes that may be independent of location such as color cost
and size and in describing the spatial and topological relations
among features in the dataset.
24.
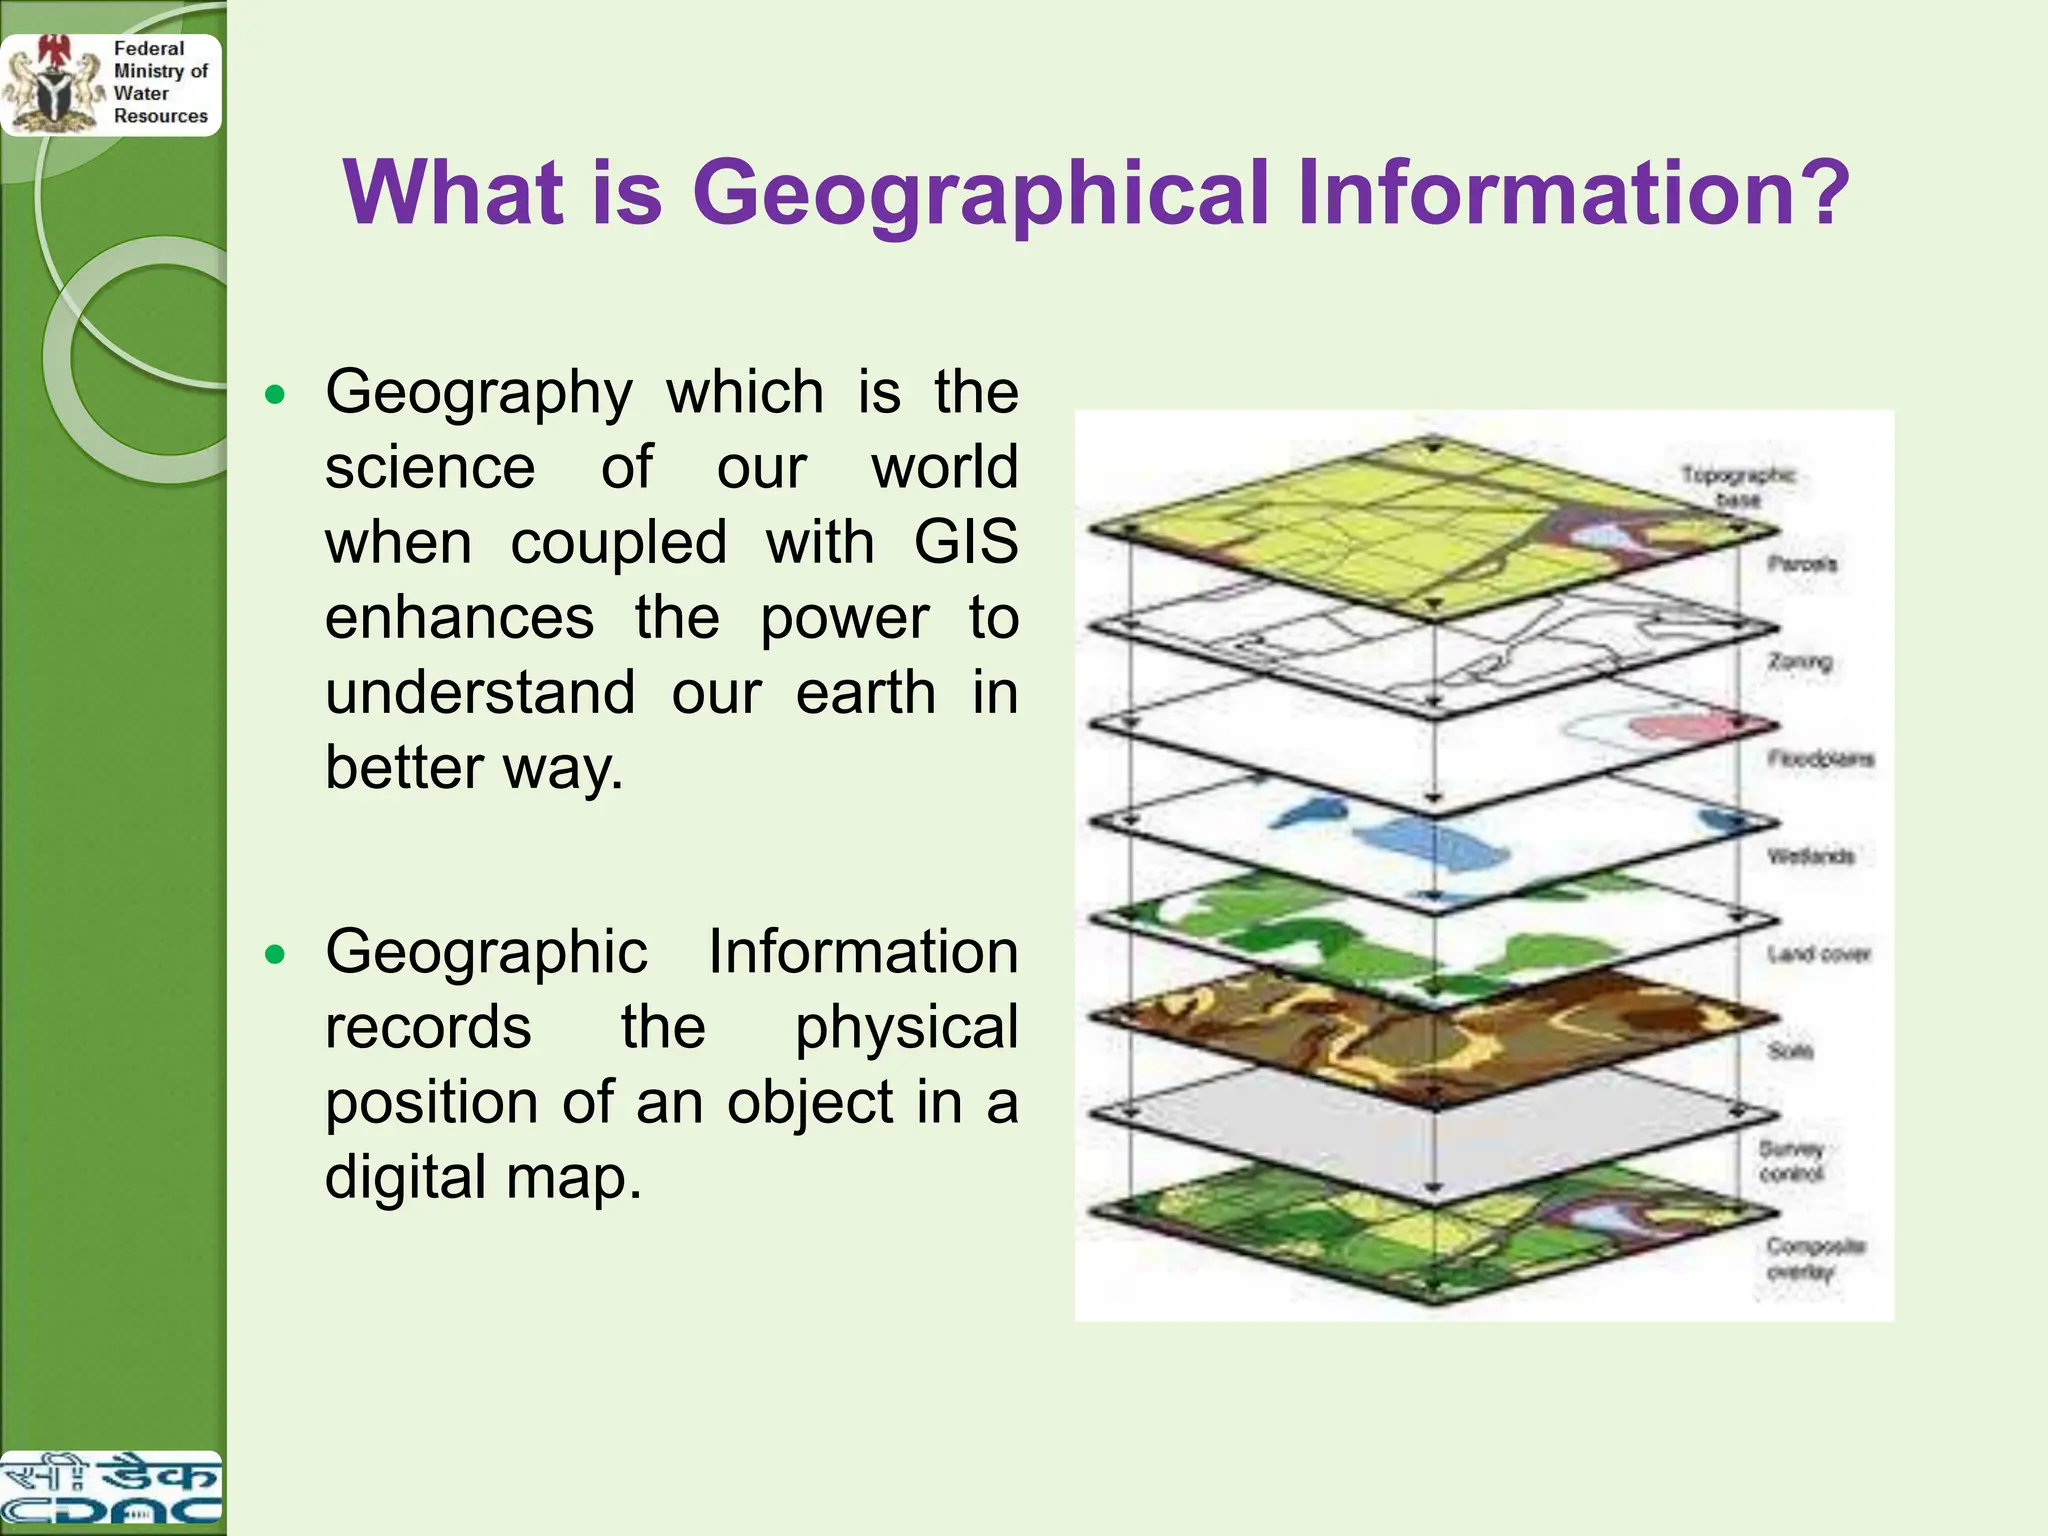
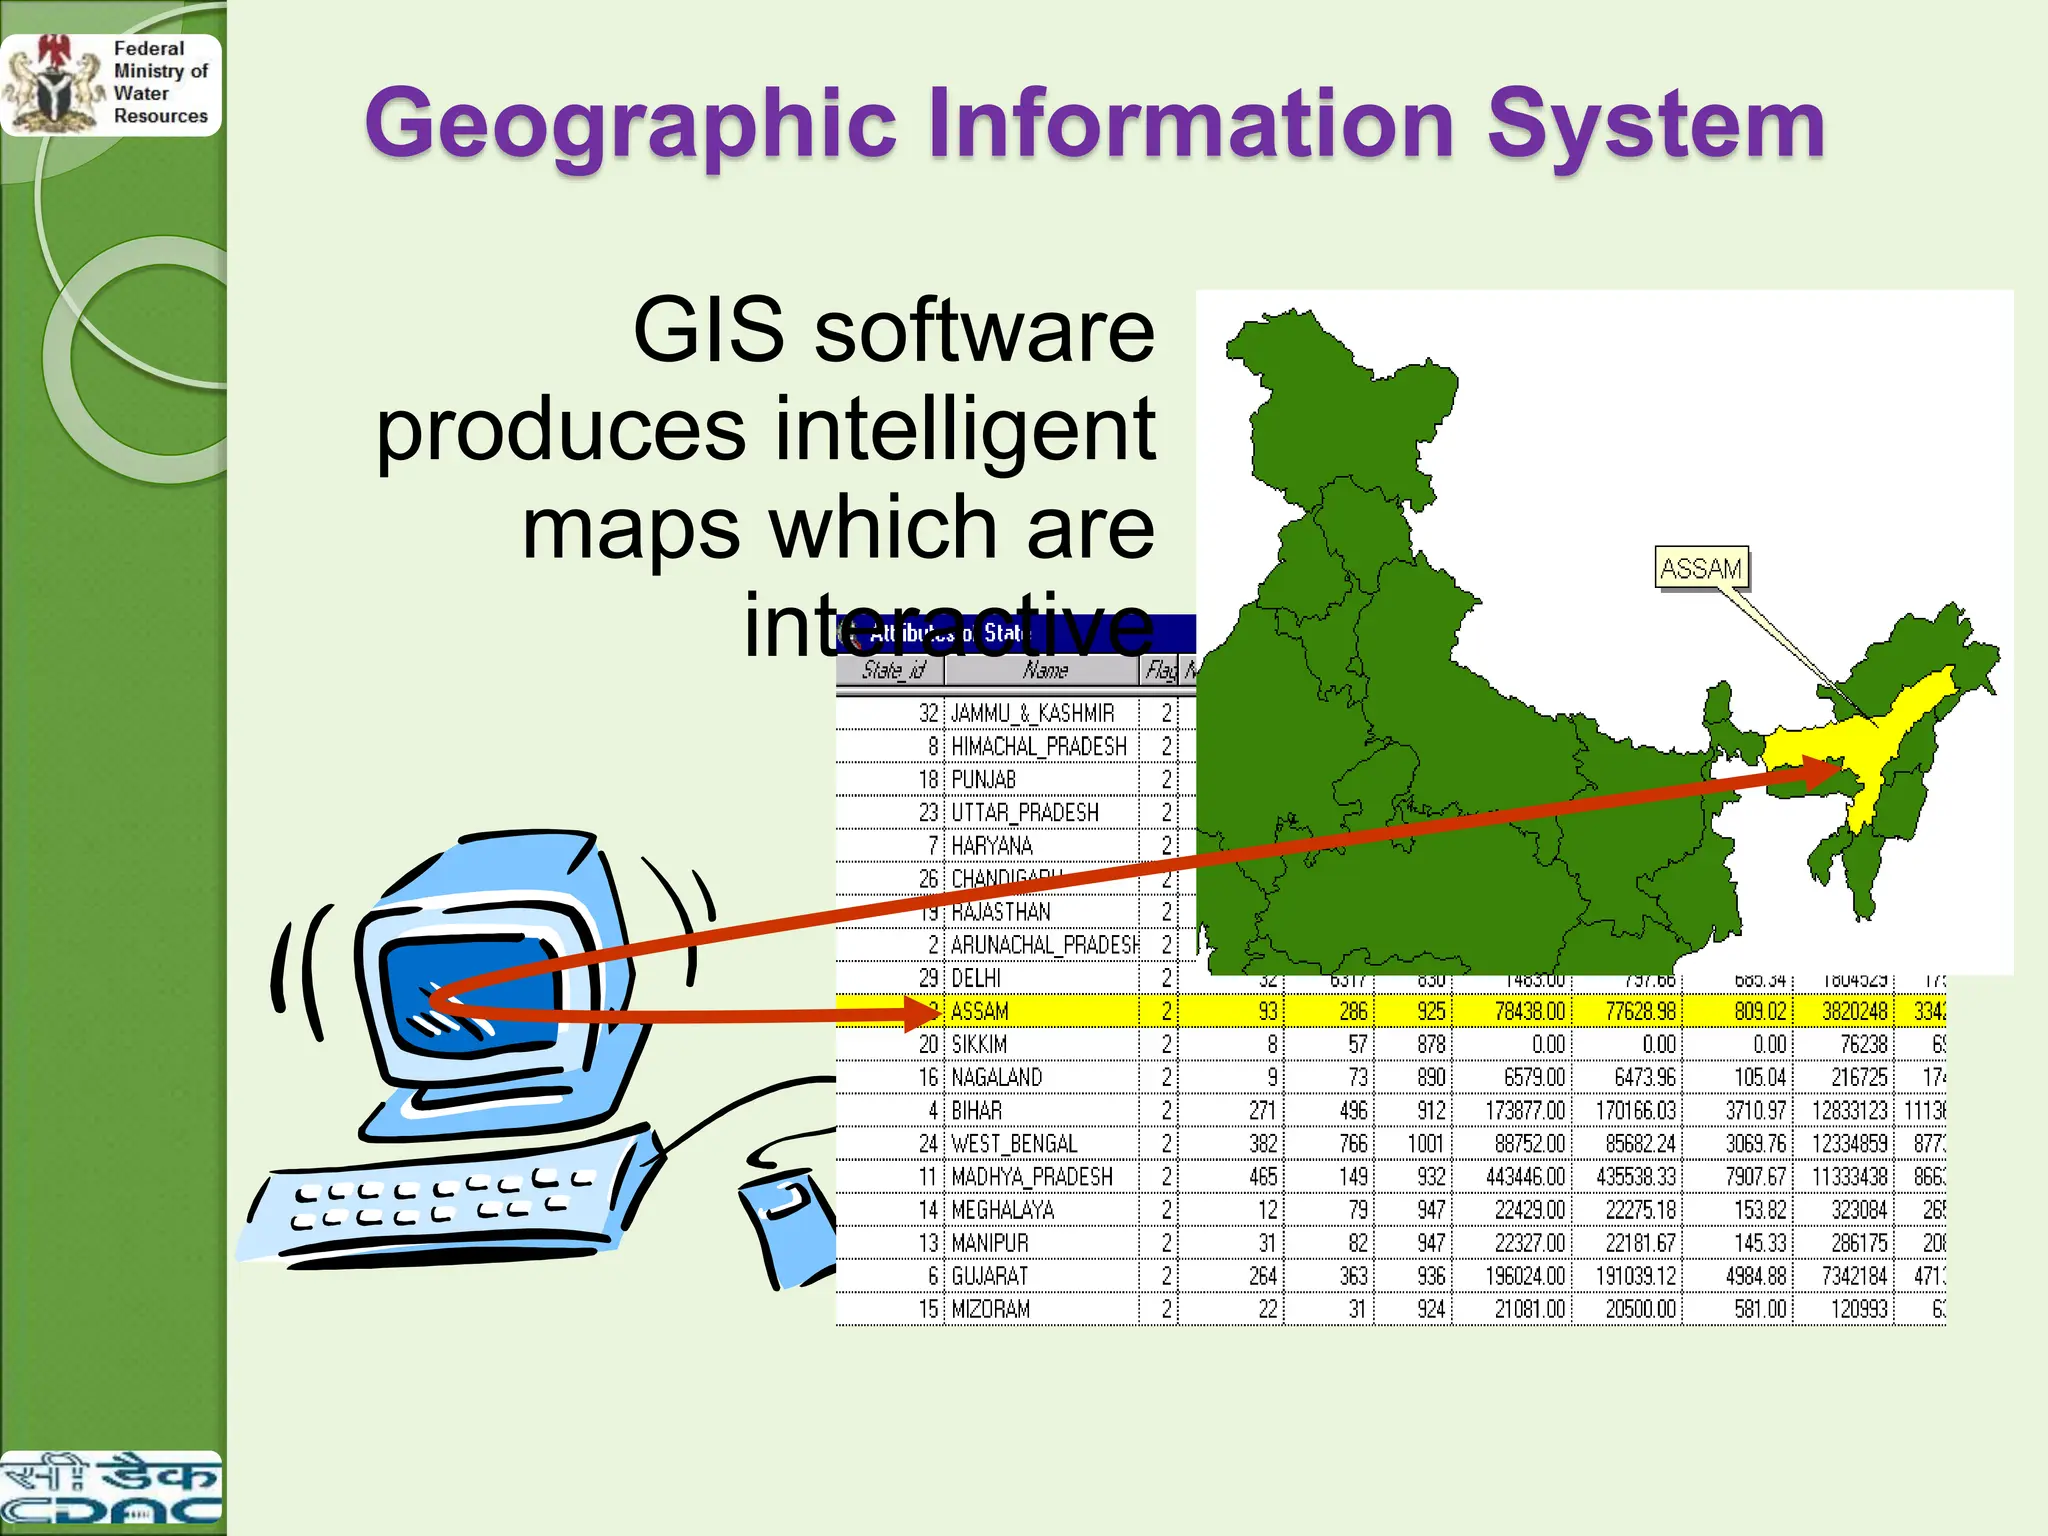
What is GeographicalInformation?
Geography which is the
science of our world
when coupled with GIS
enhances the power to
understand our earth in
better way.
Geographic Information
records the physical
position of an object in a
digital map.
25.
GIS as aSpecial Class of
Information System
Location – Mapping where things are or lets you
find (what exists at a particular location?)
Condition – It can help one in Identifying location
where certain condition exist.
Trends – what has changed since.
Patterns – what spatial pattern exists?
Modeling – what it is.
26.
HISTORY OF GIS
GIS relatively being a new branch of information technology
have undergone considerable / tremendous changes in a
very short span of time in both the aspects –
◦ The technology used to construct GIS & the functions of
GIS.
◦ The concept of handling complex data electronically was
adopted by the government agencies to handle spatial
data by developing an information system.
The first ever produced such kind of Information System is
Canada Geographic Information System (CGIS) which
was conceptualized in 1960s and become operational in
1971.
It was developed to address the needs of land and resources
information management of the federal government of
Canada. (Tomlinson et al 1976 ).
In 1973 the USGS started the development of the
Geographical Information Retrieval and Analysis
27.
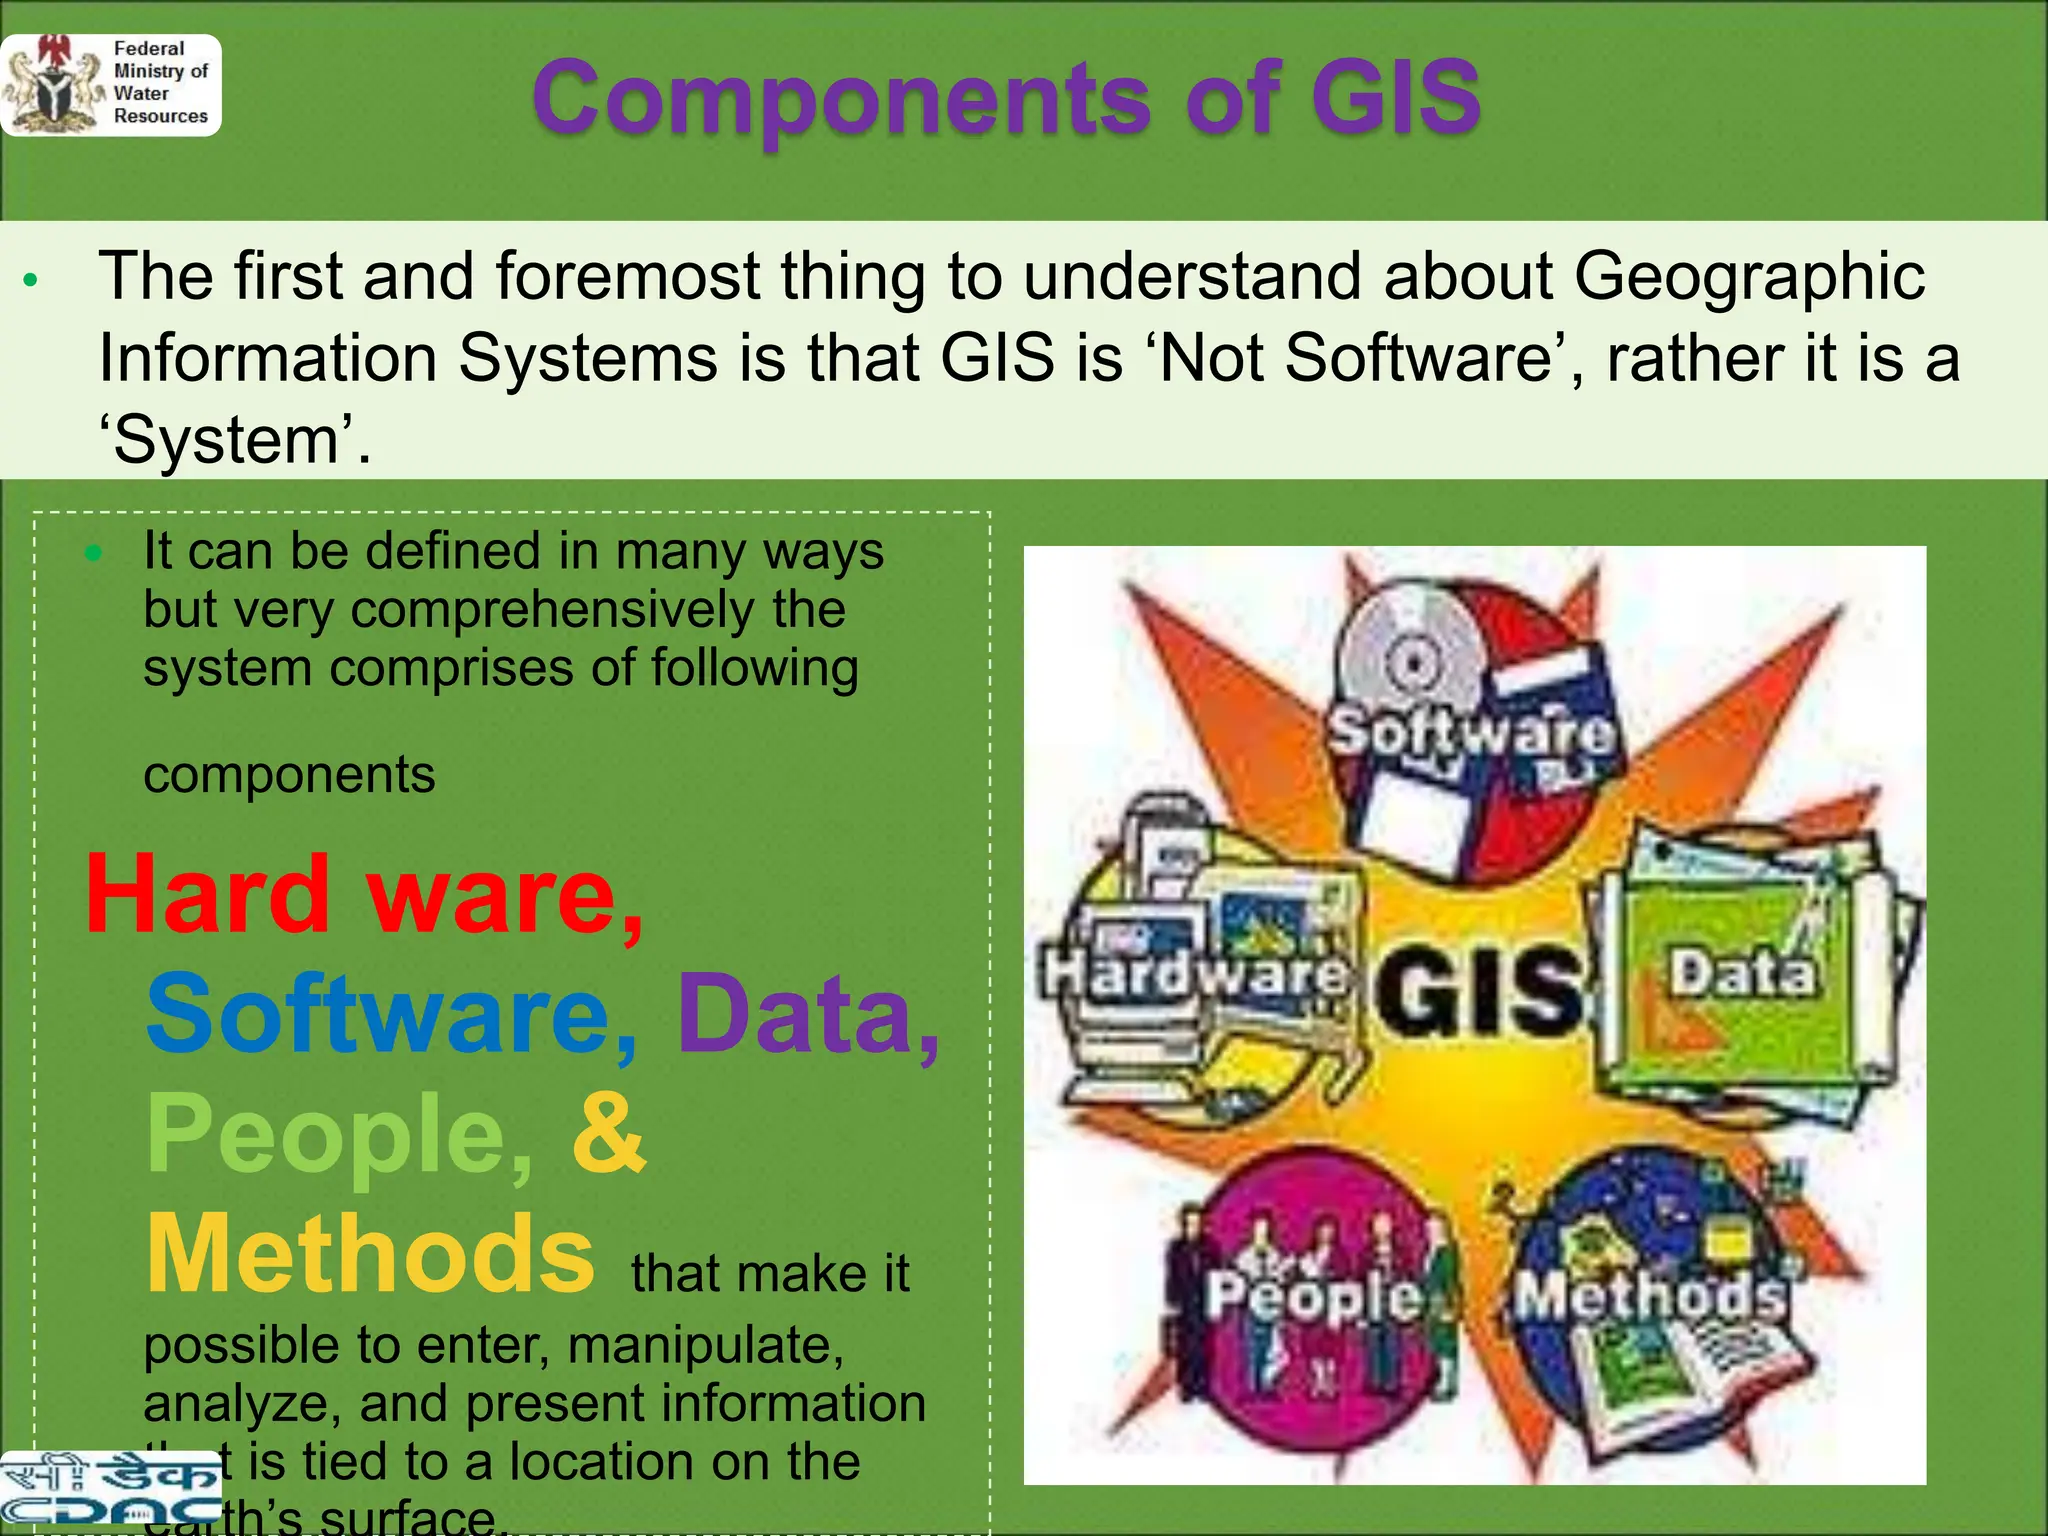
Components of GIS
•The first and foremost thing to understand about Geographic
Information Systems is that GIS is ‘Not Software’, rather it is a
‘System’.
It can be defined in many ways
but very comprehensively the
system comprises of following
components
Hard ware,
Software, Data,
People, &
Methods that make it
possible to enter, manipulate,
analyze, and present information
that is tied to a location on the
28.
Hardware
Hardware isthe computer on which a GIS
operates, that is the configuration of both the
core and peripheral equipments required for
the acquisition, storage analysis and
output of the spatial data.
These include conventional read devices
network devices, together with specific
inputoutput devices widely used in GIS
applications such as digitizer, scanner,
plotters and printers etc.
The central processing unit is the heart of any
GIS System architecture that performs all the
data processing, analysis tasks and also
29.
Software
GIS softwarepackages comprise of a set of modules for
performing the functions required to store, analyze, and display
geographic information.
Key software components for any GIS are:
◦ The tools for the input of the data information (Which is
carried out with the help of the digitization of maps) and
manipulation of geographic information (editing of errors,
overlaying between different layers, analysis etc.).
Key software components for any GIS are:
◦ Tools for the input of the data information
◦ A database management system (DBMS)
◦ Tools that support geographic query, analysis, and
visualization.
◦ A graphical user interface (GUI) for easy access to tools.
30.
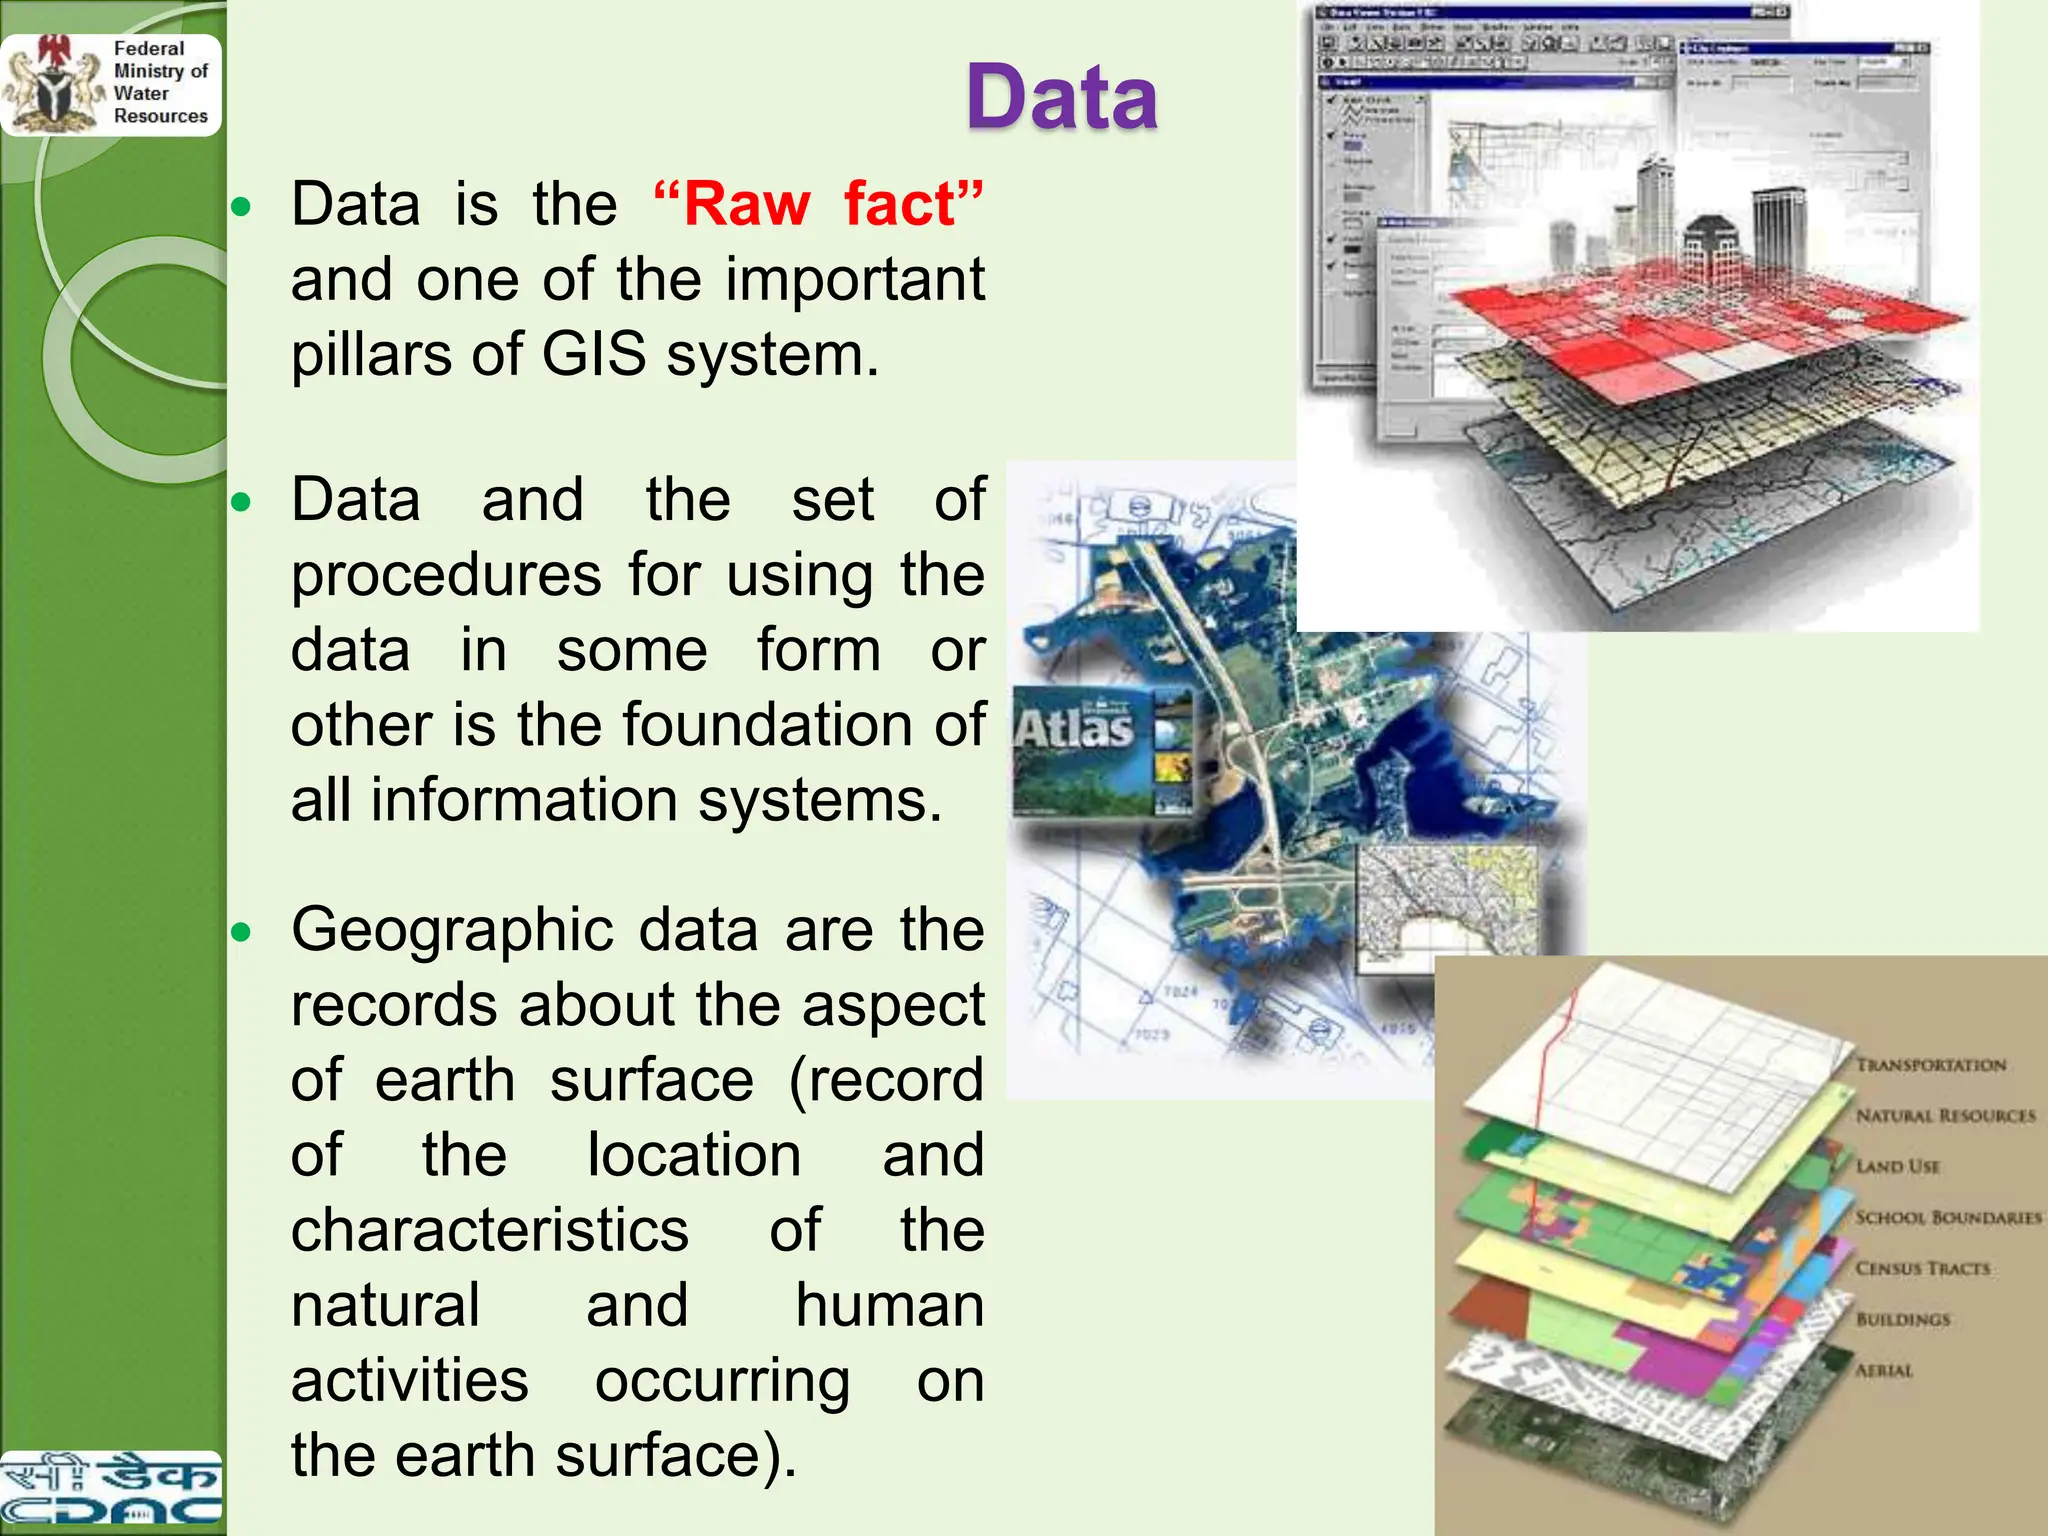
Data isthe “Raw fact”
and one of the important
pillars of GIS system.
Data and the set of
procedures for using the
data in some form or
other is the foundation of
all information systems.
Geographic data are the
records about the aspect
of earth surface (record
of the location and
characteristics of the
natural and human
activities occurring on
the earth surface).
Data
31.
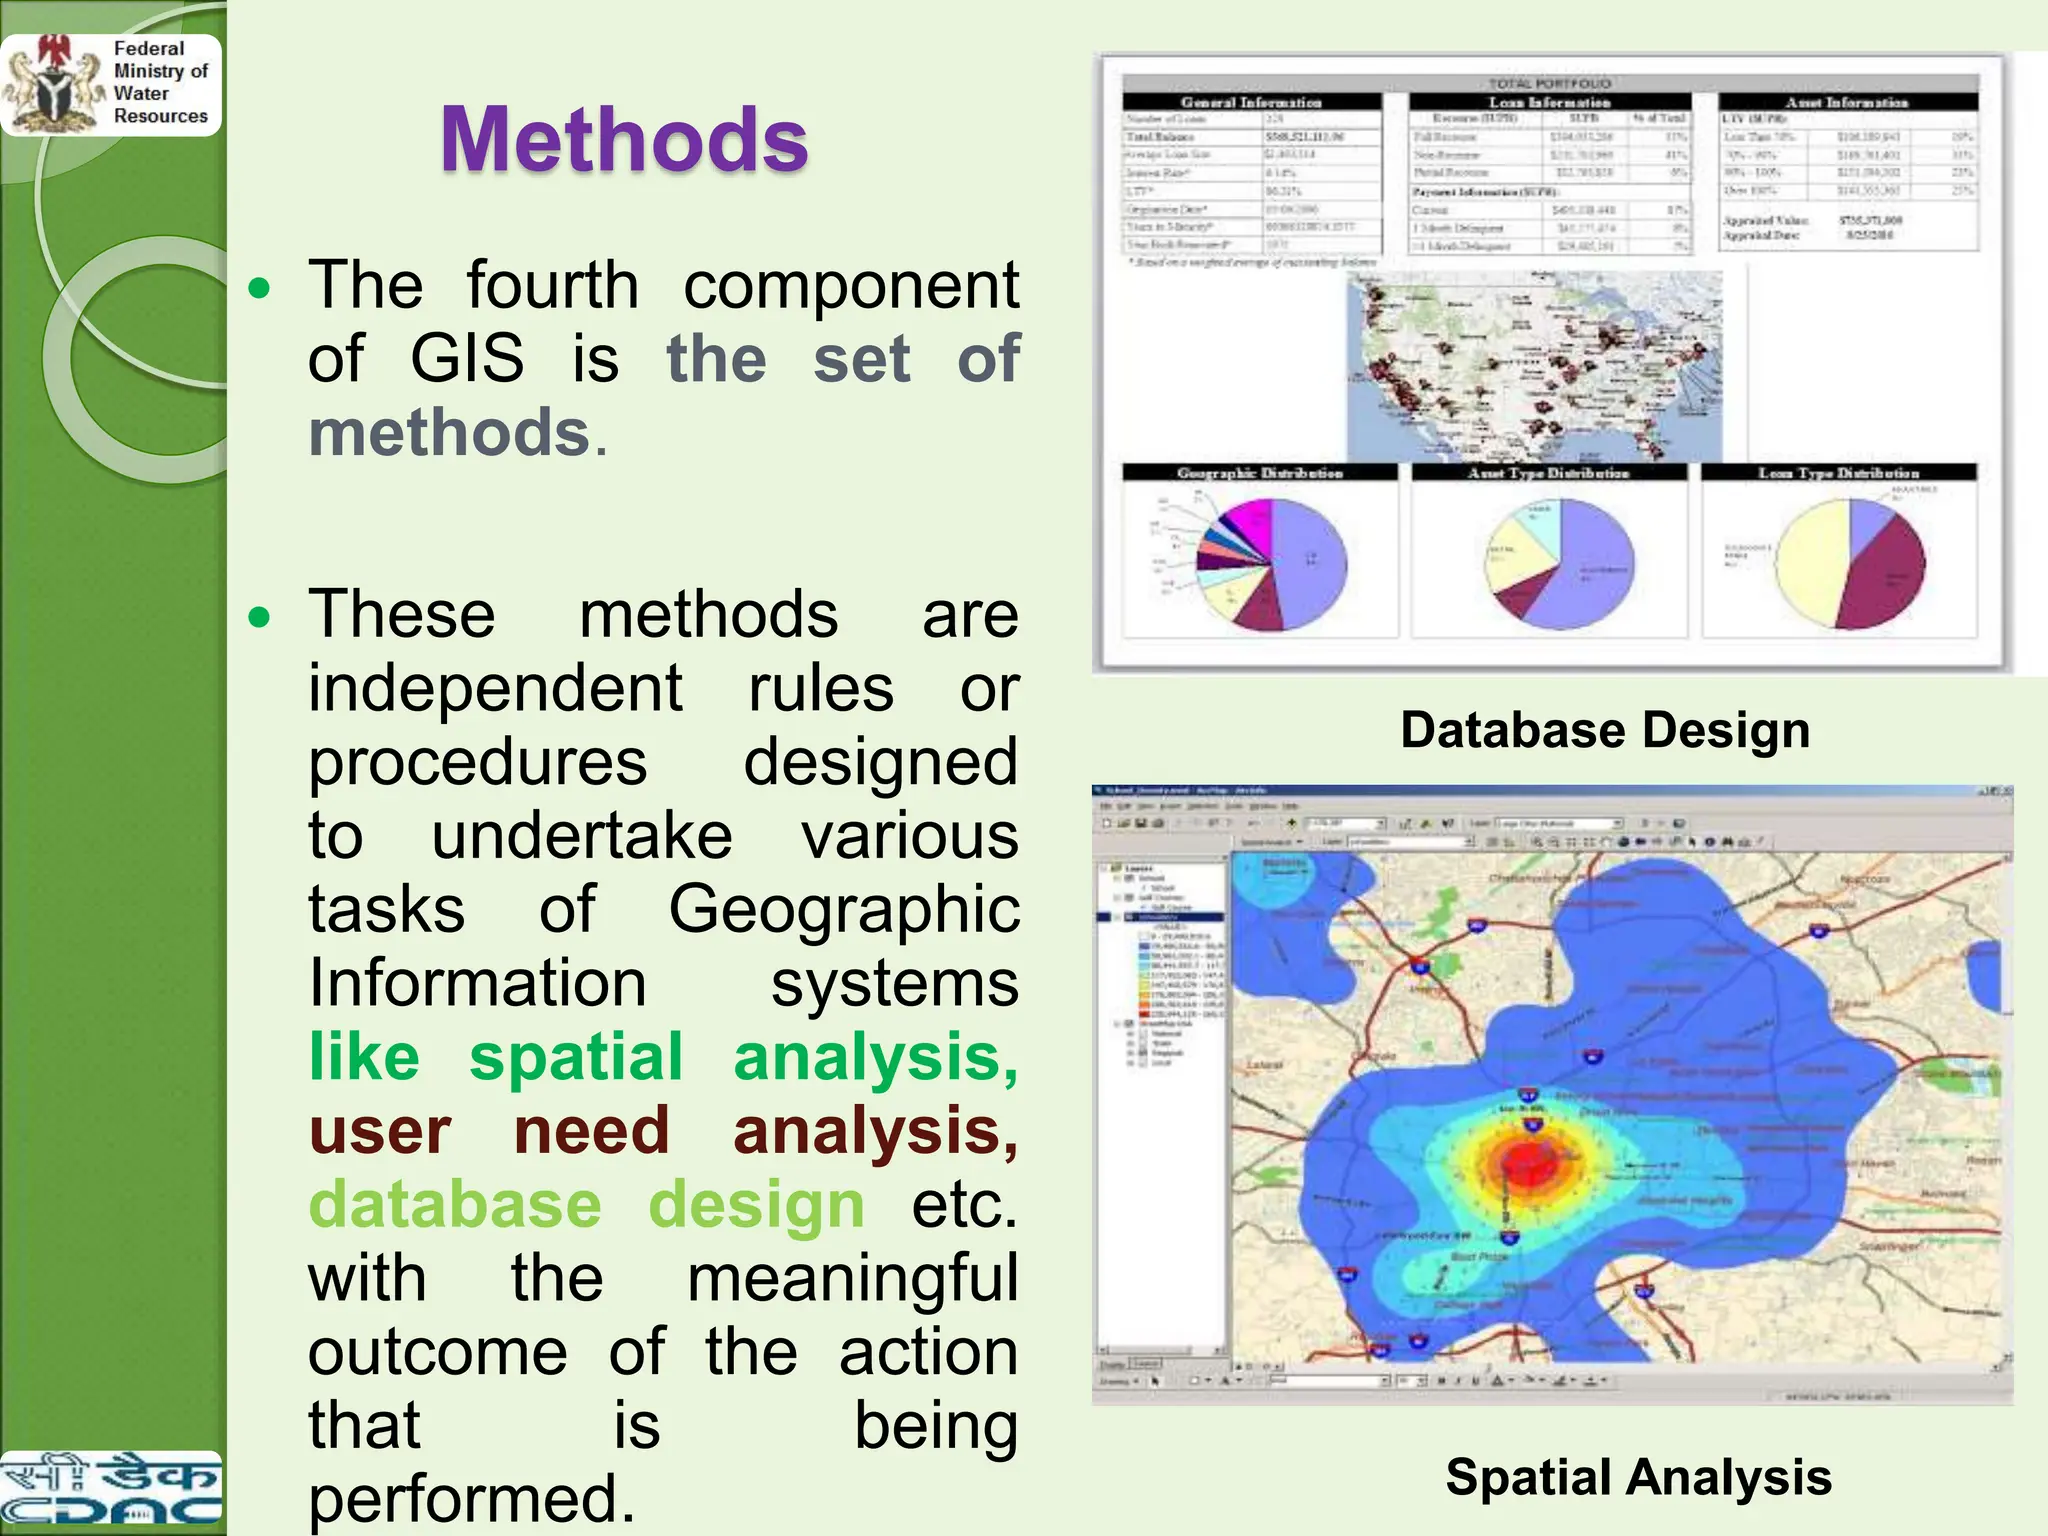
Methods
The fourthcomponent
of GIS is the set of
methods.
These methods are
independent rules or
procedures designed
to undertake various
tasks of Geographic
Information systems
like spatial analysis,
user need analysis,
database design etc.
with the meaningful
outcome of the action
that is being
performed. Spatial Analysis
Database Design
32.
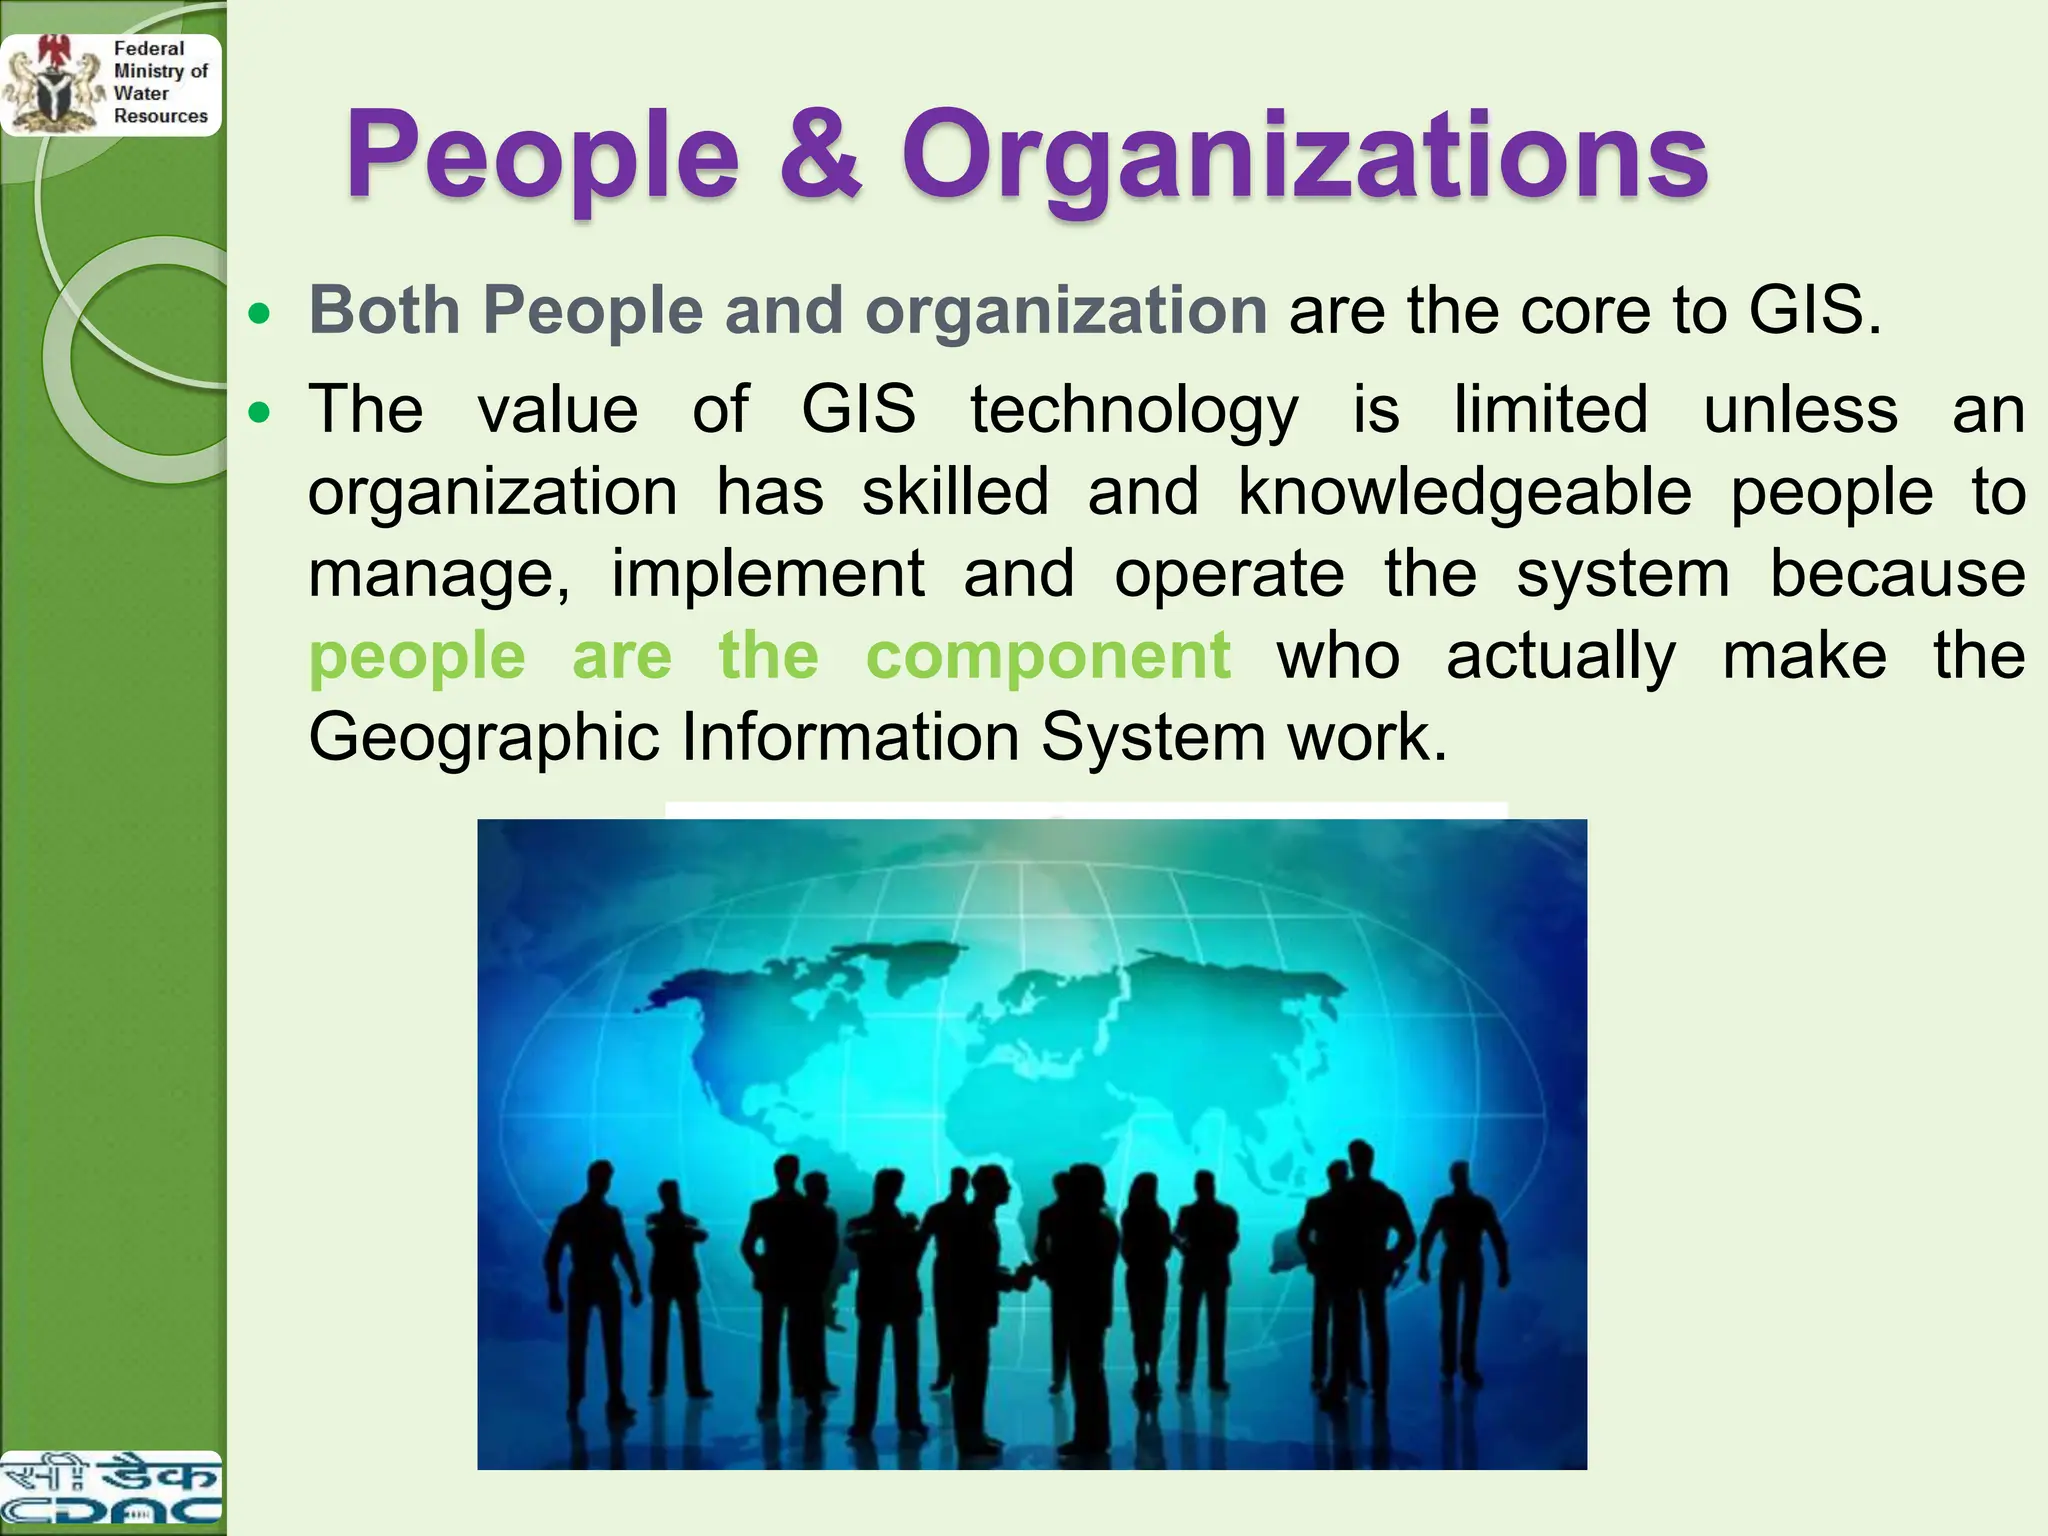
People & Organizations
Both People and organization are the core to GIS.
The value of GIS technology is limited unless an
organization has skilled and knowledgeable people to
manage, implement and operate the system because
people are the component who actually make the
Geographic Information System work.
33.
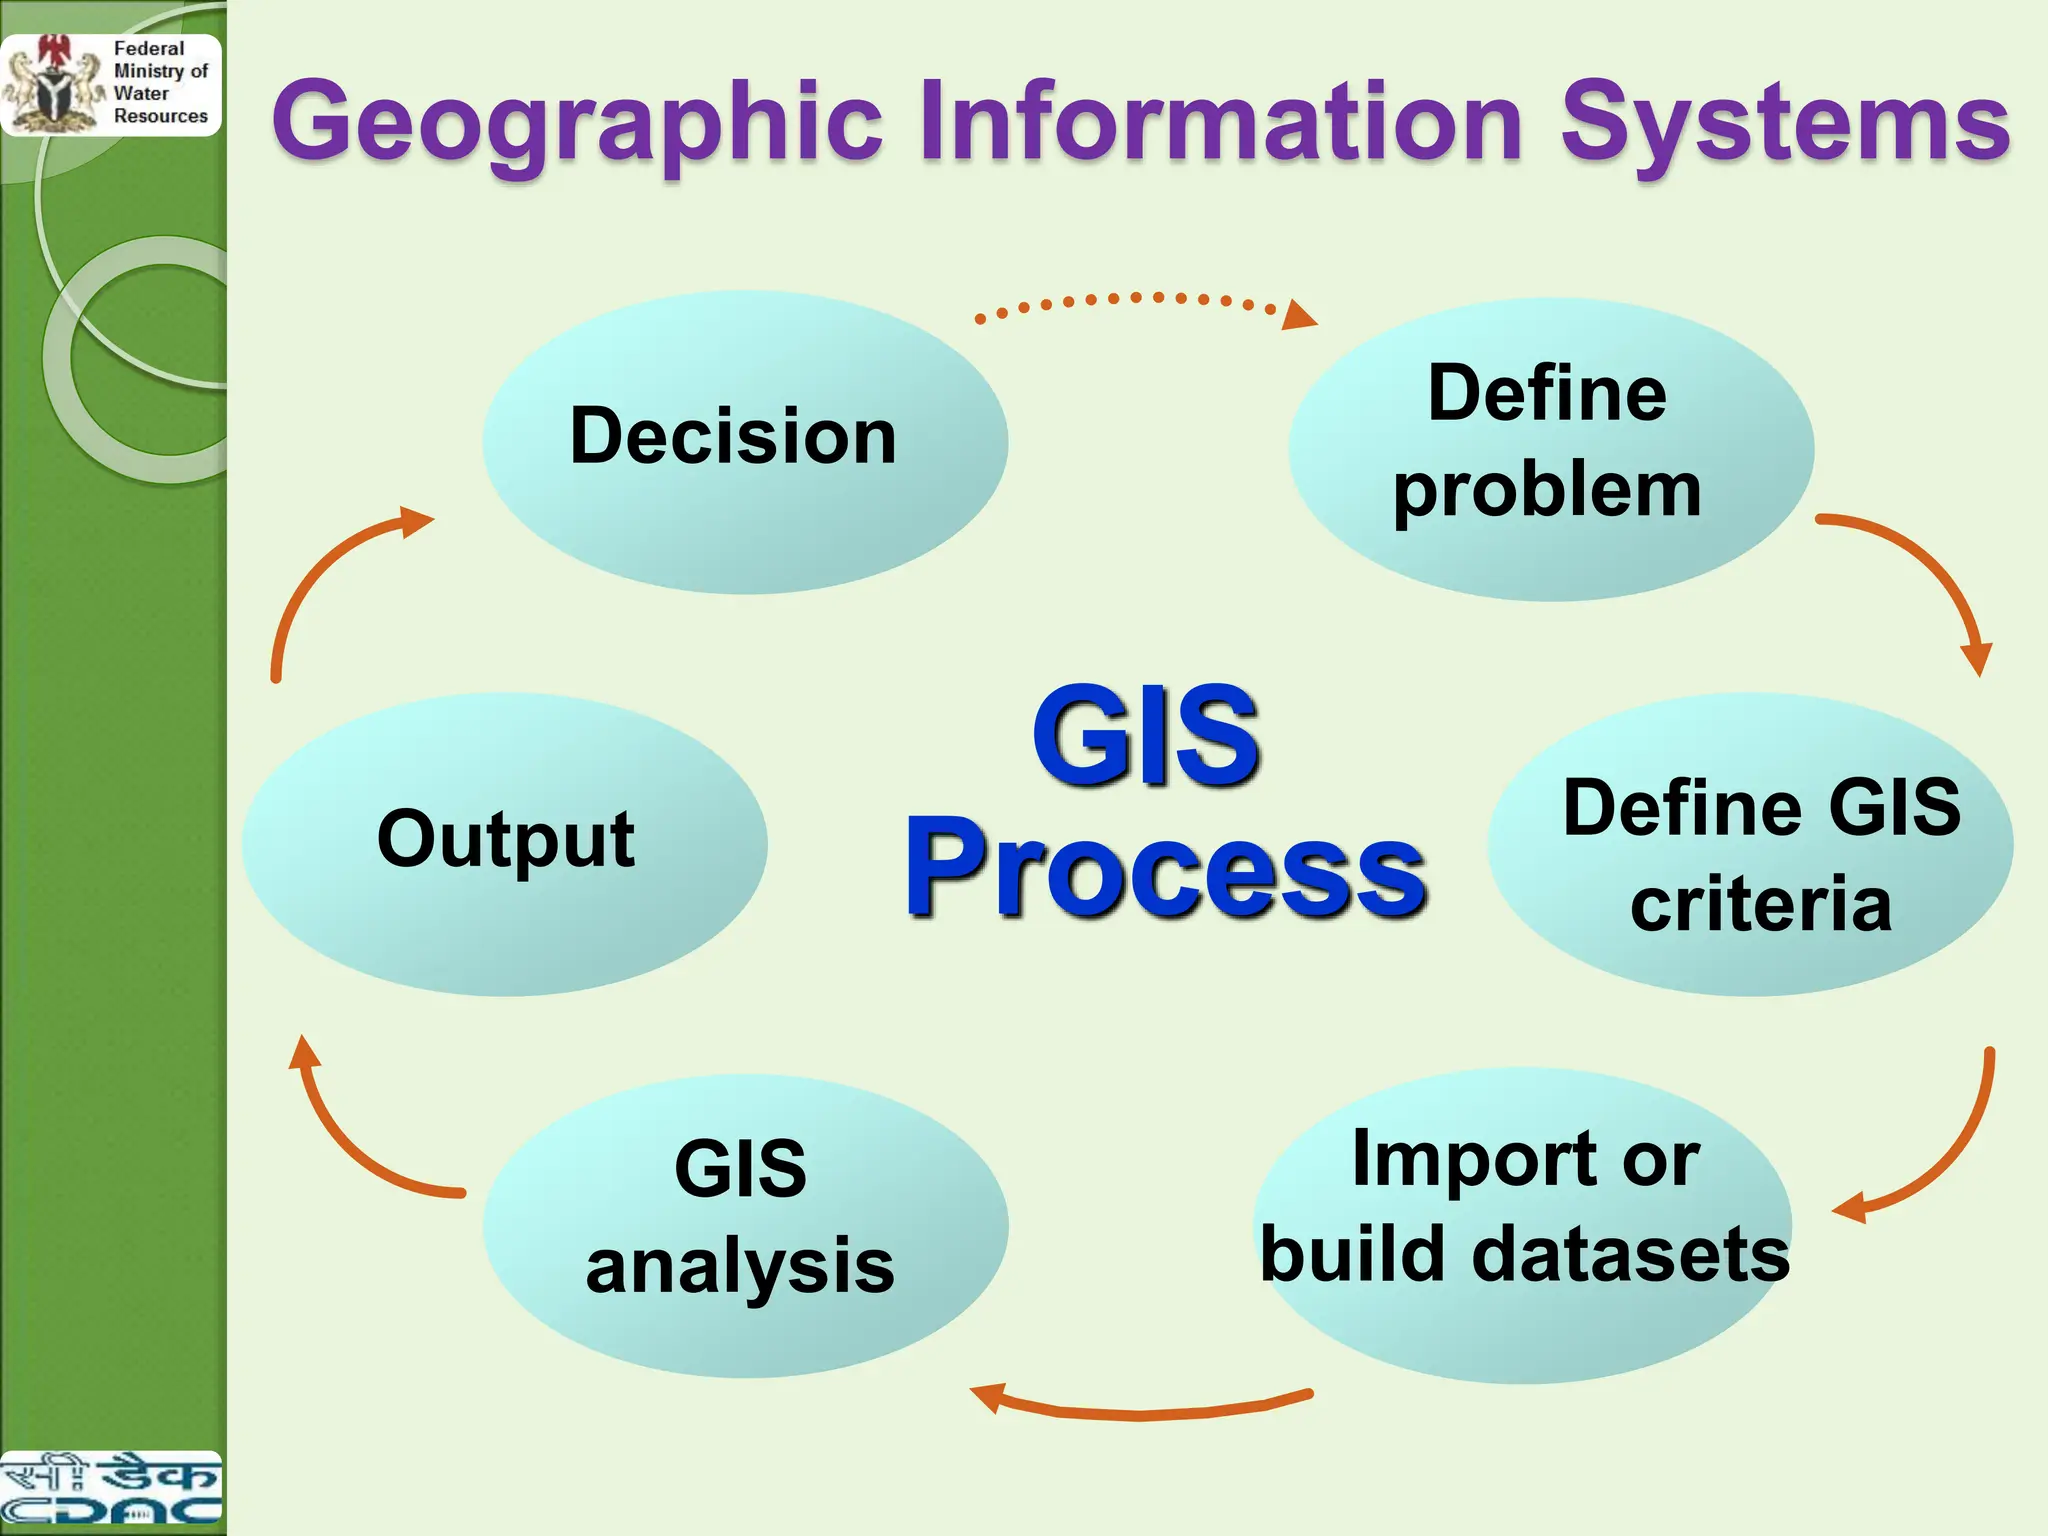
Functions of GIS
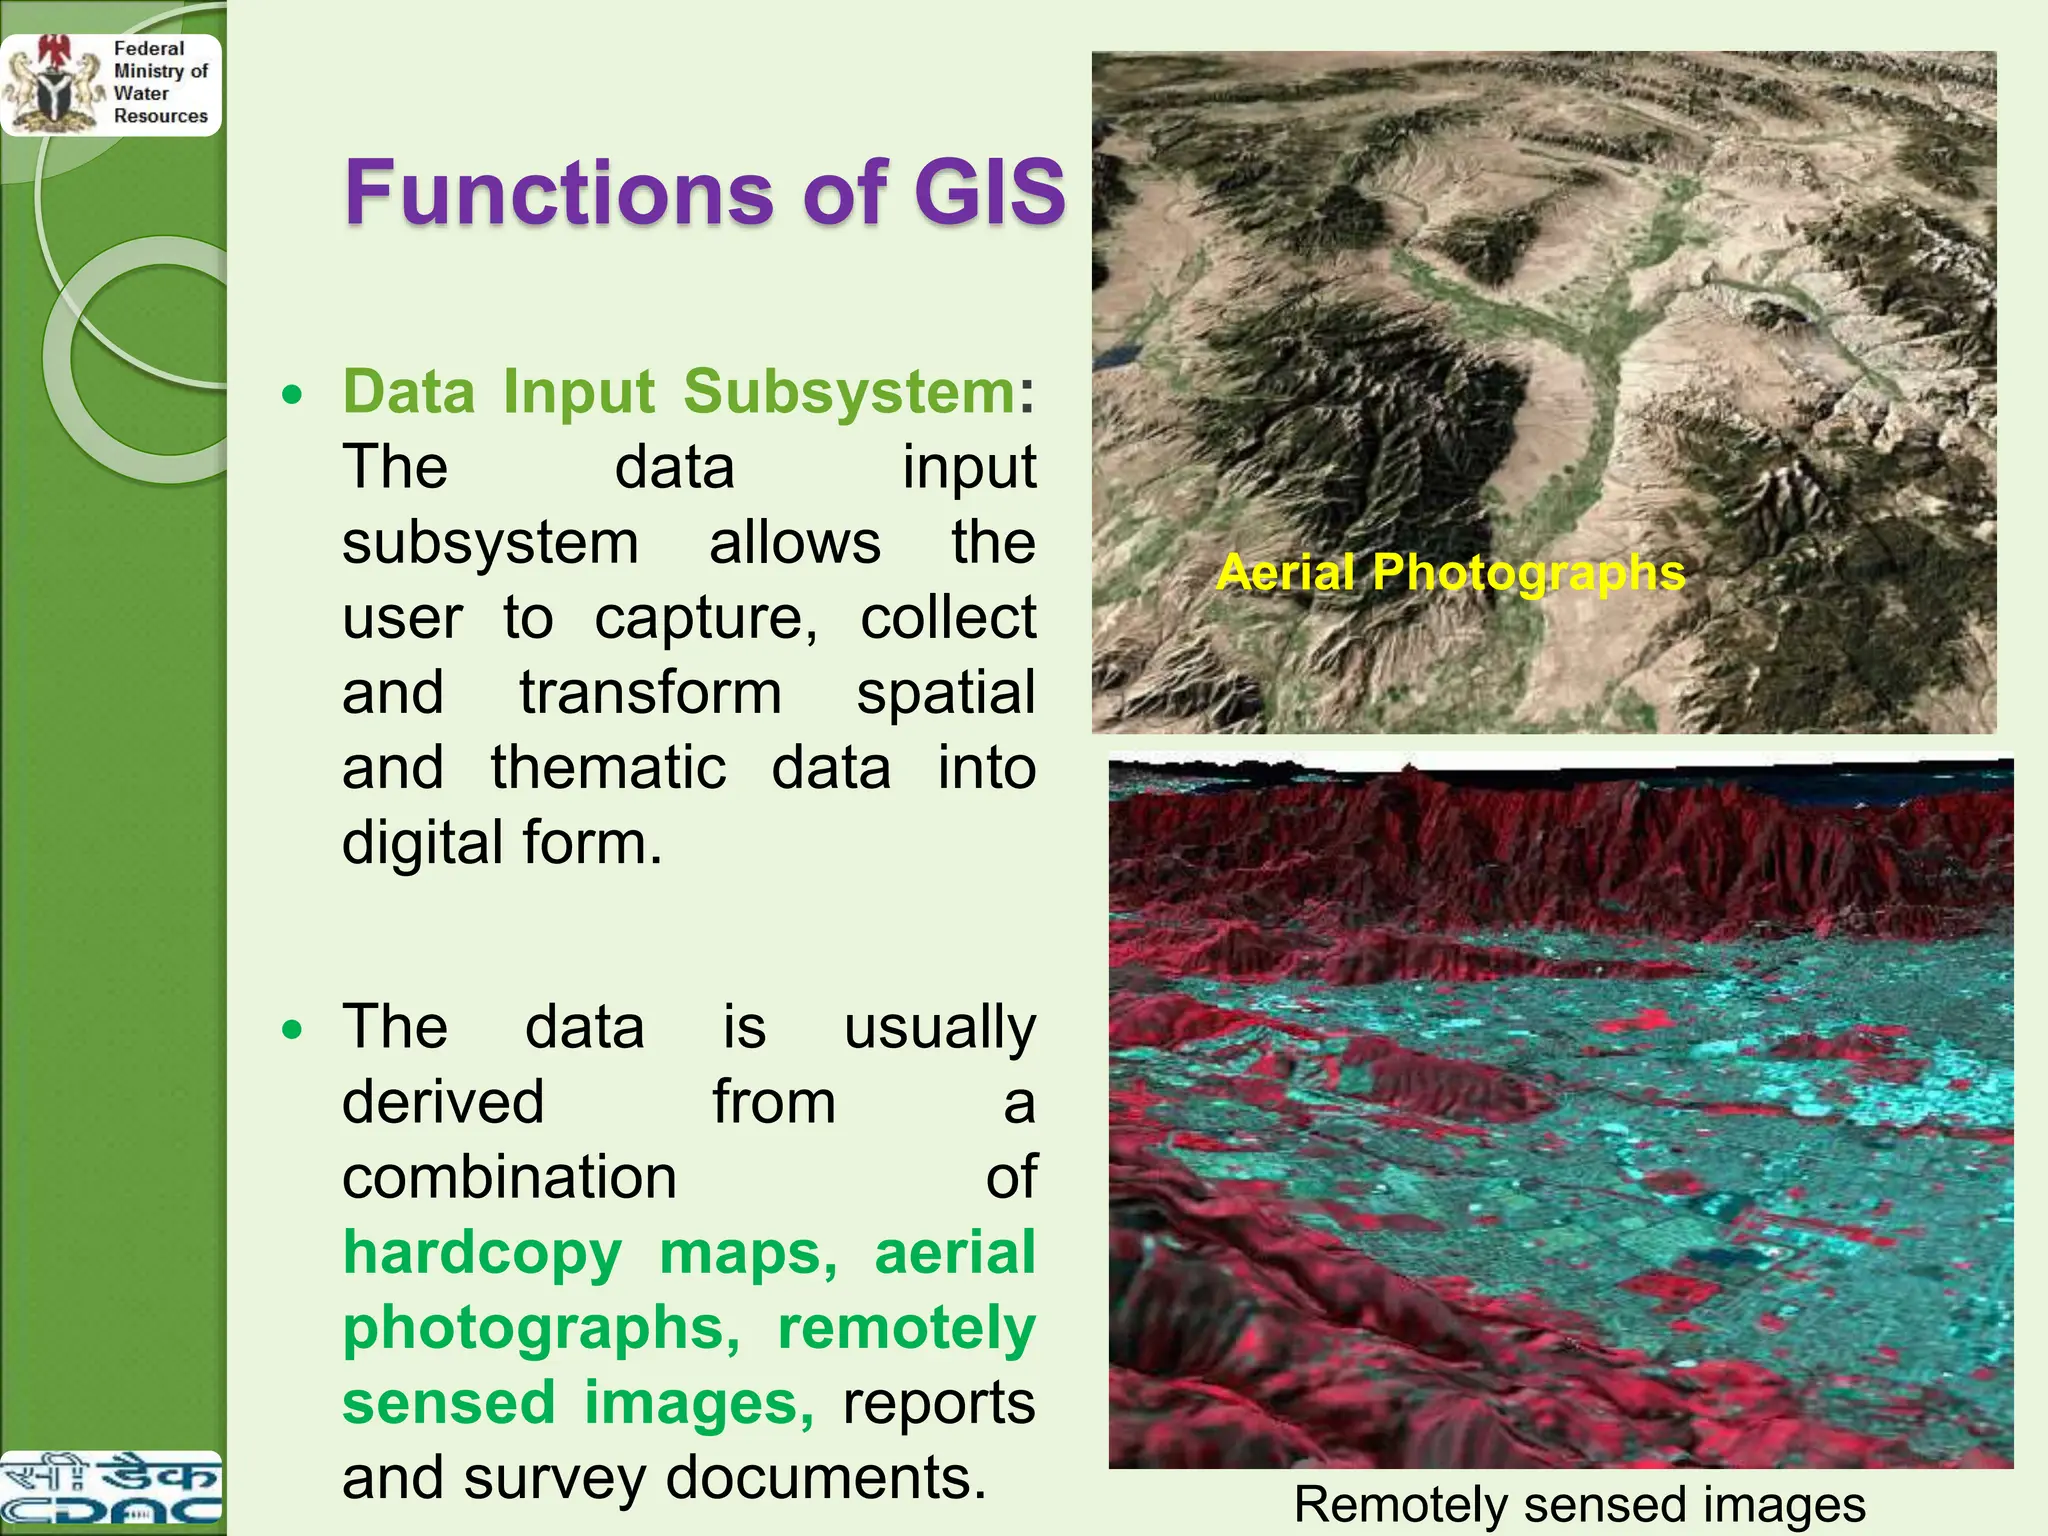
Data Input Subsystem:
The data input
subsystem allows the
user to capture, collect
and transform spatial
and thematic data into
digital form.
The data is usually
derived from a
combination of
hardcopy maps, aerial
photographs, remotely
sensed images, reports
and survey documents. Remotely sensed images
Aerial Photographs
34.
Functions of GIS
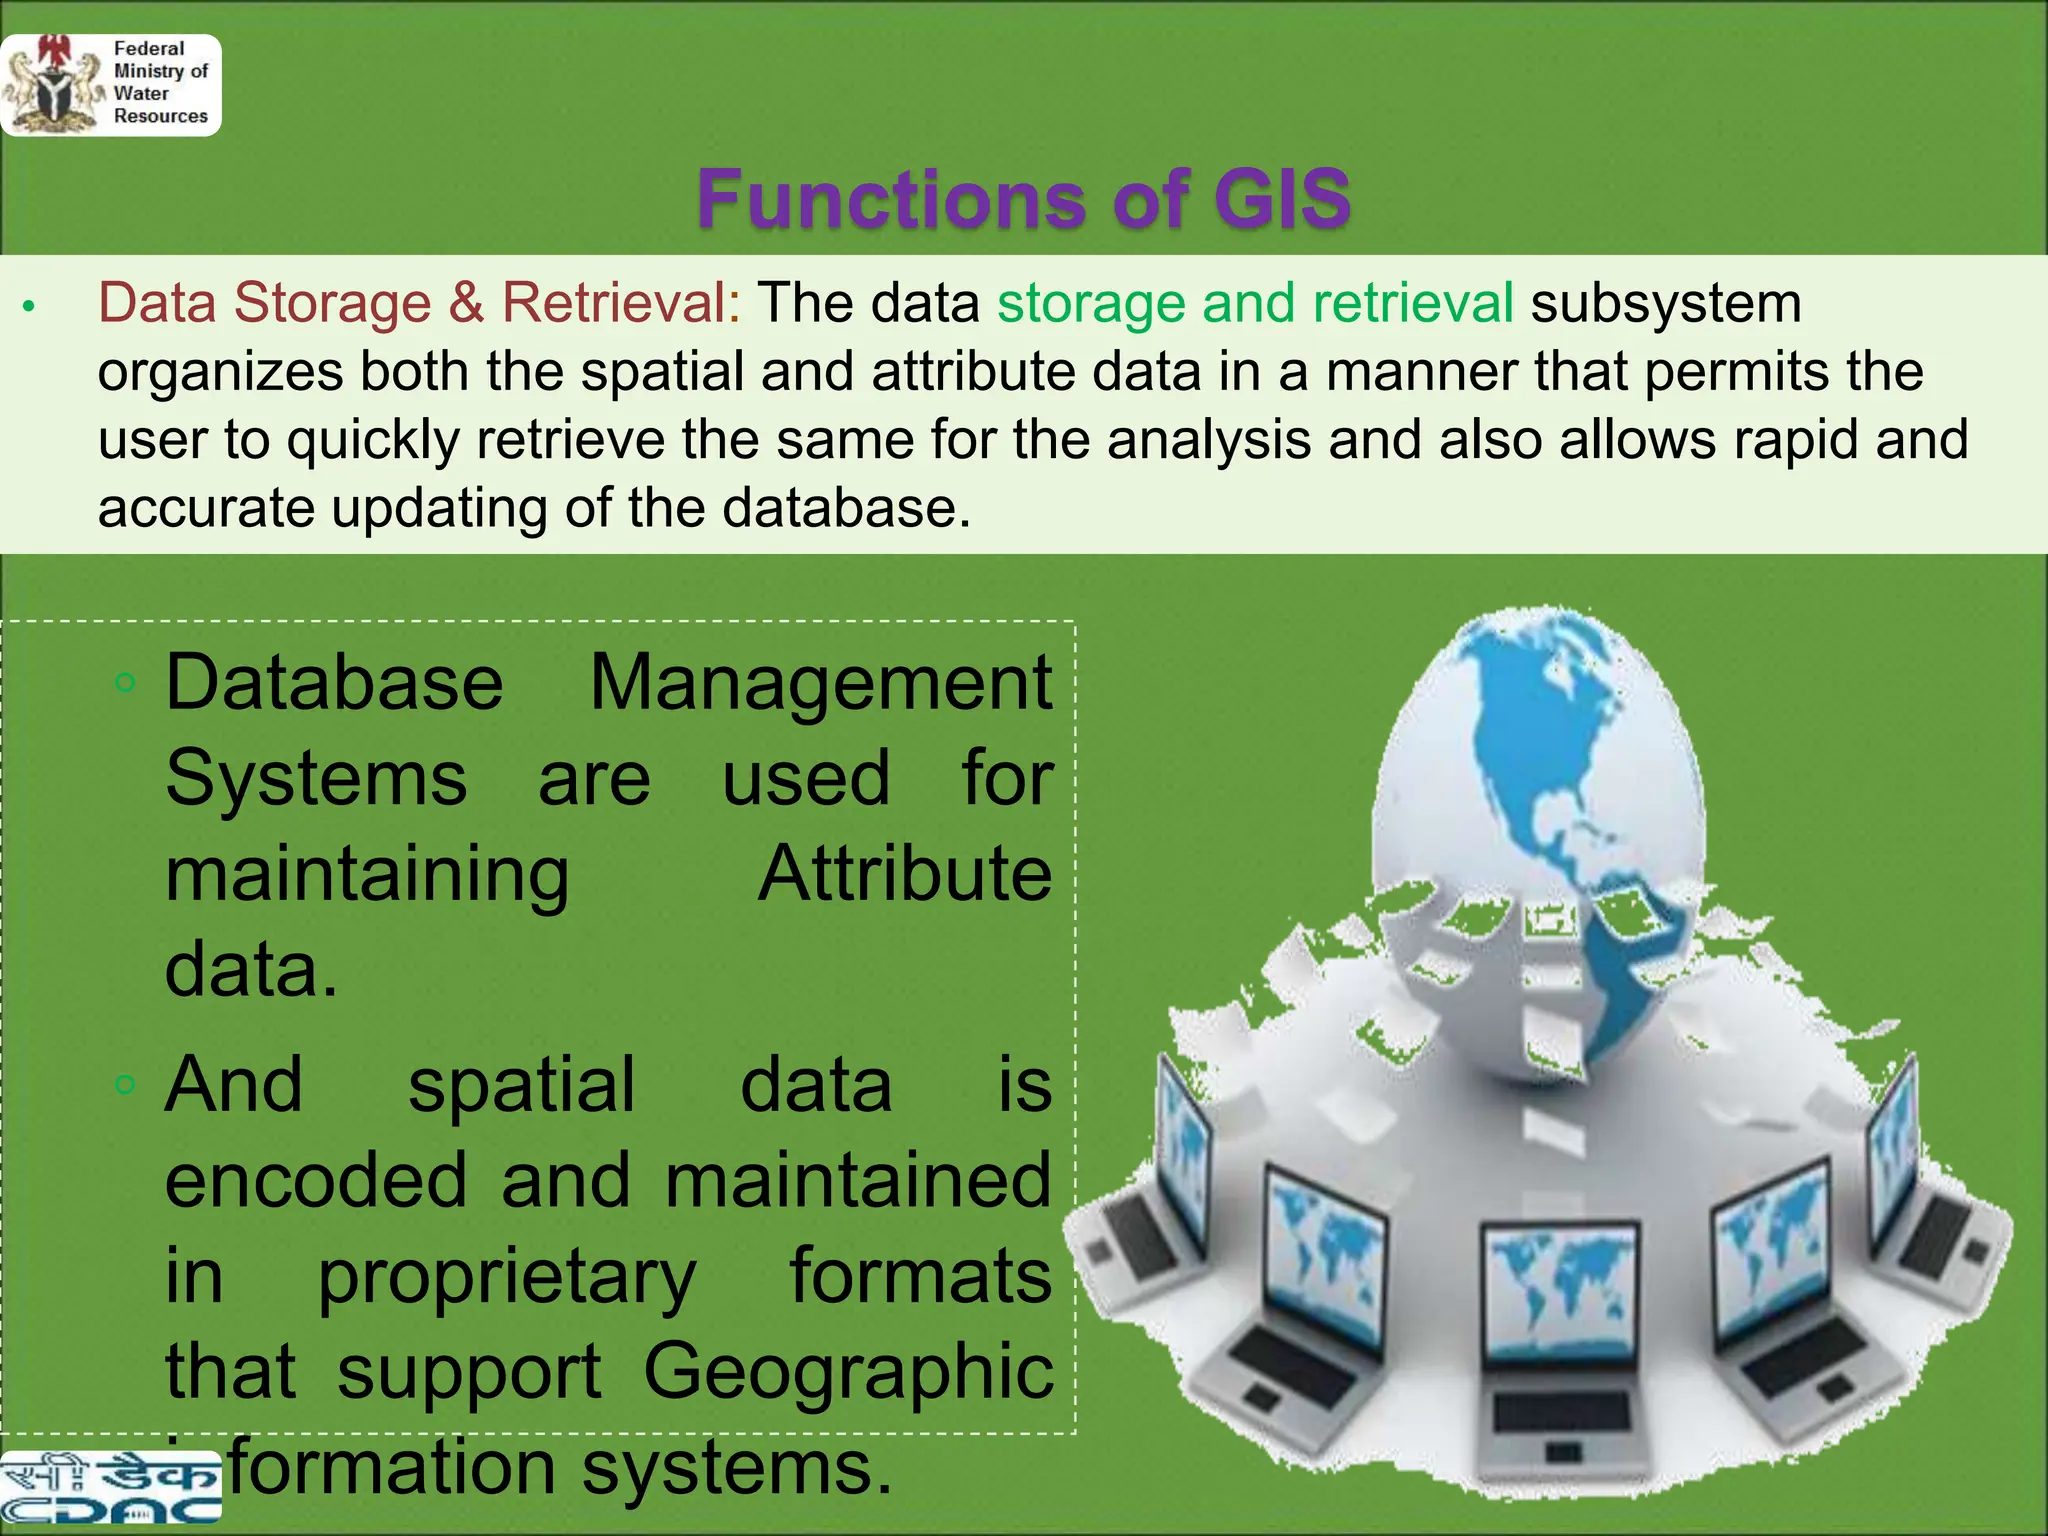
•Data Storage & Retrieval: The data storage and retrieval subsystem
organizes both the spatial and attribute data in a manner that permits the
user to quickly retrieve the same for the analysis and also allows rapid and
accurate updating of the database.
◦ Database Management
Systems are used for
maintaining Attribute
data.
◦ And spatial data is
encoded and maintained
in proprietary formats
that support Geographic
information systems.
35.
Functions of GIS
Data Manipulation & Analysis: This subsystem is the
heart of any GIS as the success of the system depends
on the successful operation of this procedure only.
This subsystem allows the user to define the task and
execute the spatial and attribute procedures to generate
the derived information.
36.
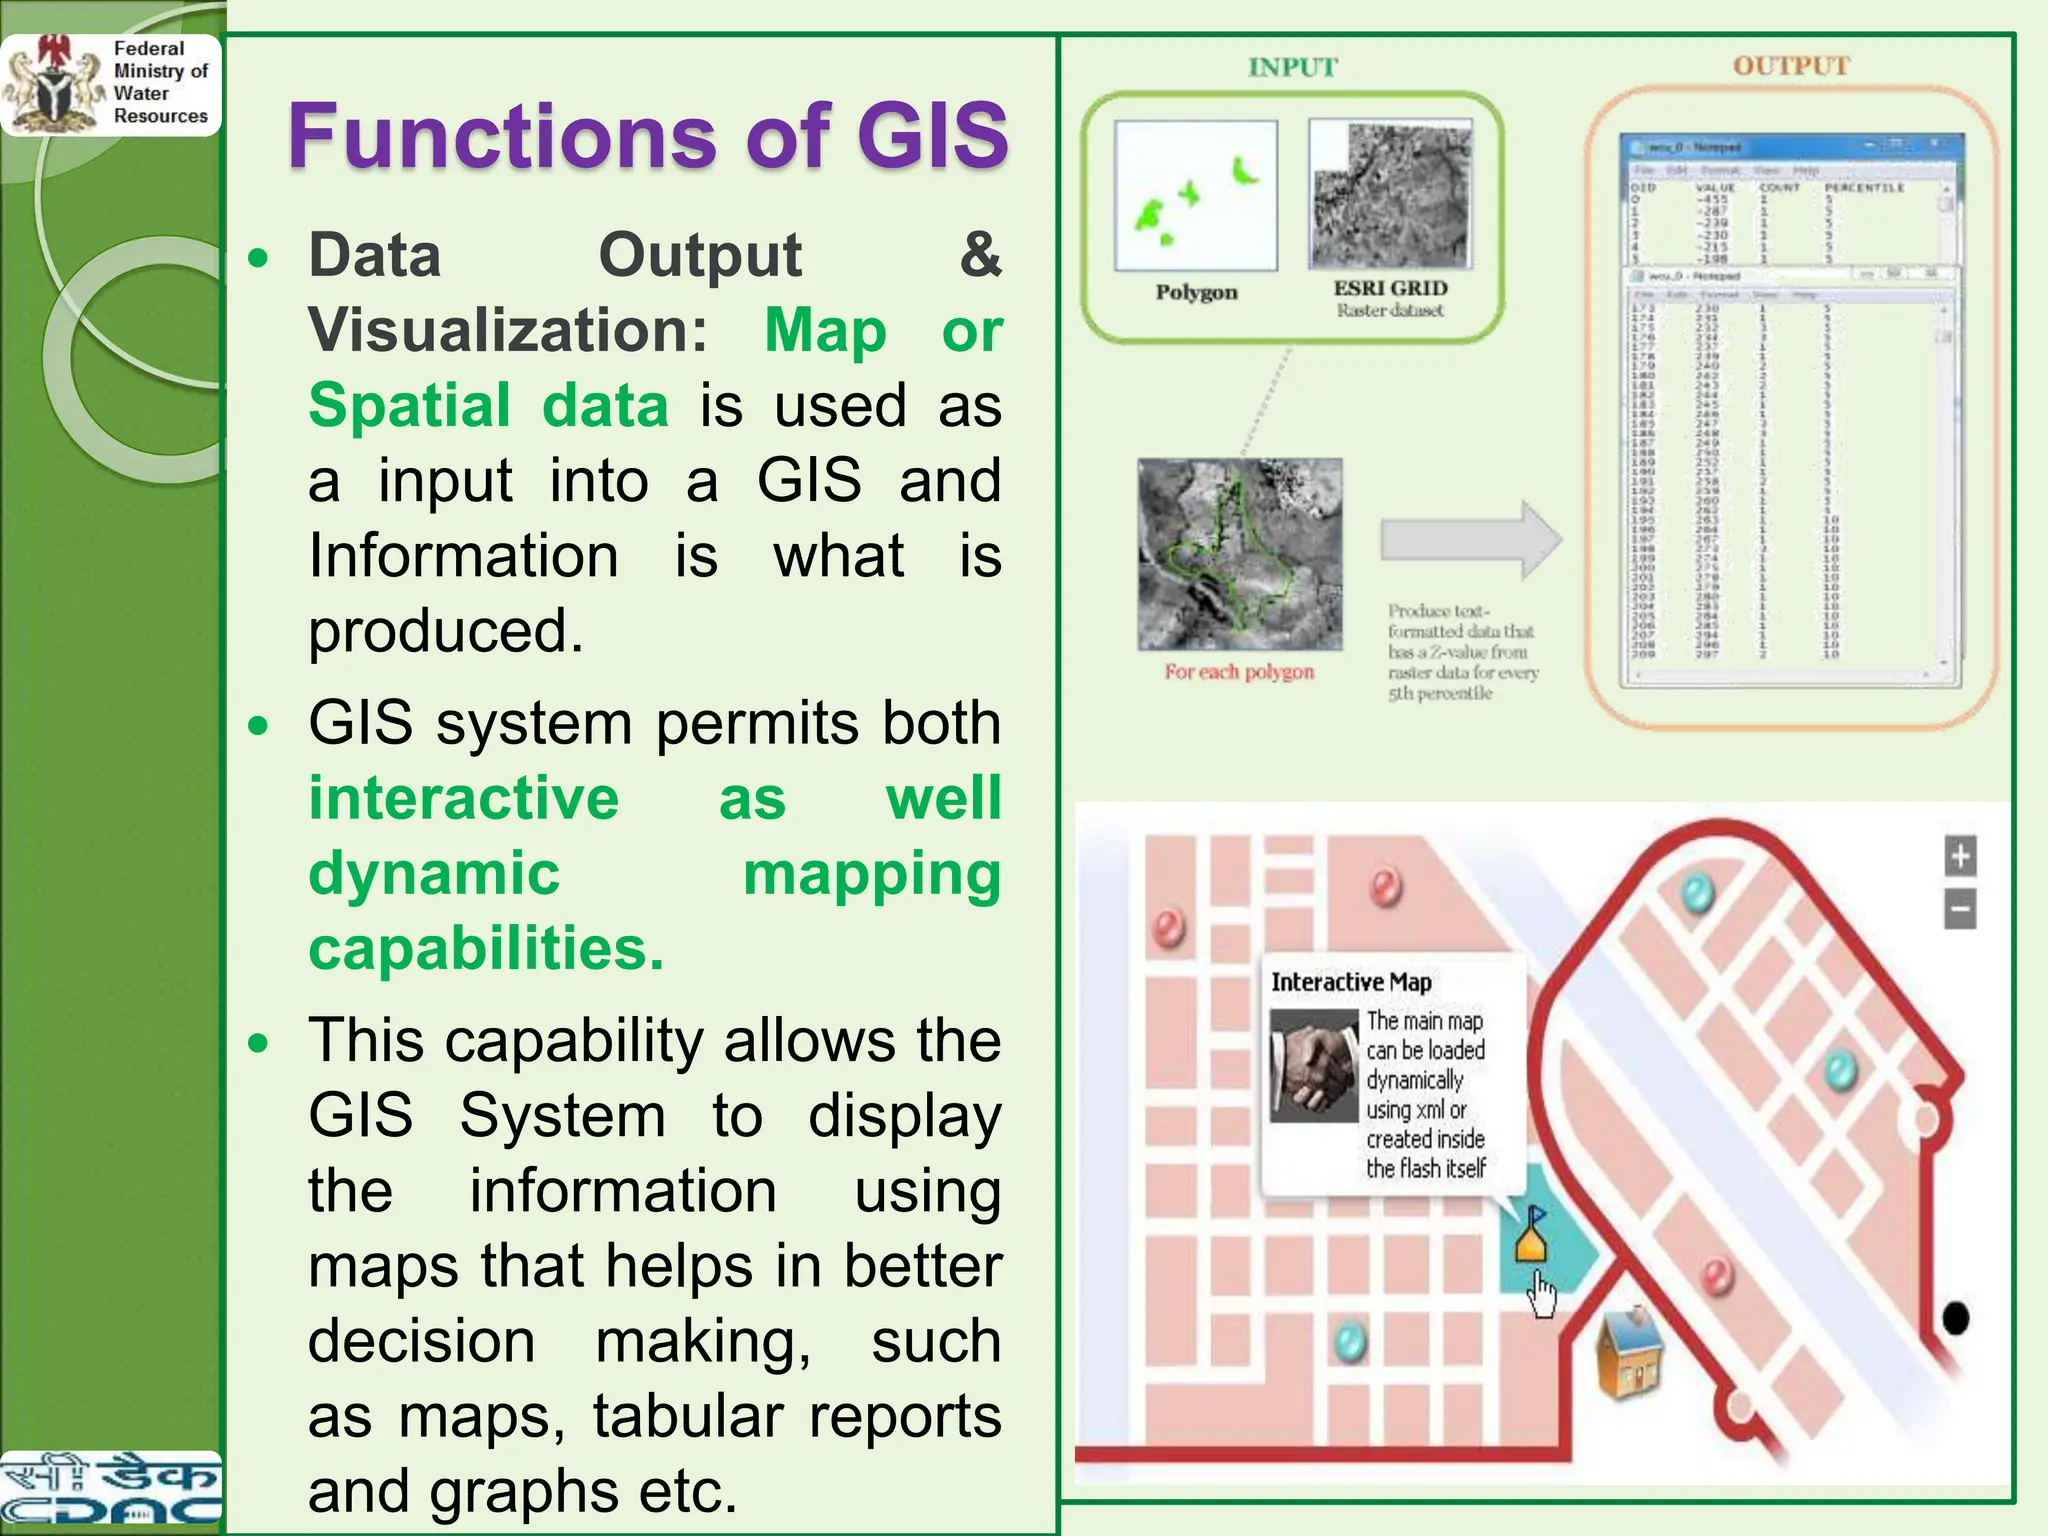
Functions of GIS
Data Output &
Visualization: Map or
Spatial data is used as
a input into a GIS and
Information is what is
produced.
GIS system permits both
interactive as well
dynamic mapping
capabilities.
This capability allows the
GIS System to display
the information using
maps that helps in better
decision making, such
as maps, tabular reports
and graphs etc.
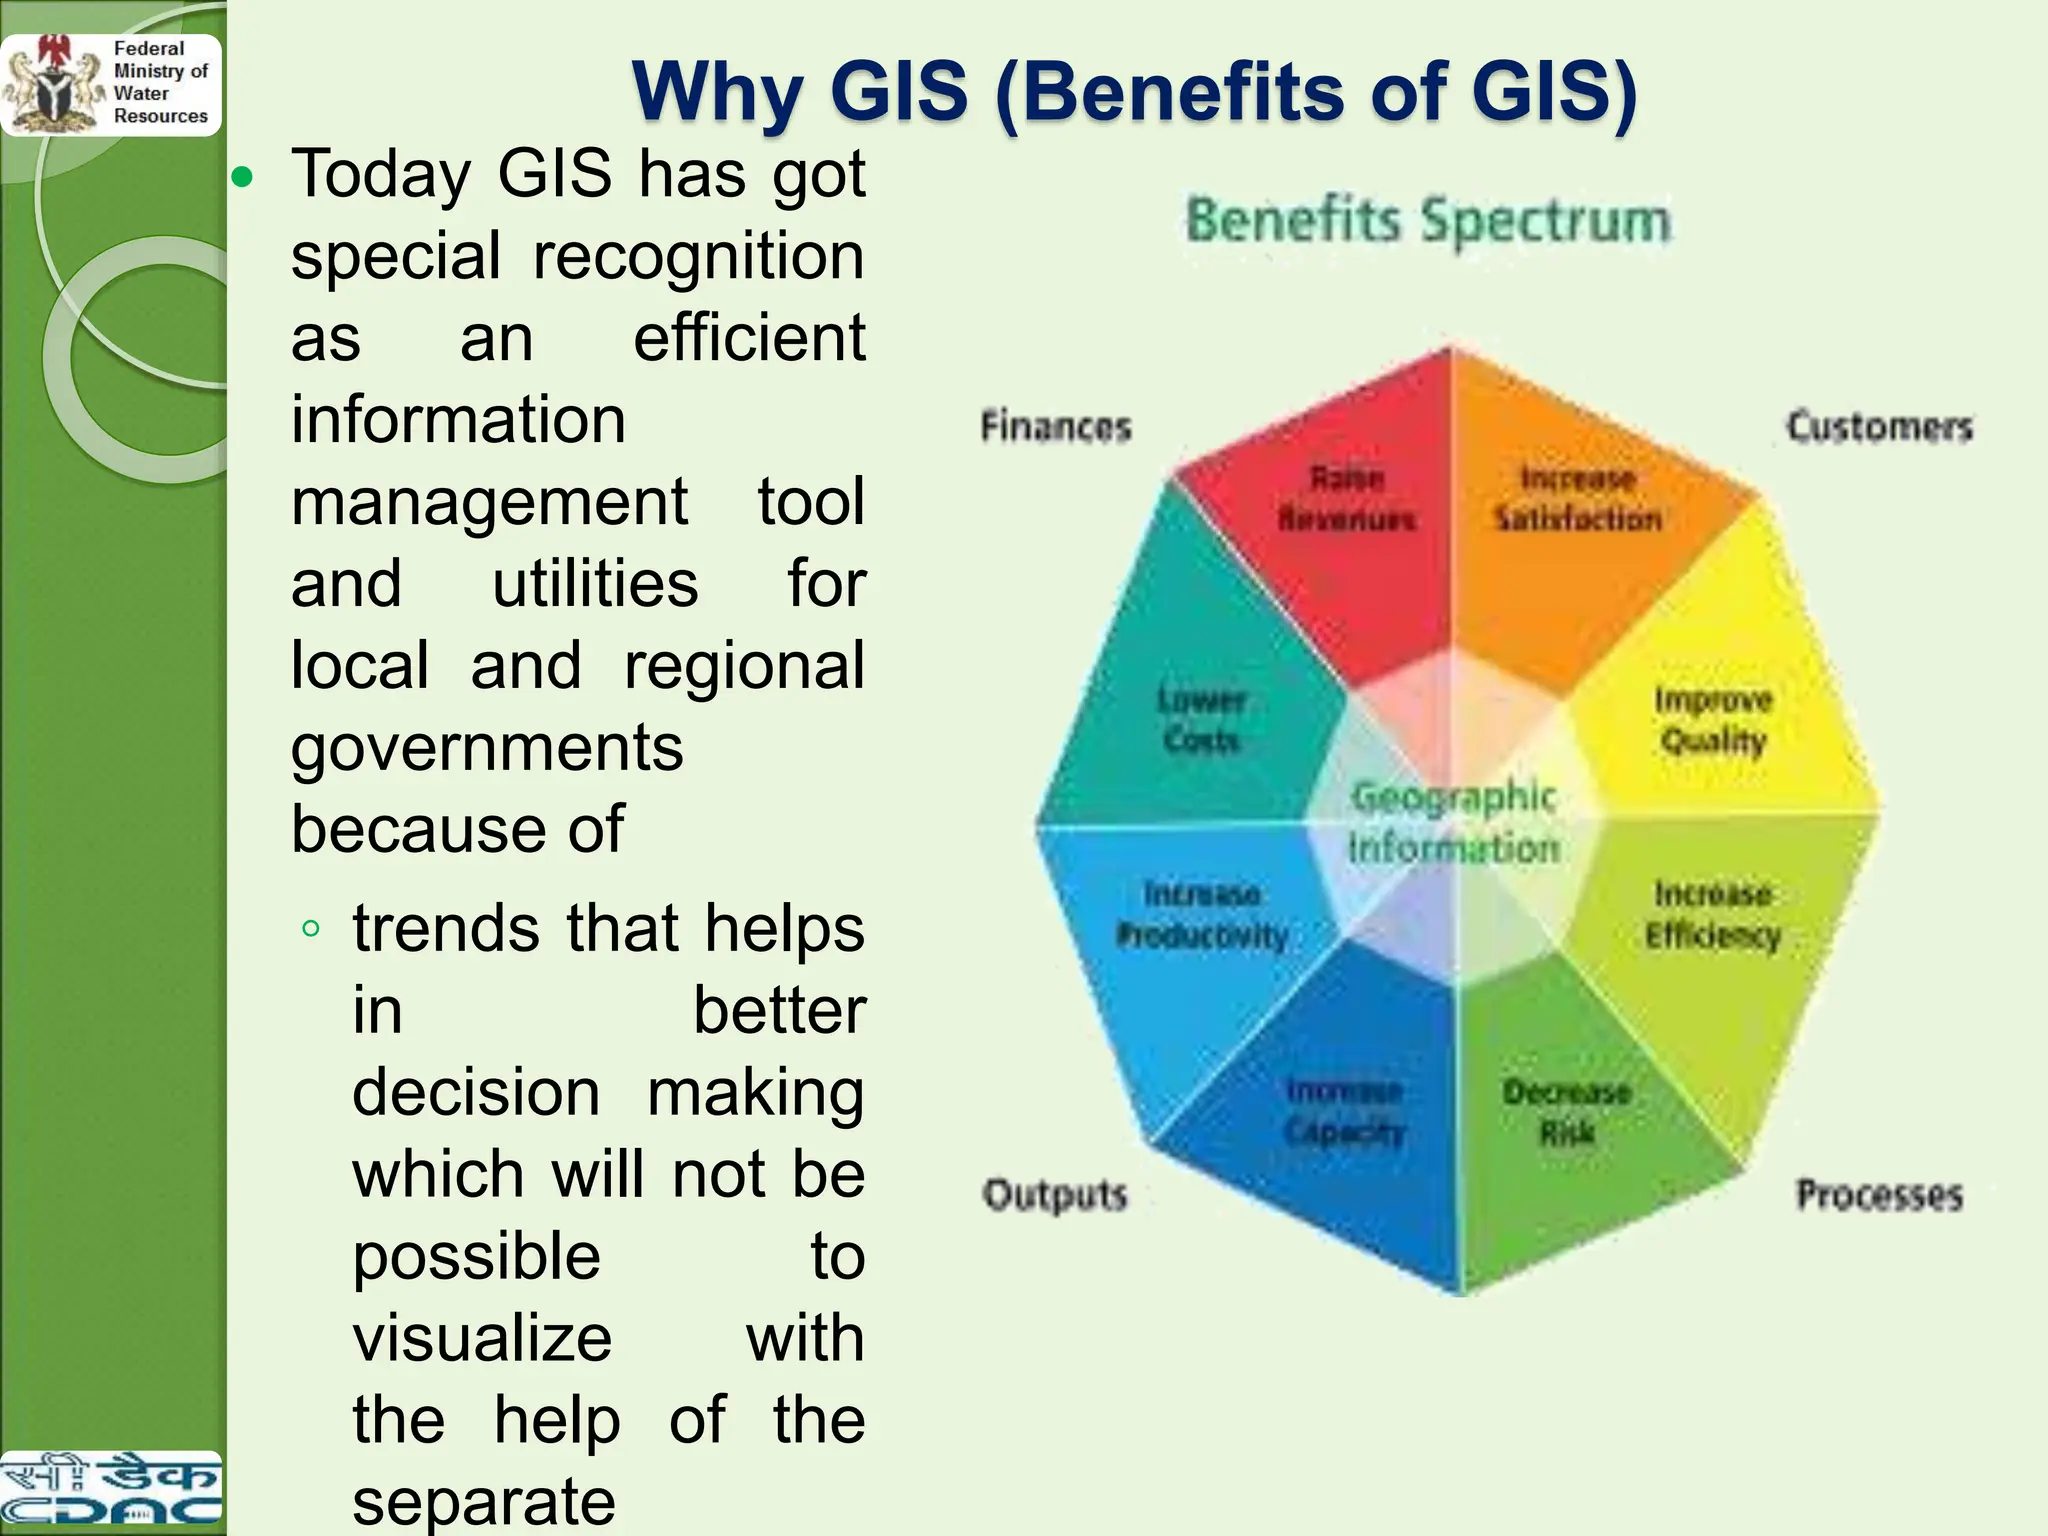
Why GIS (Benefitsof GIS)
Today GIS has got
special recognition
as an efficient
information
management tool
and utilities for
local and regional
governments
because of
◦ trends that helps
in better
decision making
which will not be
possible to
visualize with
the help of the
separate
40.
Why GIS (Benefitsof GIS)
The use of modern GIS offers many advantages over
paper maps like:
◦ Maximize the efficiency of planning and decision making
◦ Capacity to integrate information from many sources
◦ GIS provides location based Queries and sophisticated
Analysis tools to provide timely information.
◦ Better communication between departments/institutions
◦ Increased transparency and efficiency in public procedures
◦ Better resource allocation
◦ Can deal with the larger amounts of data
41.
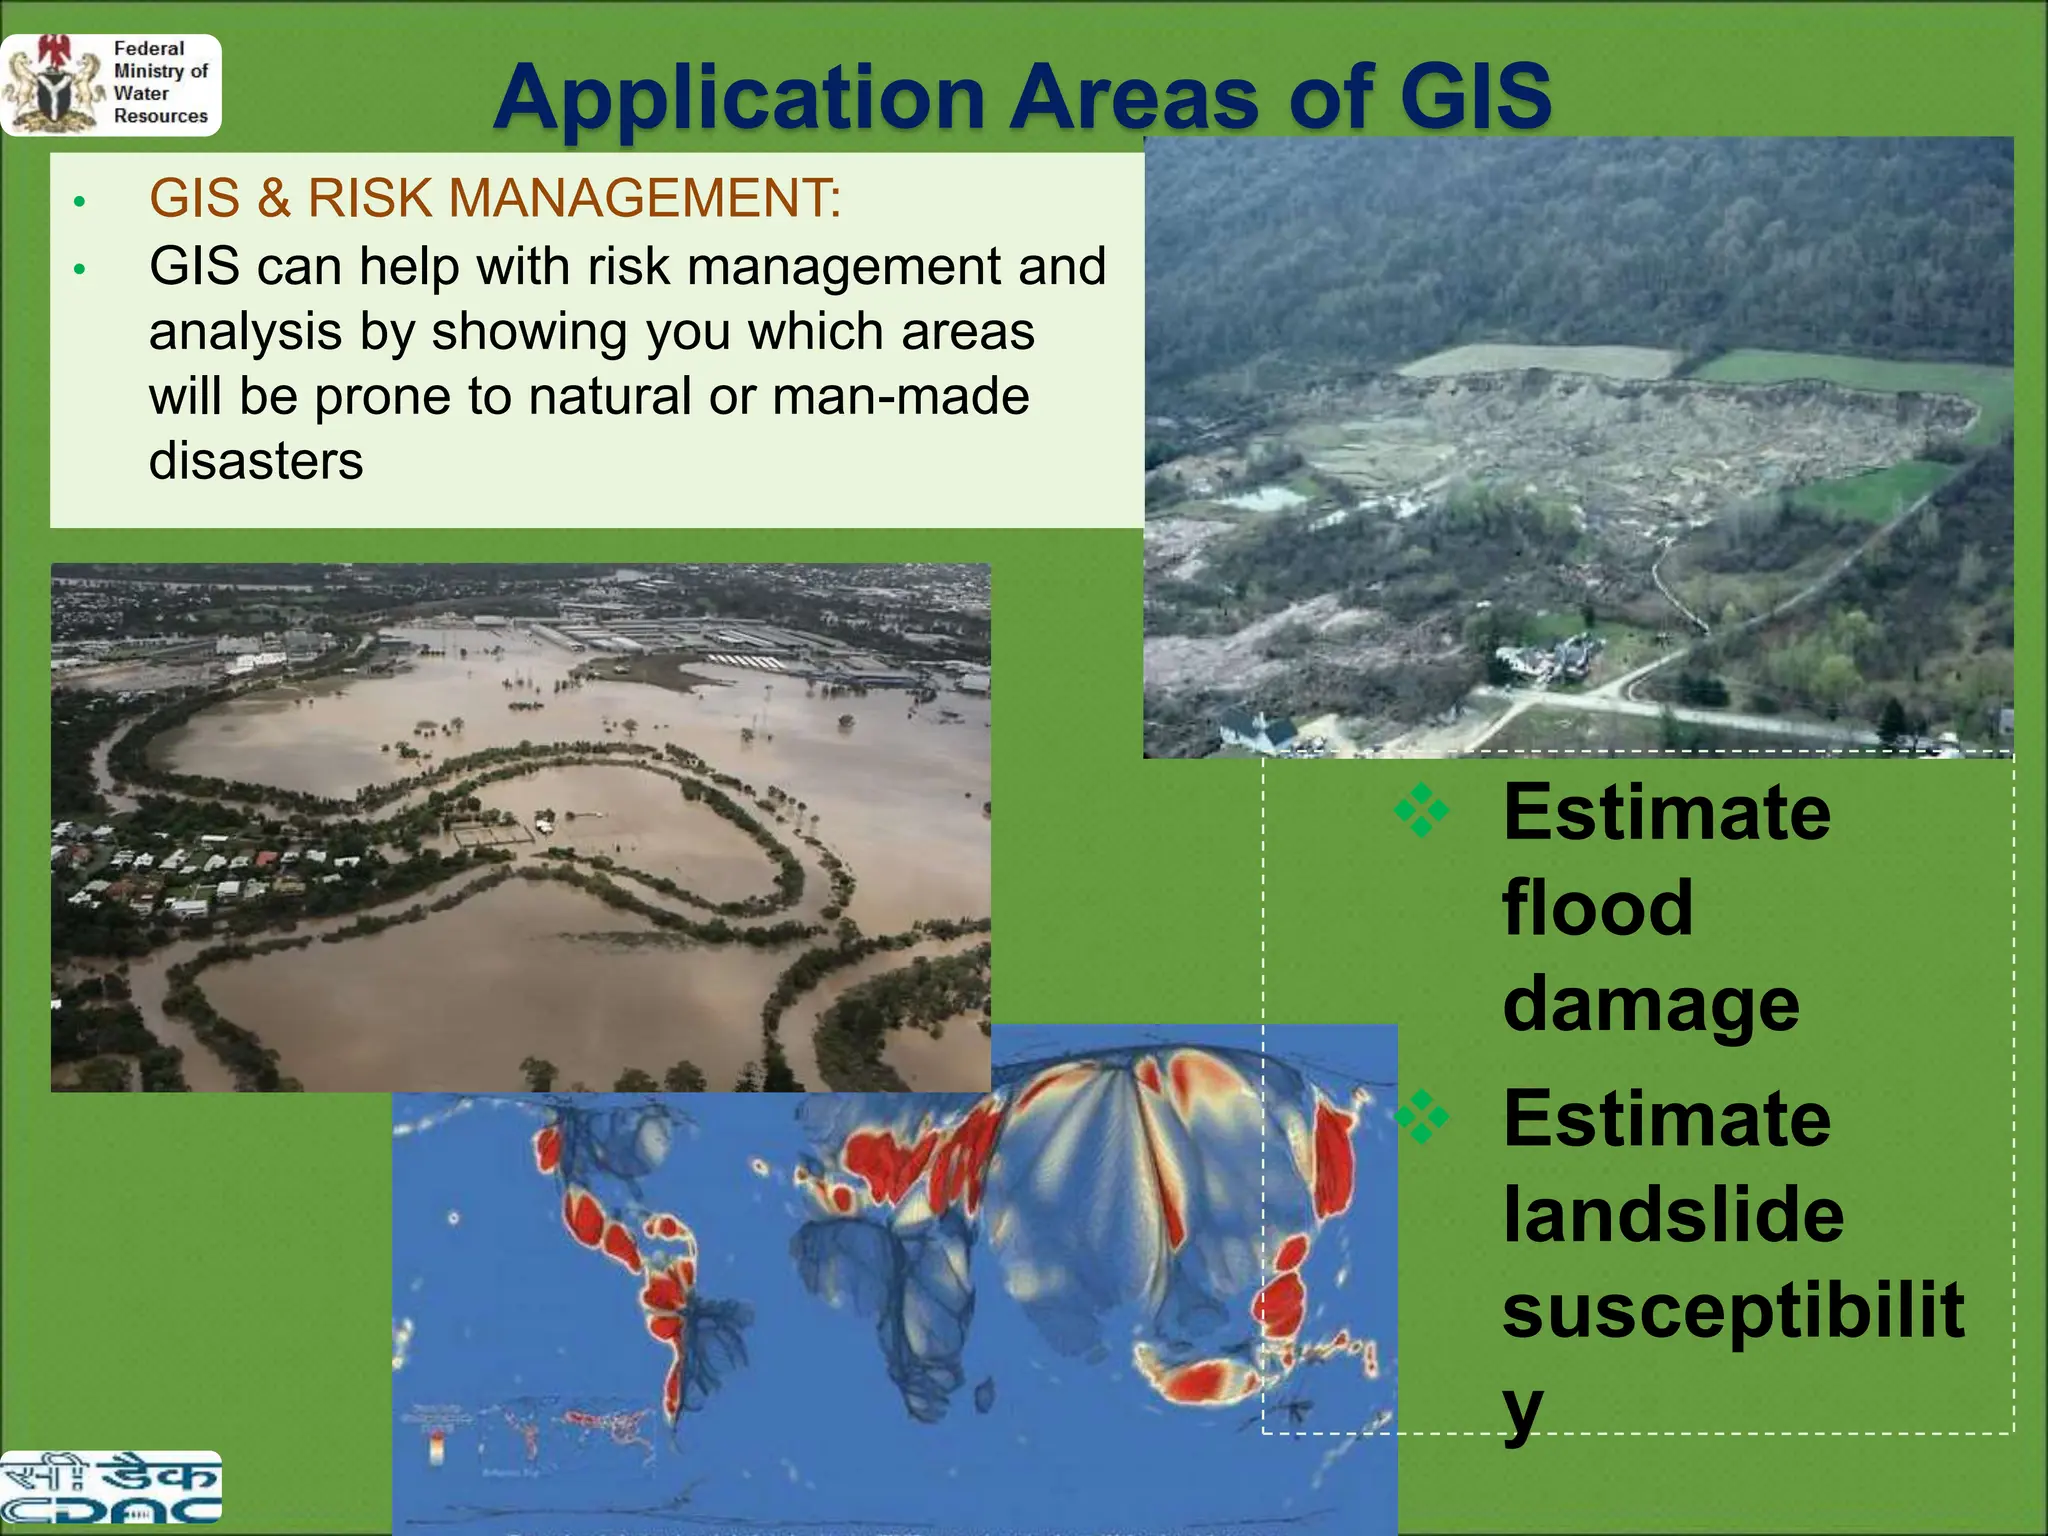
• GIS &RISK MANAGEMENT:
• GIS can help with risk management and
analysis by showing you which areas
will be prone to natural or man-made
disasters
Estimate
flood
damage
Estimate
landslide
susceptibilit
y
Application Areas of GIS
42.
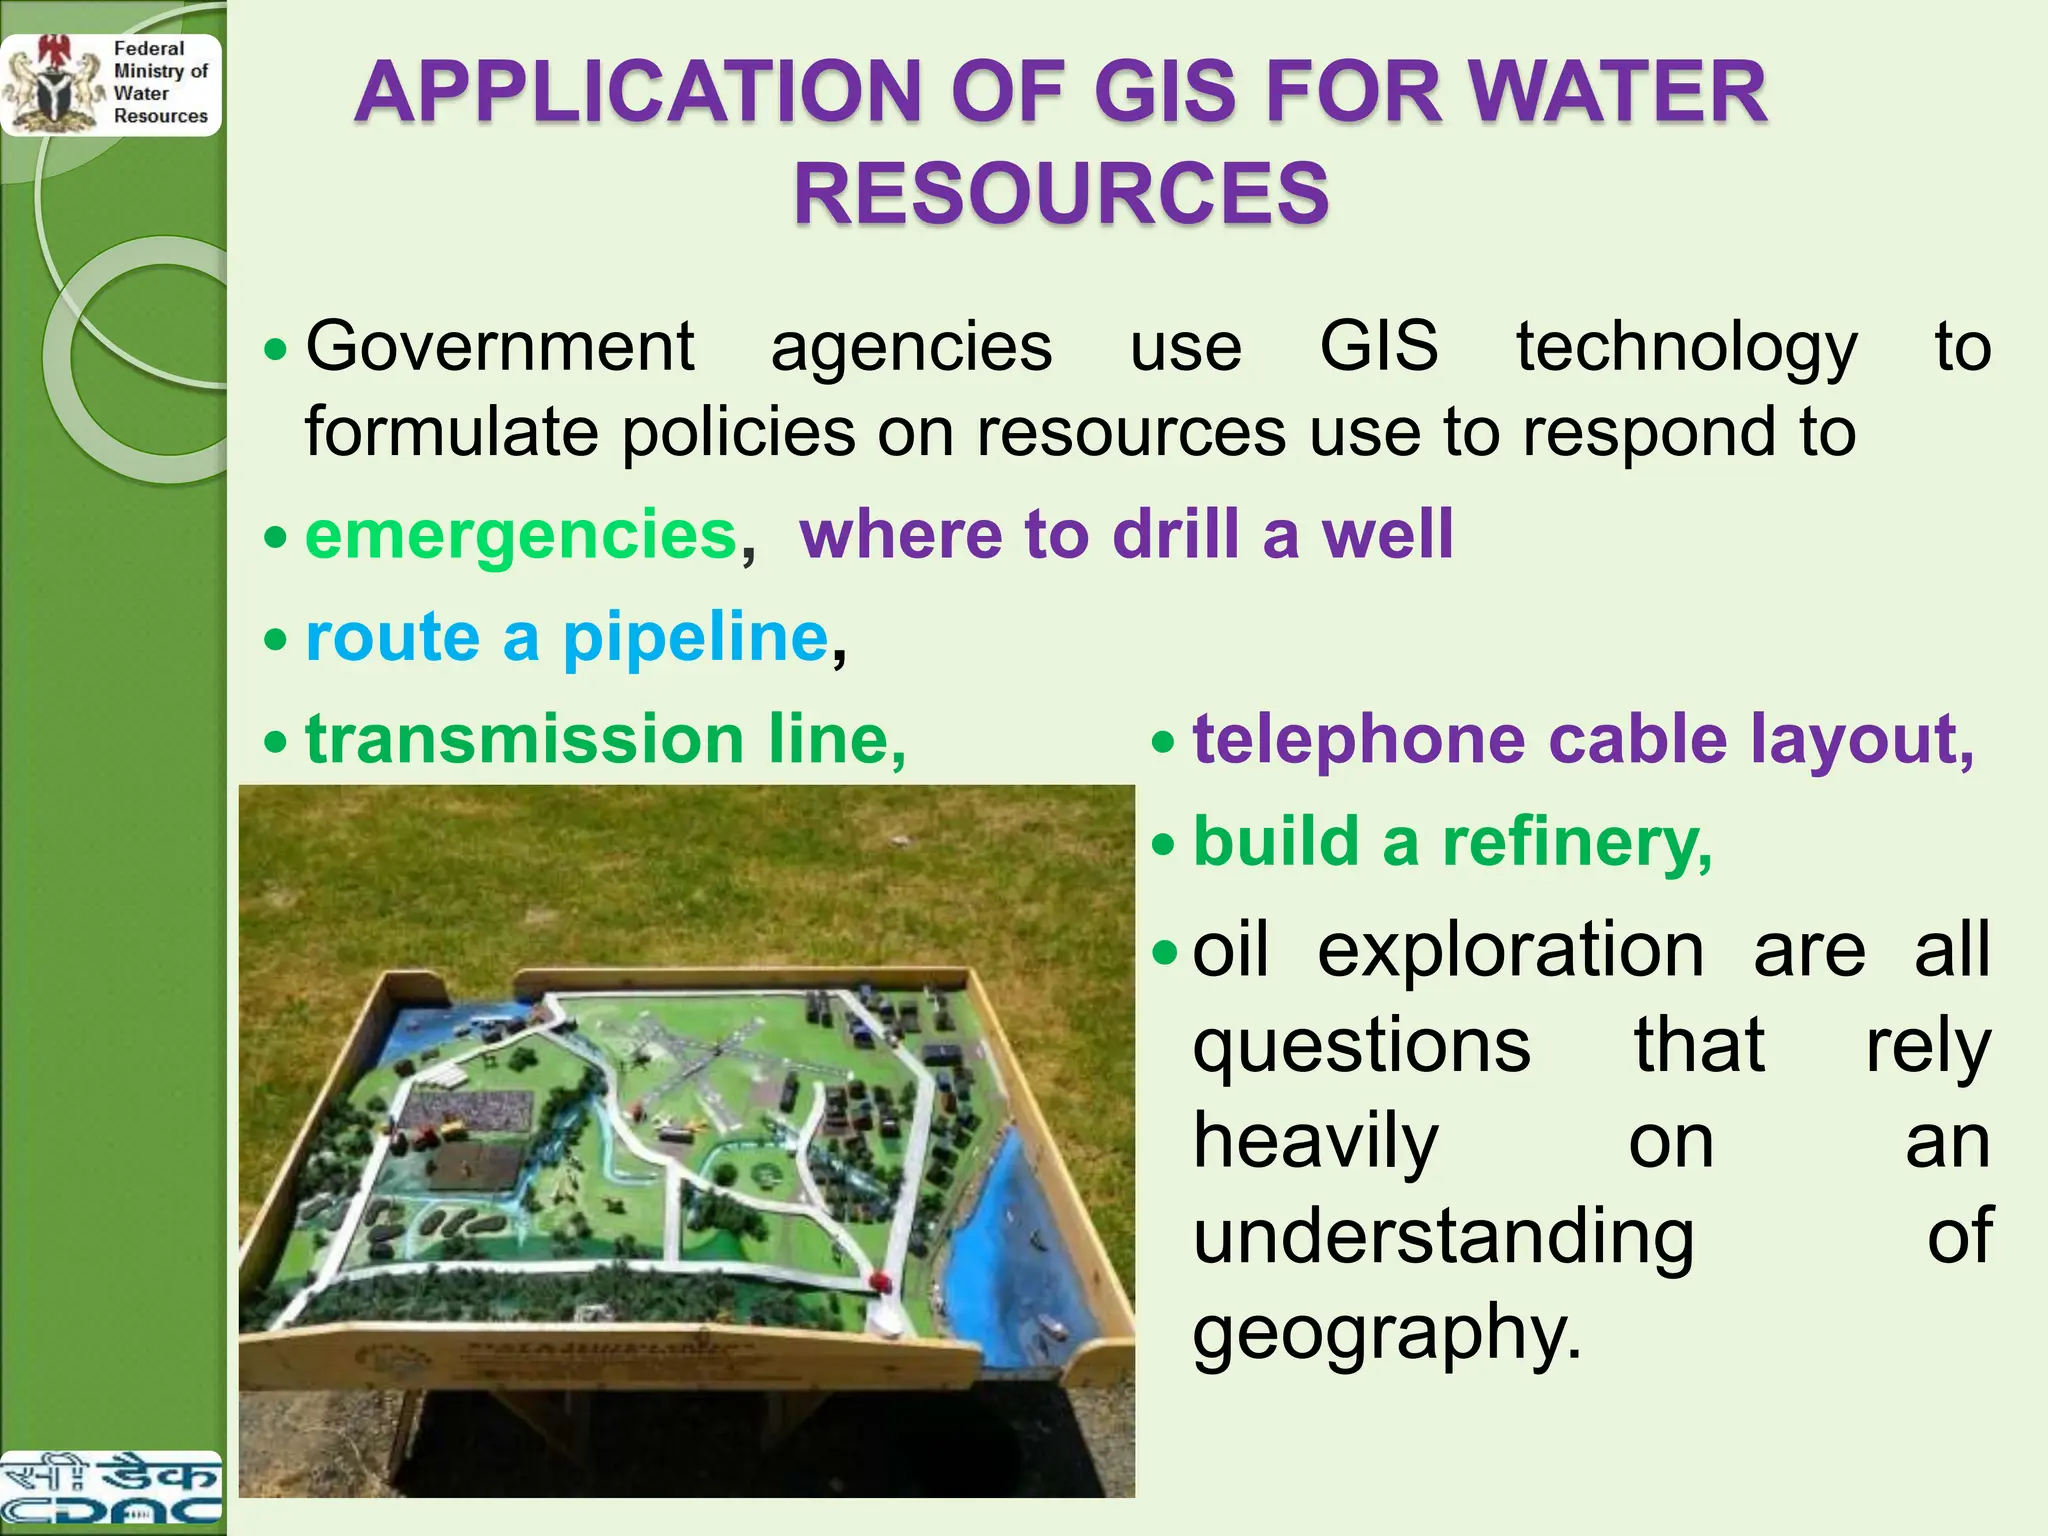
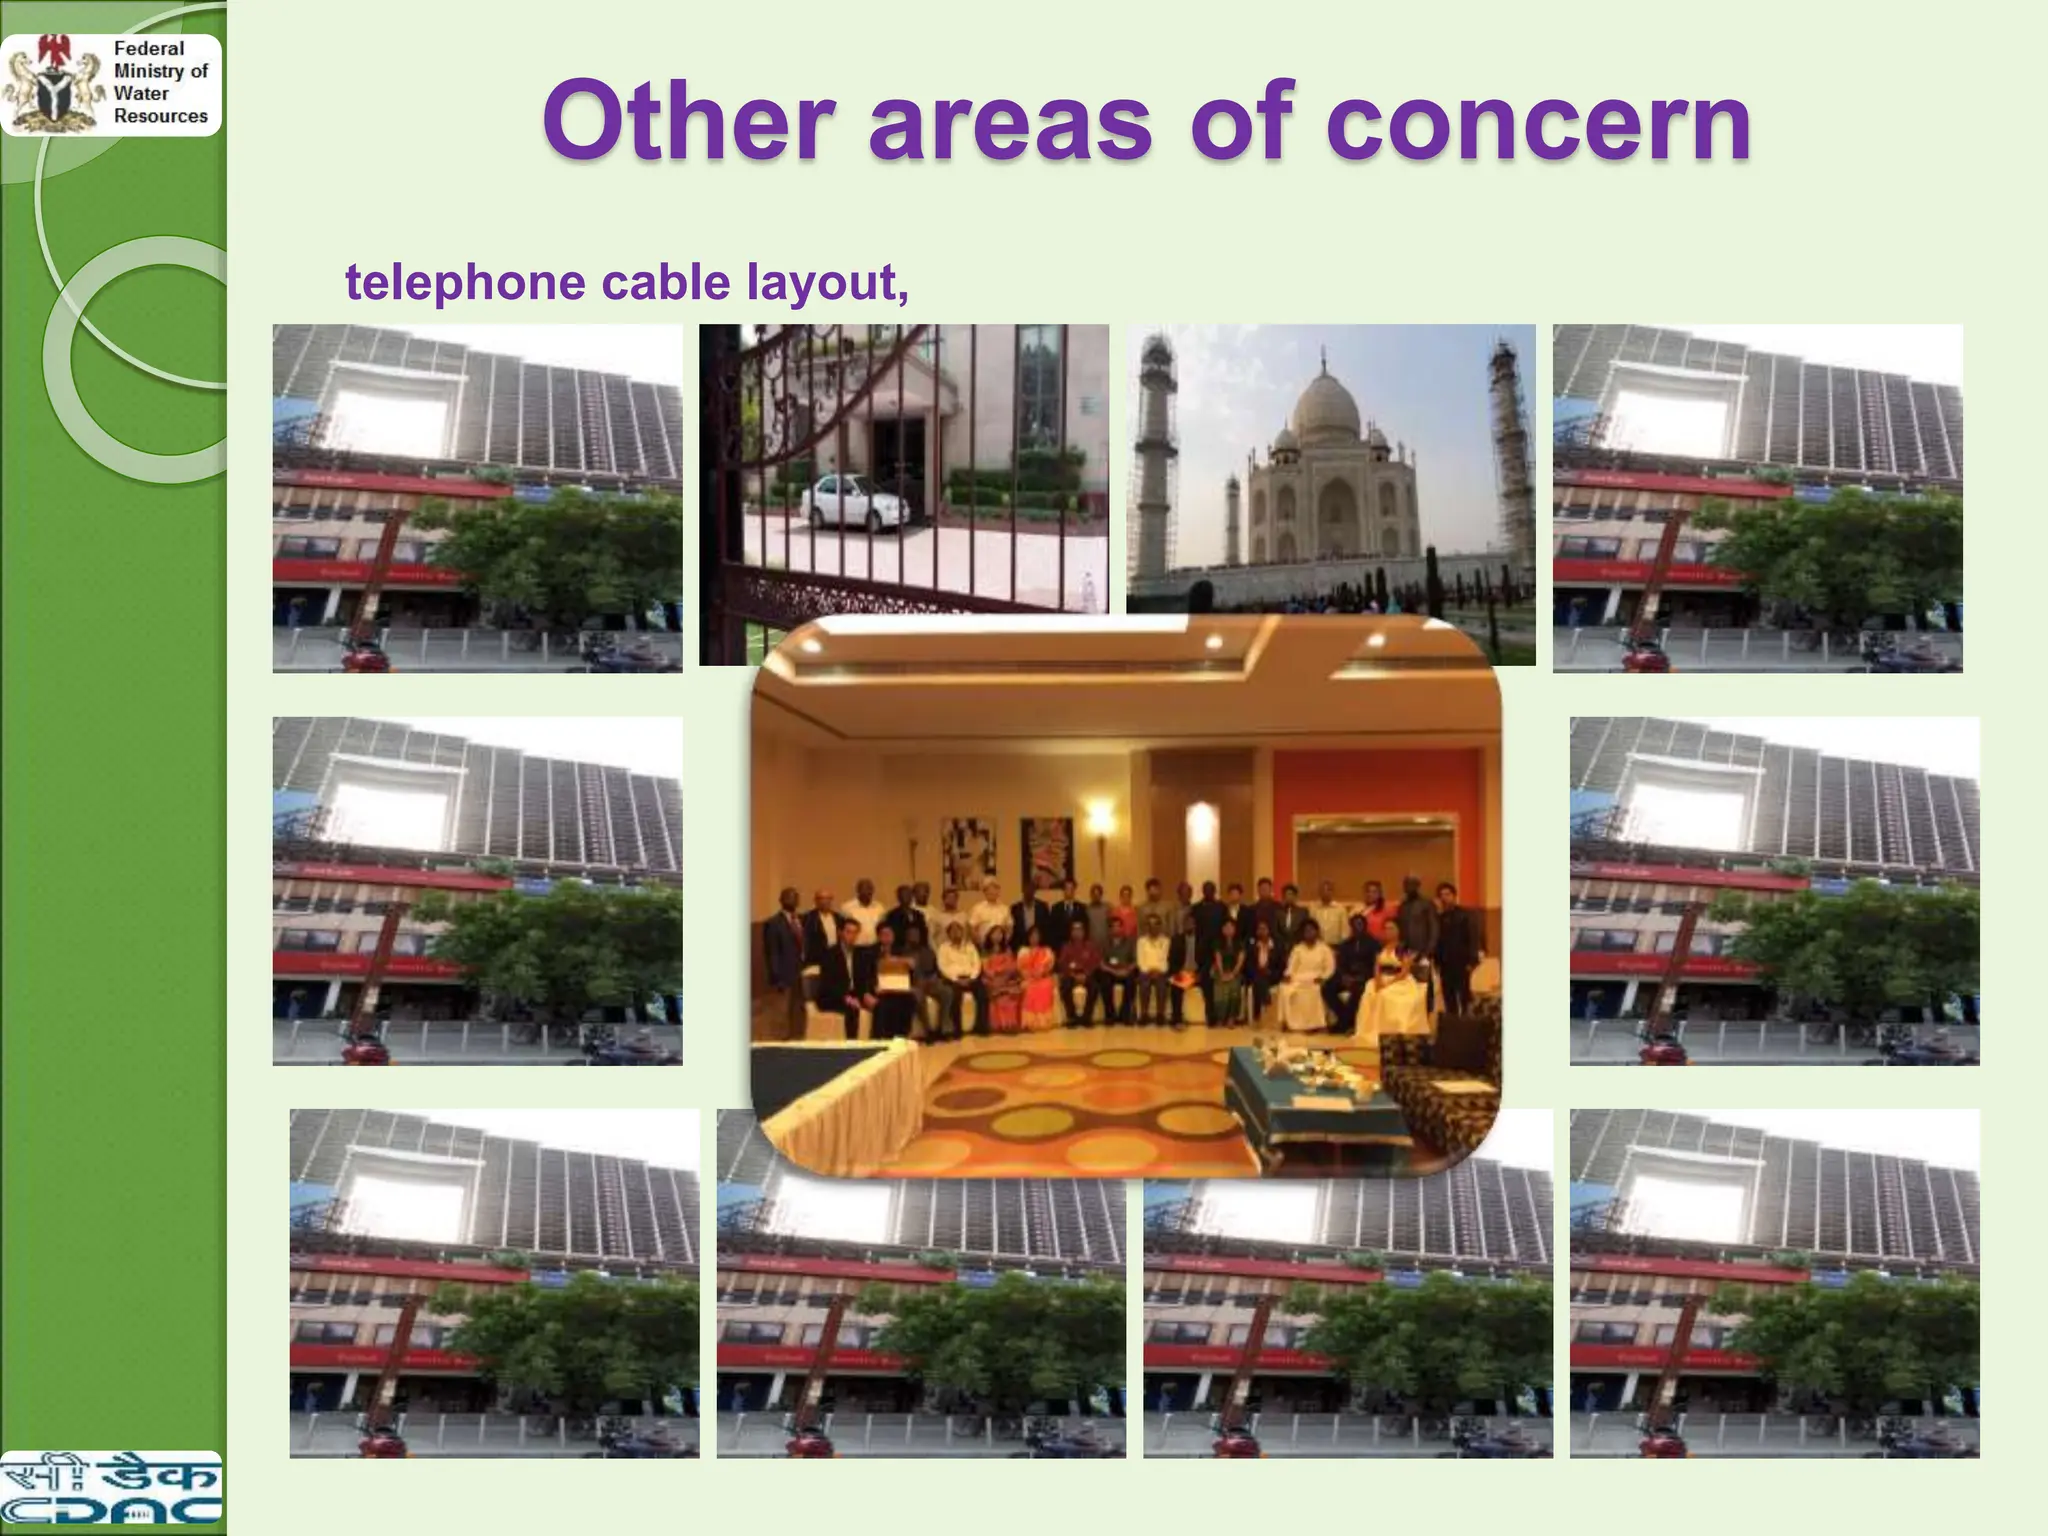
APPLICATION OF GISFOR WATER
RESOURCES
Government agencies use GIS technology to
formulate policies on resources use to respond to
emergencies, where to drill a well
route a pipeline,
transmission line, telephone cable layout,
build a refinery,
oil exploration are all
questions that rely
heavily on an
understanding of
geography.
43.
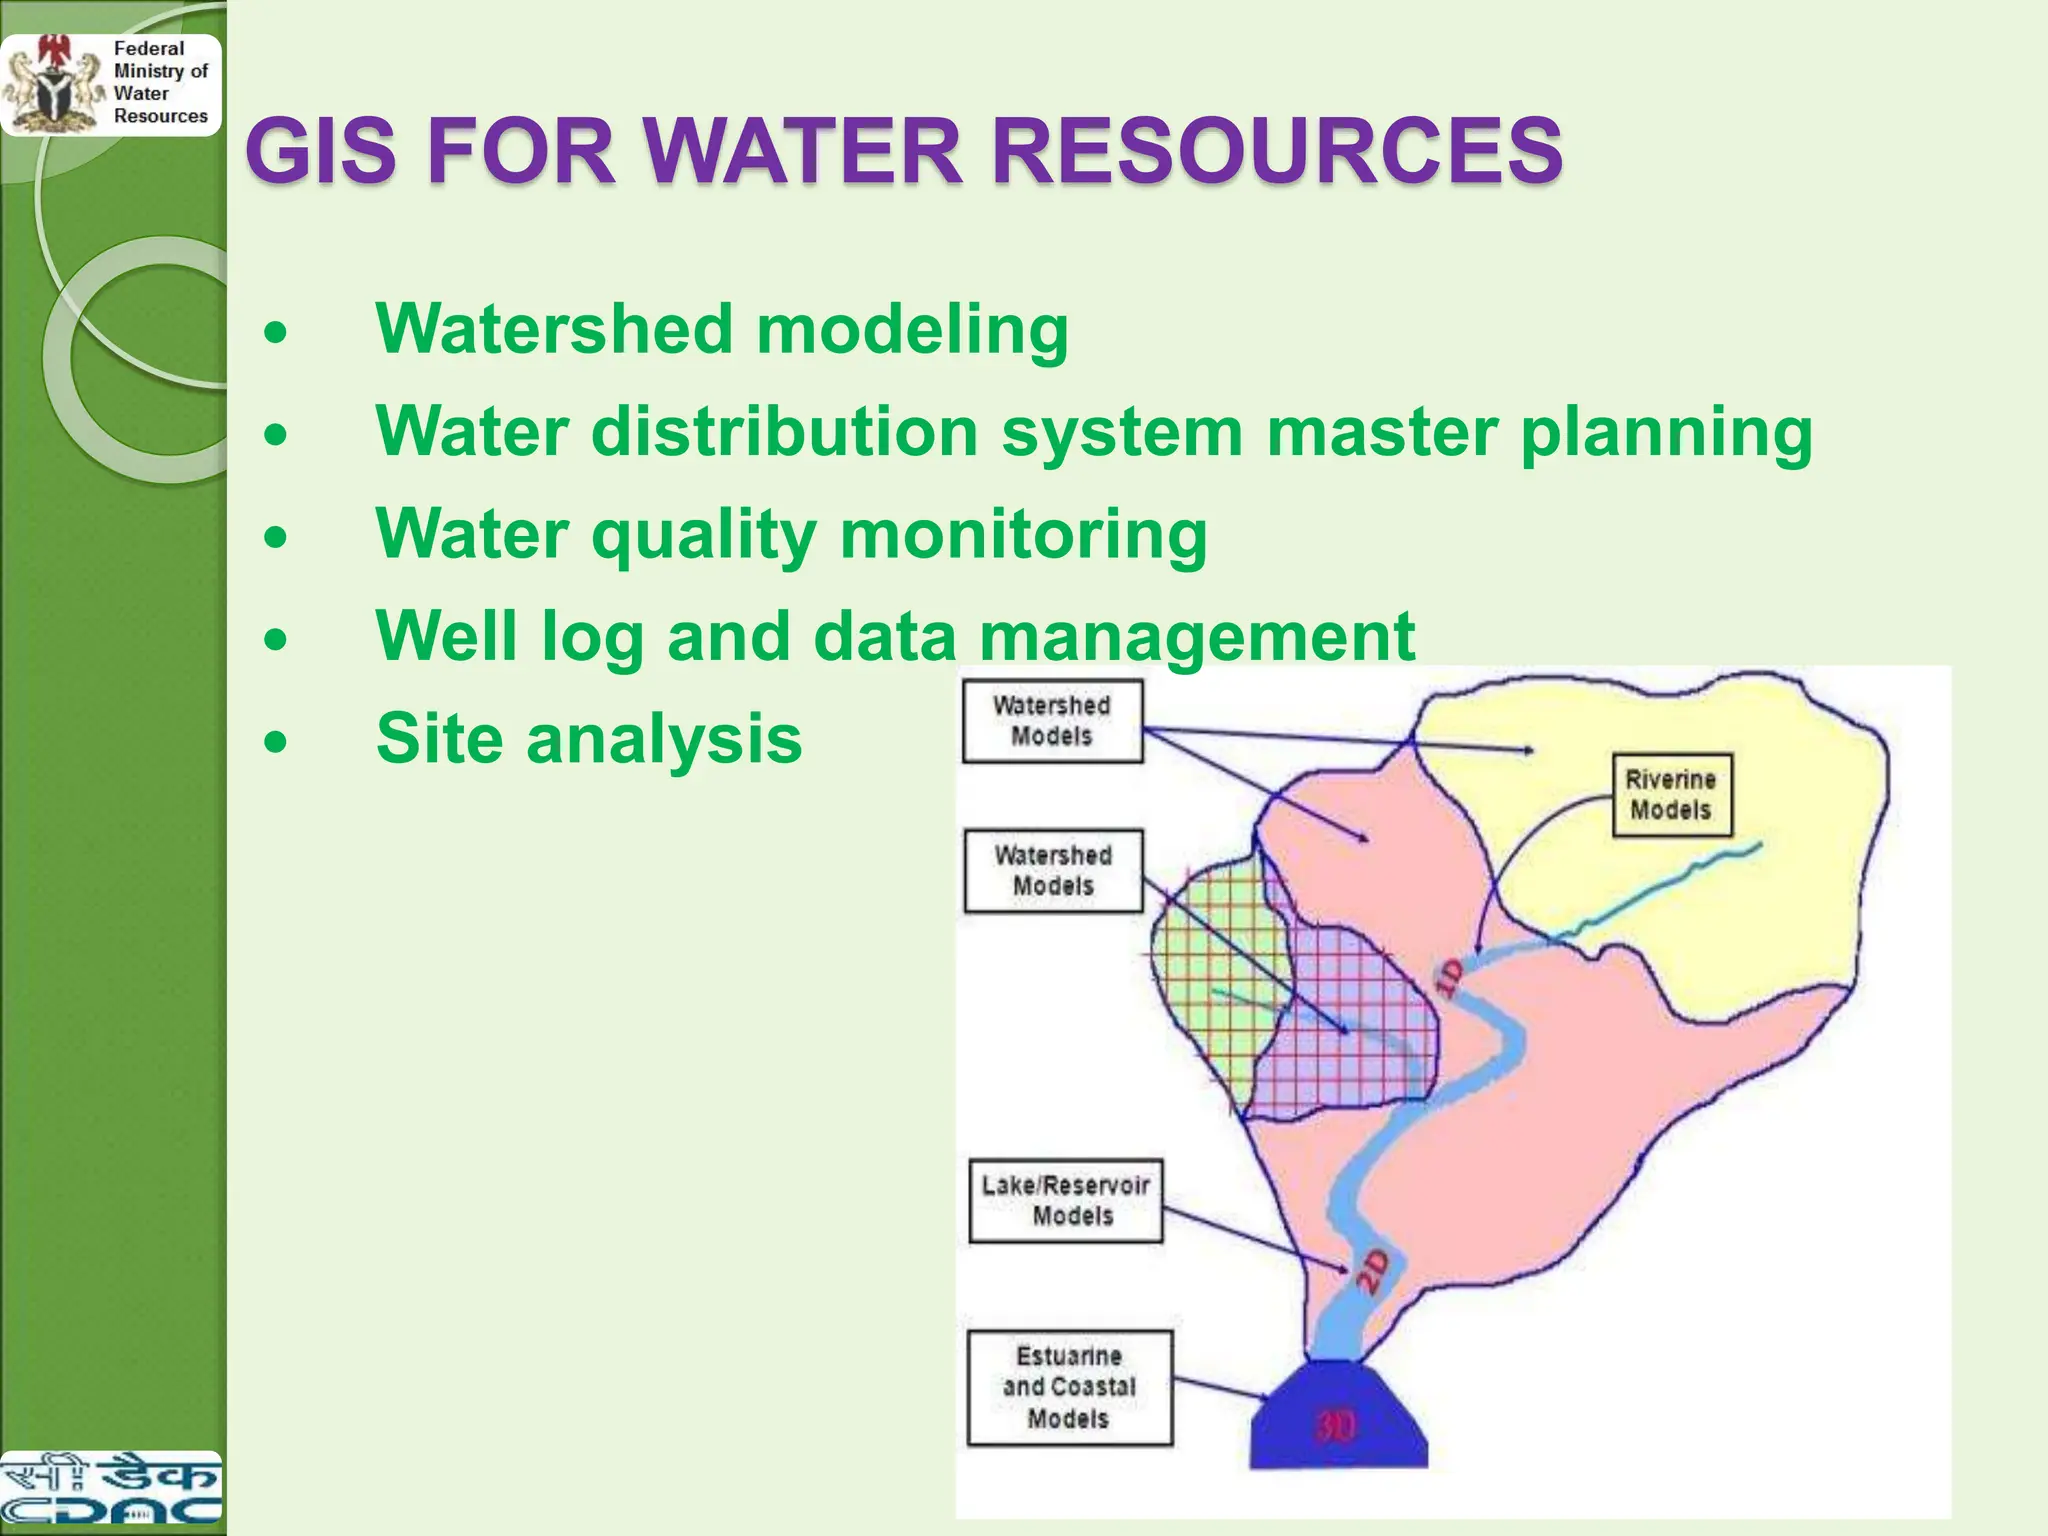
GIS FOR WATERRESOURCES
Watershed modeling
Water distribution system master planning
Water quality monitoring
Well log and data management
Site analysis
44.
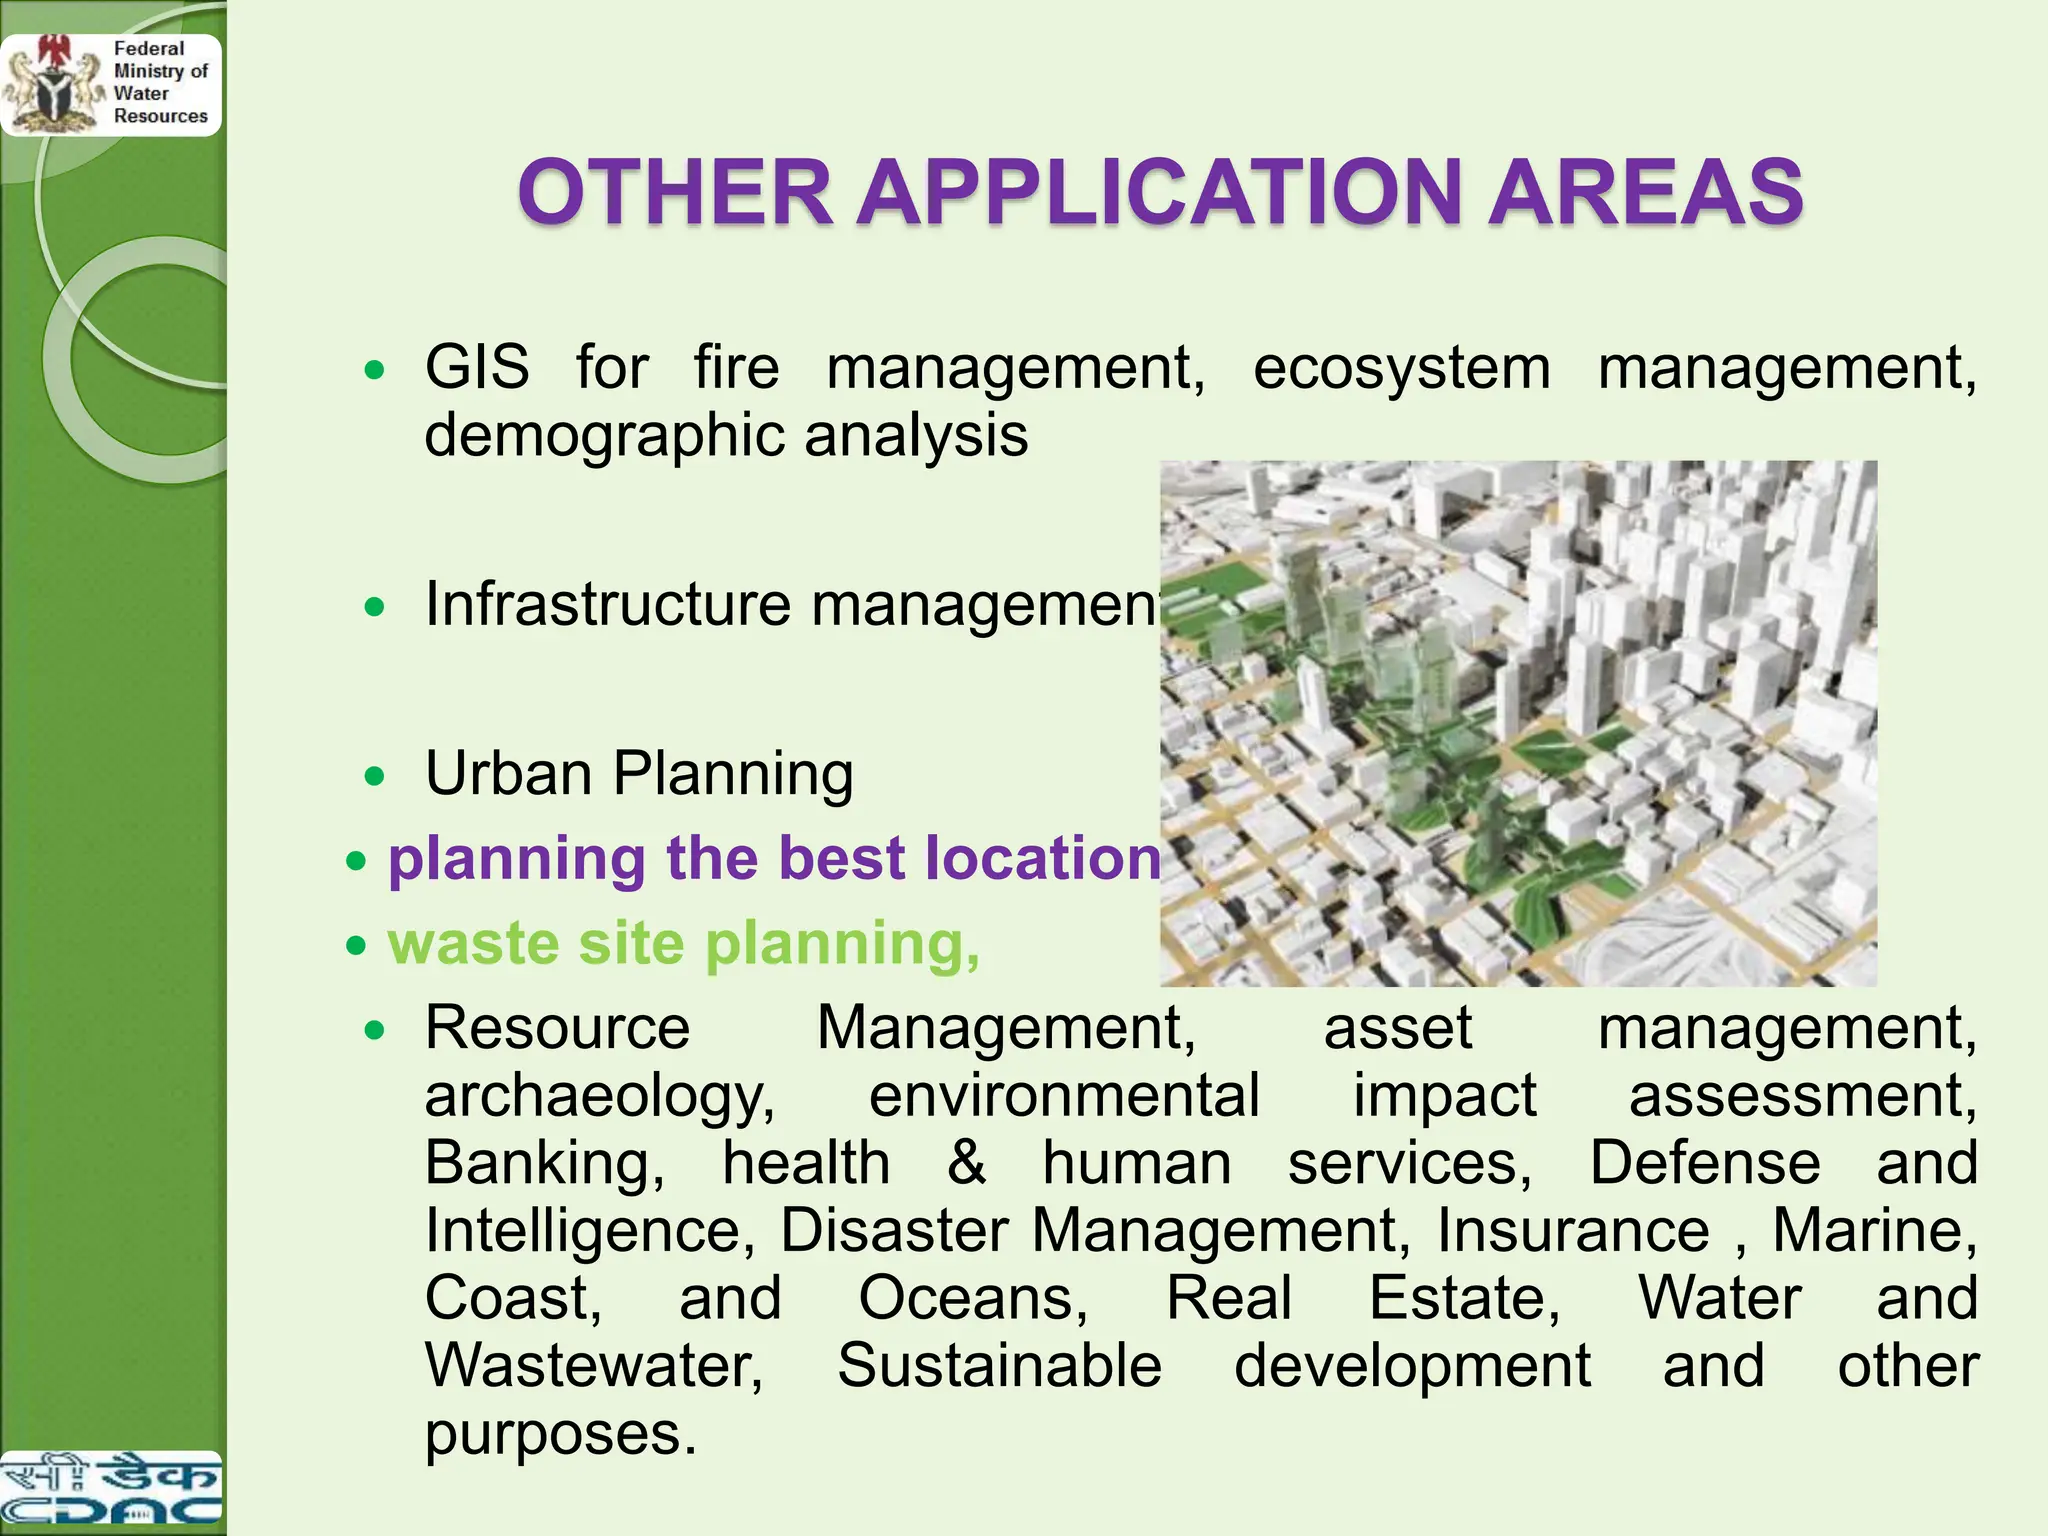
OTHER APPLICATION AREAS
GIS for fire management, ecosystem management,
demographic analysis
Infrastructure management
Urban Planning
planning the best location for a new stadium,
waste site planning,
Resource Management, asset management,
archaeology, environmental impact assessment,
Banking, health & human services, Defense and
Intelligence, Disaster Management, Insurance , Marine,
Coast, and Oceans, Real Estate, Water and
Wastewater, Sustainable development and other
purposes.
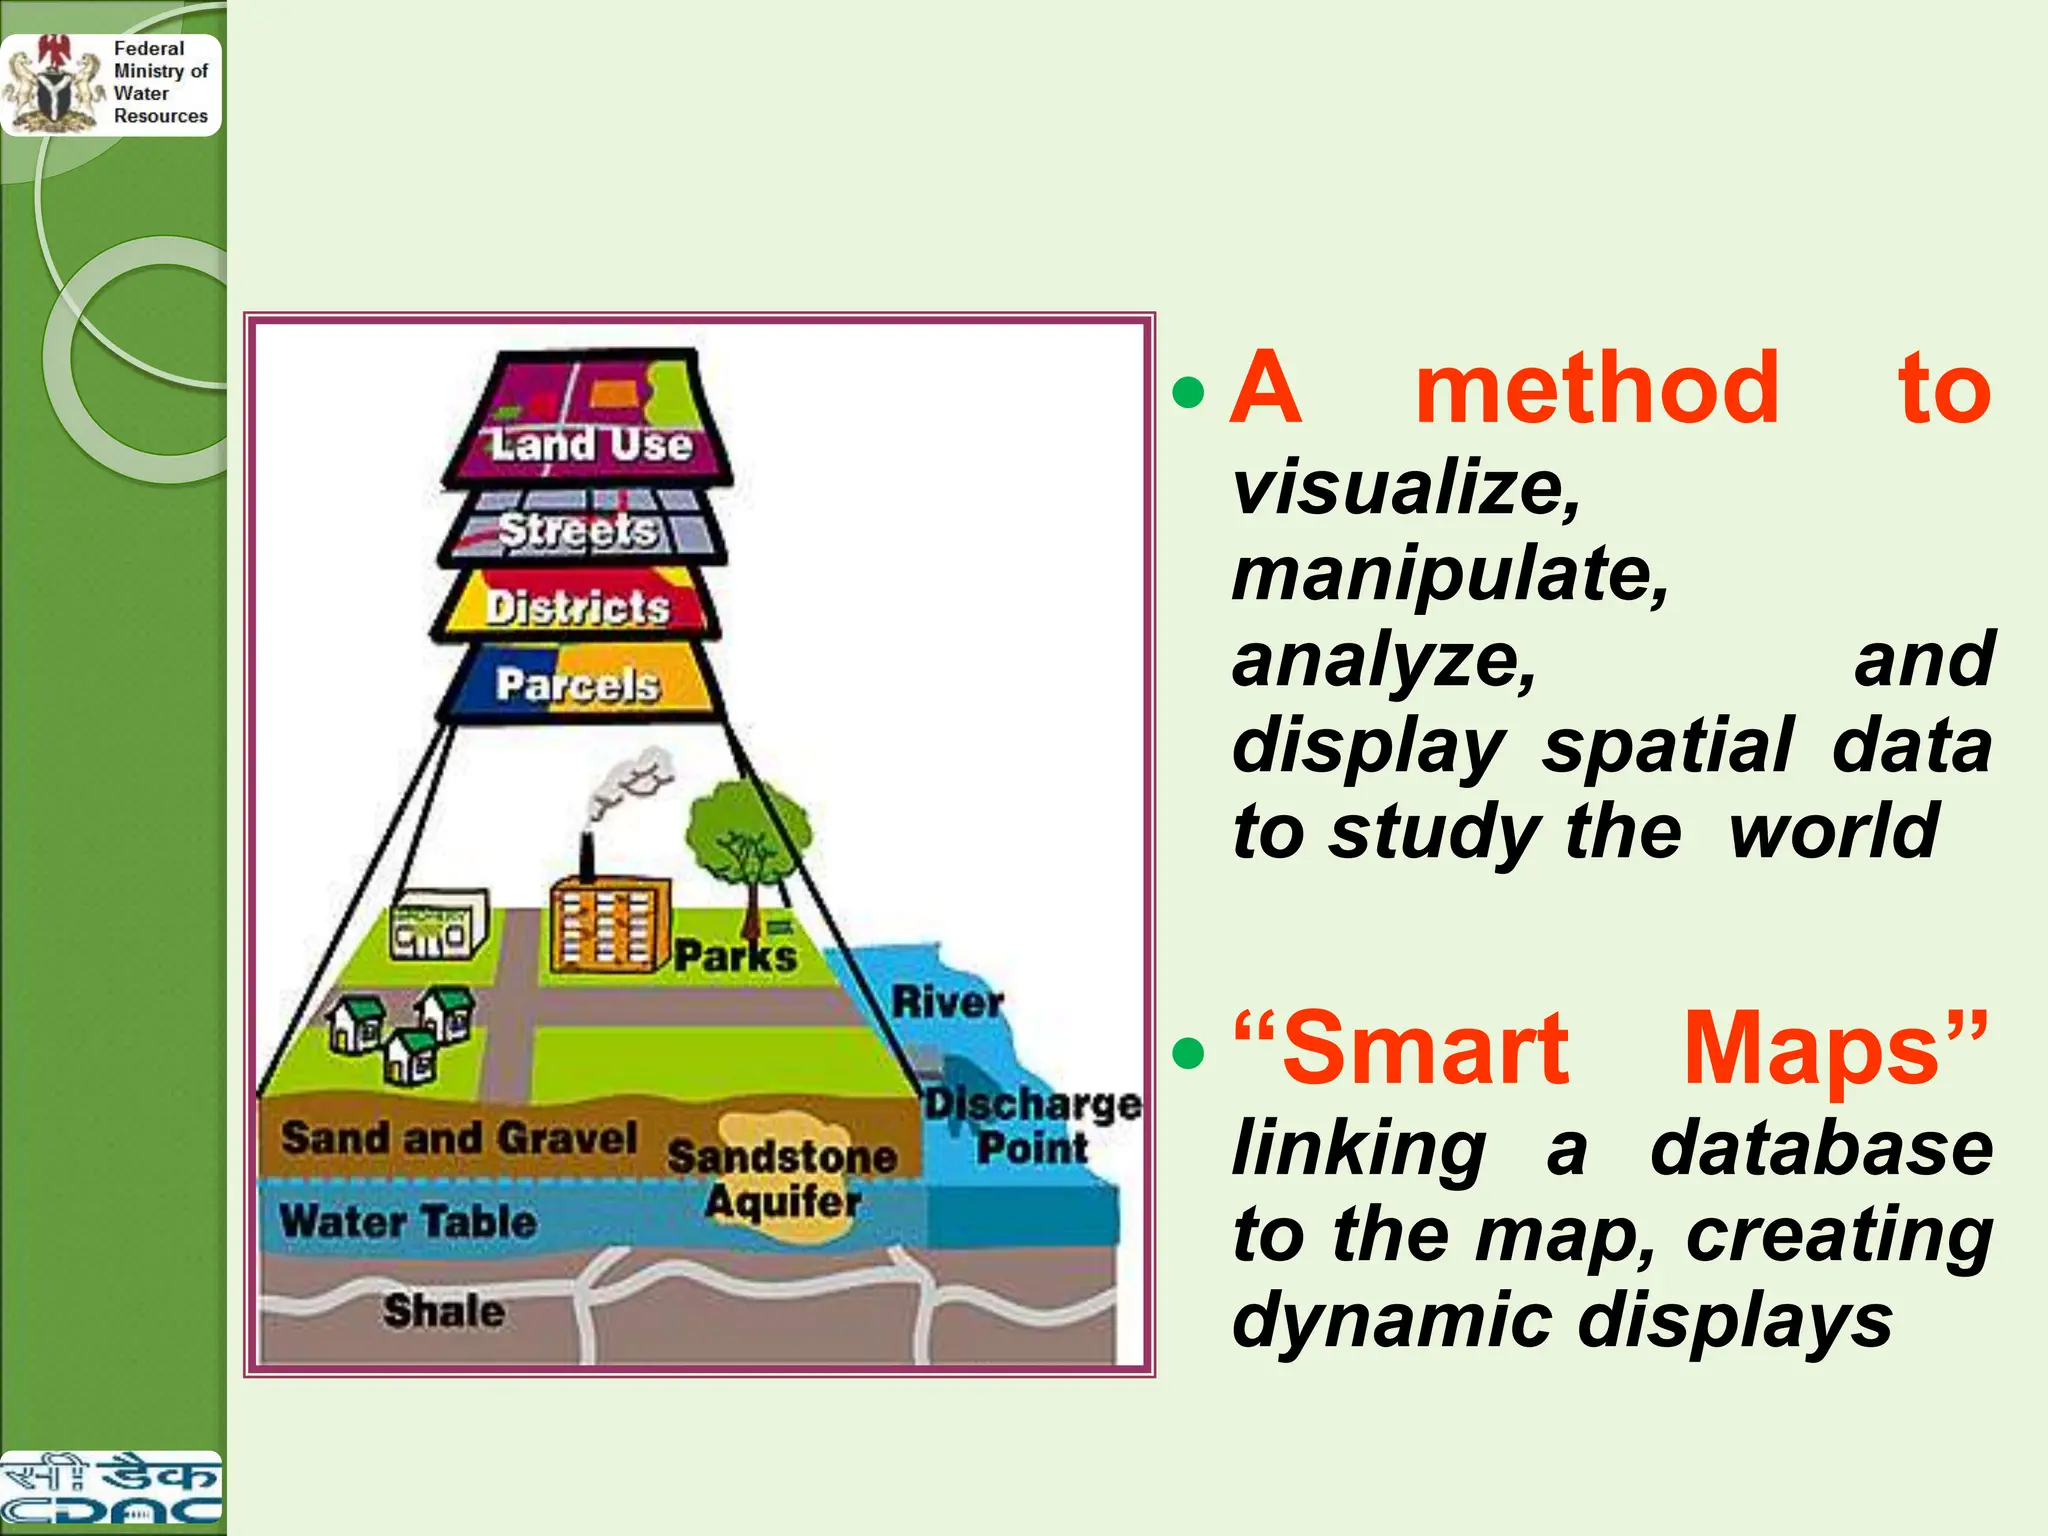
A methodto
visualize,
manipulate,
analyze, and
display spatial data
to study the world
“Smart Maps”
linking a database
to the map, creating
dynamic displays
47.
SOFTWARE
The listof software used during the training
programme are;
ERDAS IMAGINE 9.2
ARC GIS 10.2.2
MAPINFO 8.5
ORACLE 10g
MICROSOFT VISUAL STUDIO 2012
MICROSOFT SQL SERVER 2012
POSTGRES AND POSTGIS
PYTHON 2.7.6
QGIS
APACHE-TOMCAT-6.0.36
XAMPP
GOOGLE API