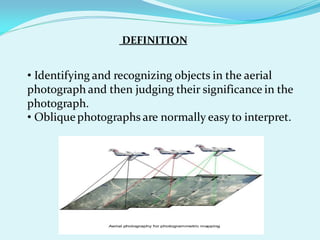
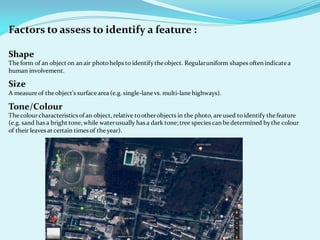
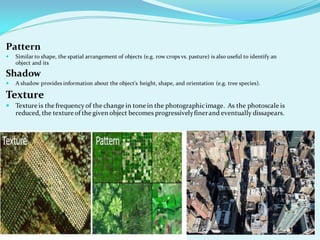
This document defines photo interpretation and lists factors that can be assessed to identify features in aerial photographs, such as shape, size, tone, pattern, shadow, texture, and association. It provides examples of how these factors help with identification. It also lists applications of photo interpretation in agriculture like crop classification and mapping, and in forestry like assessing forest cover, type, and changes over time.
To meet the various information requirements in forest management, different data sources like field survey, aerial photography, and satellite imagery is used, depending on the level of detail required and the extension of the area under study.
Remote Sensing: Normalized Difference Vegetation Index (NDVI)Kamlesh Kumar
The Normalized Difference Vegetation Index (NDVI) is a numerical indicator that uses the visible and near-infrared (NIR) bands of the electromagnetic spectrum to analyze whether the target (image) being observed contains green vegetation or not. Healthy vegetation (chlorophyll) reflects more near-infrared (NIR) and green light compared to other wavelengths. But it absorbs more red and blue light. This is why our eyes see vegetation as the colour green. If we could see near-infrared, then it would be strong for vegetation too.
It is basically measured through the use of Intensity, Hue and saturation of an image and through pixels as well.
The density of vegetation (NDVI) at a certain point on the image is equal to the difference in the intensities of reflected light in the red and infrared range divided by the sum of these intensities.
푁퐷푉퐼=((푁퐼푅−푅퐸퐷))/((푁퐼푅+푅퐸퐷))
The result of this formula generates a value between -1 and +1. If you have low reflectance (low values) in the red band and high reflectance in the NIR, this will yield a high NDVI value. And vice versa.
IMAGE INTERPRETATION TECHNIQUES of surveyKaran Patel
Image interpretation is the process of examining an aerial photo or digital remote sensing image and manually identifying the features in that image. This method can be highly reliable and a wide variety of features can be identified, such as riparian vegetation type and condition, and anthropogenic features
Remote sensing and aerial photography study notes. Including concept and history of RS, visual image interpretation, digital image interpretation, application of RS, digital imaging, application of remote sensing etc.
RS & GIS, Image Interpretation, Methods of Image interpretation, Types of interpretation, Factors governing image interpretation, Activities to interpret image, Sensors, Role of sensors in Image derivation, Aerial Photography, LISS-3, Image characteristics, Special characteristics, Shadow, Texture, Pattern, associated features in images
The Art of the Pitch: WordPress Relationships and SalesLaura Byrne
Clients don’t know what they don’t know. What web solutions are right for them? How does WordPress come into the picture? How do you make sure you understand scope and timeline? What do you do if sometime changes?
All these questions and more will be explored as we talk about matching clients’ needs with what your agency offers without pulling teeth or pulling your hair out. Practical tips, and strategies for successful relationship building that leads to closing the deal.
LF Energy Webinar: Electrical Grid Modelling and Simulation Through PowSyBl -...DanBrown980551
Do you want to learn how to model and simulate an electrical network from scratch in under an hour?
Then welcome to this PowSyBl workshop, hosted by Rte, the French Transmission System Operator (TSO)!
During the webinar, you will discover the PowSyBl ecosystem as well as handle and study an electrical network through an interactive Python notebook.
PowSyBl is an open source project hosted by LF Energy, which offers a comprehensive set of features for electrical grid modelling and simulation. Among other advanced features, PowSyBl provides:
- A fully editable and extendable library for grid component modelling;
- Visualization tools to display your network;
- Grid simulation tools, such as power flows, security analyses (with or without remedial actions) and sensitivity analyses;
The framework is mostly written in Java, with a Python binding so that Python developers can access PowSyBl functionalities as well.
What you will learn during the webinar:
- For beginners: discover PowSyBl's functionalities through a quick general presentation and the notebook, without needing any expert coding skills;
- For advanced developers: master the skills to efficiently apply PowSyBl functionalities to your real-world scenarios.
Epistemic Interaction - tuning interfaces to provide information for AI supportAlan Dix
Paper presented at SYNERGY workshop at AVI 2024, Genoa, Italy. 3rd June 2024
https://alandix.com/academic/papers/synergy2024-epistemic/
As machine learning integrates deeper into human-computer interactions, the concept of epistemic interaction emerges, aiming to refine these interactions to enhance system adaptability. This approach encourages minor, intentional adjustments in user behaviour to enrich the data available for system learning. This paper introduces epistemic interaction within the context of human-system communication, illustrating how deliberate interaction design can improve system understanding and adaptation. Through concrete examples, we demonstrate the potential of epistemic interaction to significantly advance human-computer interaction by leveraging intuitive human communication strategies to inform system design and functionality, offering a novel pathway for enriching user-system engagements.
Kubernetes & AI - Beauty and the Beast !?! @KCD Istanbul 2024Tobias Schneck
As AI technology is pushing into IT I was wondering myself, as an “infrastructure container kubernetes guy”, how get this fancy AI technology get managed from an infrastructure operational view? Is it possible to apply our lovely cloud native principals as well? What benefit’s both technologies could bring to each other?
Let me take this questions and provide you a short journey through existing deployment models and use cases for AI software. On practical examples, we discuss what cloud/on-premise strategy we may need for applying it to our own infrastructure to get it to work from an enterprise perspective. I want to give an overview about infrastructure requirements and technologies, what could be beneficial or limiting your AI use cases in an enterprise environment. An interactive Demo will give you some insides, what approaches I got already working for real.
Dev Dives: Train smarter, not harder – active learning and UiPath LLMs for do...UiPathCommunity
💥 Speed, accuracy, and scaling – discover the superpowers of GenAI in action with UiPath Document Understanding and Communications Mining™:
See how to accelerate model training and optimize model performance with active learning
Learn about the latest enhancements to out-of-the-box document processing – with little to no training required
Get an exclusive demo of the new family of UiPath LLMs – GenAI models specialized for processing different types of documents and messages
This is a hands-on session specifically designed for automation developers and AI enthusiasts seeking to enhance their knowledge in leveraging the latest intelligent document processing capabilities offered by UiPath.
Speakers:
👨🏫 Andras Palfi, Senior Product Manager, UiPath
👩🏫 Lenka Dulovicova, Product Program Manager, UiPath
GraphRAG is All You need? LLM & Knowledge GraphGuy Korland
Guy Korland, CEO and Co-founder of FalkorDB, will review two articles on the integration of language models with knowledge graphs.
1. Unifying Large Language Models and Knowledge Graphs: A Roadmap.
https://arxiv.org/abs/2306.08302
2. Microsoft Research's GraphRAG paper and a review paper on various uses of knowledge graphs:
https://www.microsoft.com/en-us/research/blog/graphrag-unlocking-llm-discovery-on-narrative-private-data/
Slack (or Teams) Automation for Bonterra Impact Management (fka Social Soluti...Jeffrey Haguewood
Sidekick Solutions uses Bonterra Impact Management (fka Social Solutions Apricot) and automation solutions to integrate data for business workflows.
We believe integration and automation are essential to user experience and the promise of efficient work through technology. Automation is the critical ingredient to realizing that full vision. We develop integration products and services for Bonterra Case Management software to support the deployment of automations for a variety of use cases.
This video focuses on the notifications, alerts, and approval requests using Slack for Bonterra Impact Management. The solutions covered in this webinar can also be deployed for Microsoft Teams.
Interested in deploying notification automations for Bonterra Impact Management? Contact us at sales@sidekicksolutionsllc.com to discuss next steps.
Neuro-symbolic is not enough, we need neuro-*semantic*Frank van Harmelen
Neuro-symbolic (NeSy) AI is on the rise. However, simply machine learning on just any symbolic structure is not sufficient to really harvest the gains of NeSy. These will only be gained when the symbolic structures have an actual semantics. I give an operational definition of semantics as “predictable inference”.
All of this illustrated with link prediction over knowledge graphs, but the argument is general.
DevOps and Testing slides at DASA ConnectKari Kakkonen
My and Rik Marselis slides at 30.5.2024 DASA Connect conference. We discuss about what is testing, then what is agile testing and finally what is Testing in DevOps. Finally we had lovely workshop with the participants trying to find out different ways to think about quality and testing in different parts of the DevOps infinity loop.
JMeter webinar - integration with InfluxDB and GrafanaRTTS
Watch this recorded webinar about real-time monitoring of application performance. See how to integrate Apache JMeter, the open-source leader in performance testing, with InfluxDB, the open-source time-series database, and Grafana, the open-source analytics and visualization application.
In this webinar, we will review the benefits of leveraging InfluxDB and Grafana when executing load tests and demonstrate how these tools are used to visualize performance metrics.
Length: 30 minutes
Session Overview
-------------------------------------------
During this webinar, we will cover the following topics while demonstrating the integrations of JMeter, InfluxDB and Grafana:
- What out-of-the-box solutions are available for real-time monitoring JMeter tests?
- What are the benefits of integrating InfluxDB and Grafana into the load testing stack?
- Which features are provided by Grafana?
- Demonstration of InfluxDB and Grafana using a practice web application
To view the webinar recording, go to:
https://www.rttsweb.com/jmeter-integration-webinar
Encryption in Microsoft 365 - ExpertsLive Netherlands 2024Albert Hoitingh
In this session I delve into the encryption technology used in Microsoft 365 and Microsoft Purview. Including the concepts of Customer Key and Double Key Encryption.
2. DEFINITION
• Identifying and recognizing objects in the aerial
photograph and then judging their significance in the
photograph.
• Oblique photographs are normally easy to interpret.
3. Factors to assess to identify a feature :
Shape
Theform of an object on an air photohelps to identify theobject. Regularuniform shapes often indicate a
human involvement.
Size
A measure of theobject's surface area (e.g. single-lane vs. multi-lane highways).
Tone/Colour
The colourcharacteristics of an object, relative tootherobjects in the photo, are used toidentify the feature
(e.g. sand has a bright tone, while waterusually has a dark tone; tree species can be determined by the colour
of their leaves at certain times of the year).
4.
5. Pattern
Similar to shape, the spatial arrangement of objects (e.g. row crops vs. pasture) is also useful to identify an
object and its
Shadow
A shadow provides information about the object's height, shape, and orientation (e.g. tree species).
Texture
Texture is the frequency of the change in tone in the photographicimage. As the photoscale is
reduced, the texture of the given object becomes progressivelyfinerand eventually dissapears.
6. Association/Site
Associating the presence of one object with another,or relatingit to its environment,can help
identify the object (e.g. industrial buildings often have accessto railwaysidings; nuclear power
plantsare often locatedbeside large bodies of water).
7. Applications:
Agriculture
•crop type classification
•Crop condition classification
•Crop yieldestimation
•Mapping of soil characteristics
•Mapping of soil managementpractices
Forestry
•Forestcover
•Type of forest
•Vegetation density
•Deforestation
•Forest fires