Downloaded 582 times


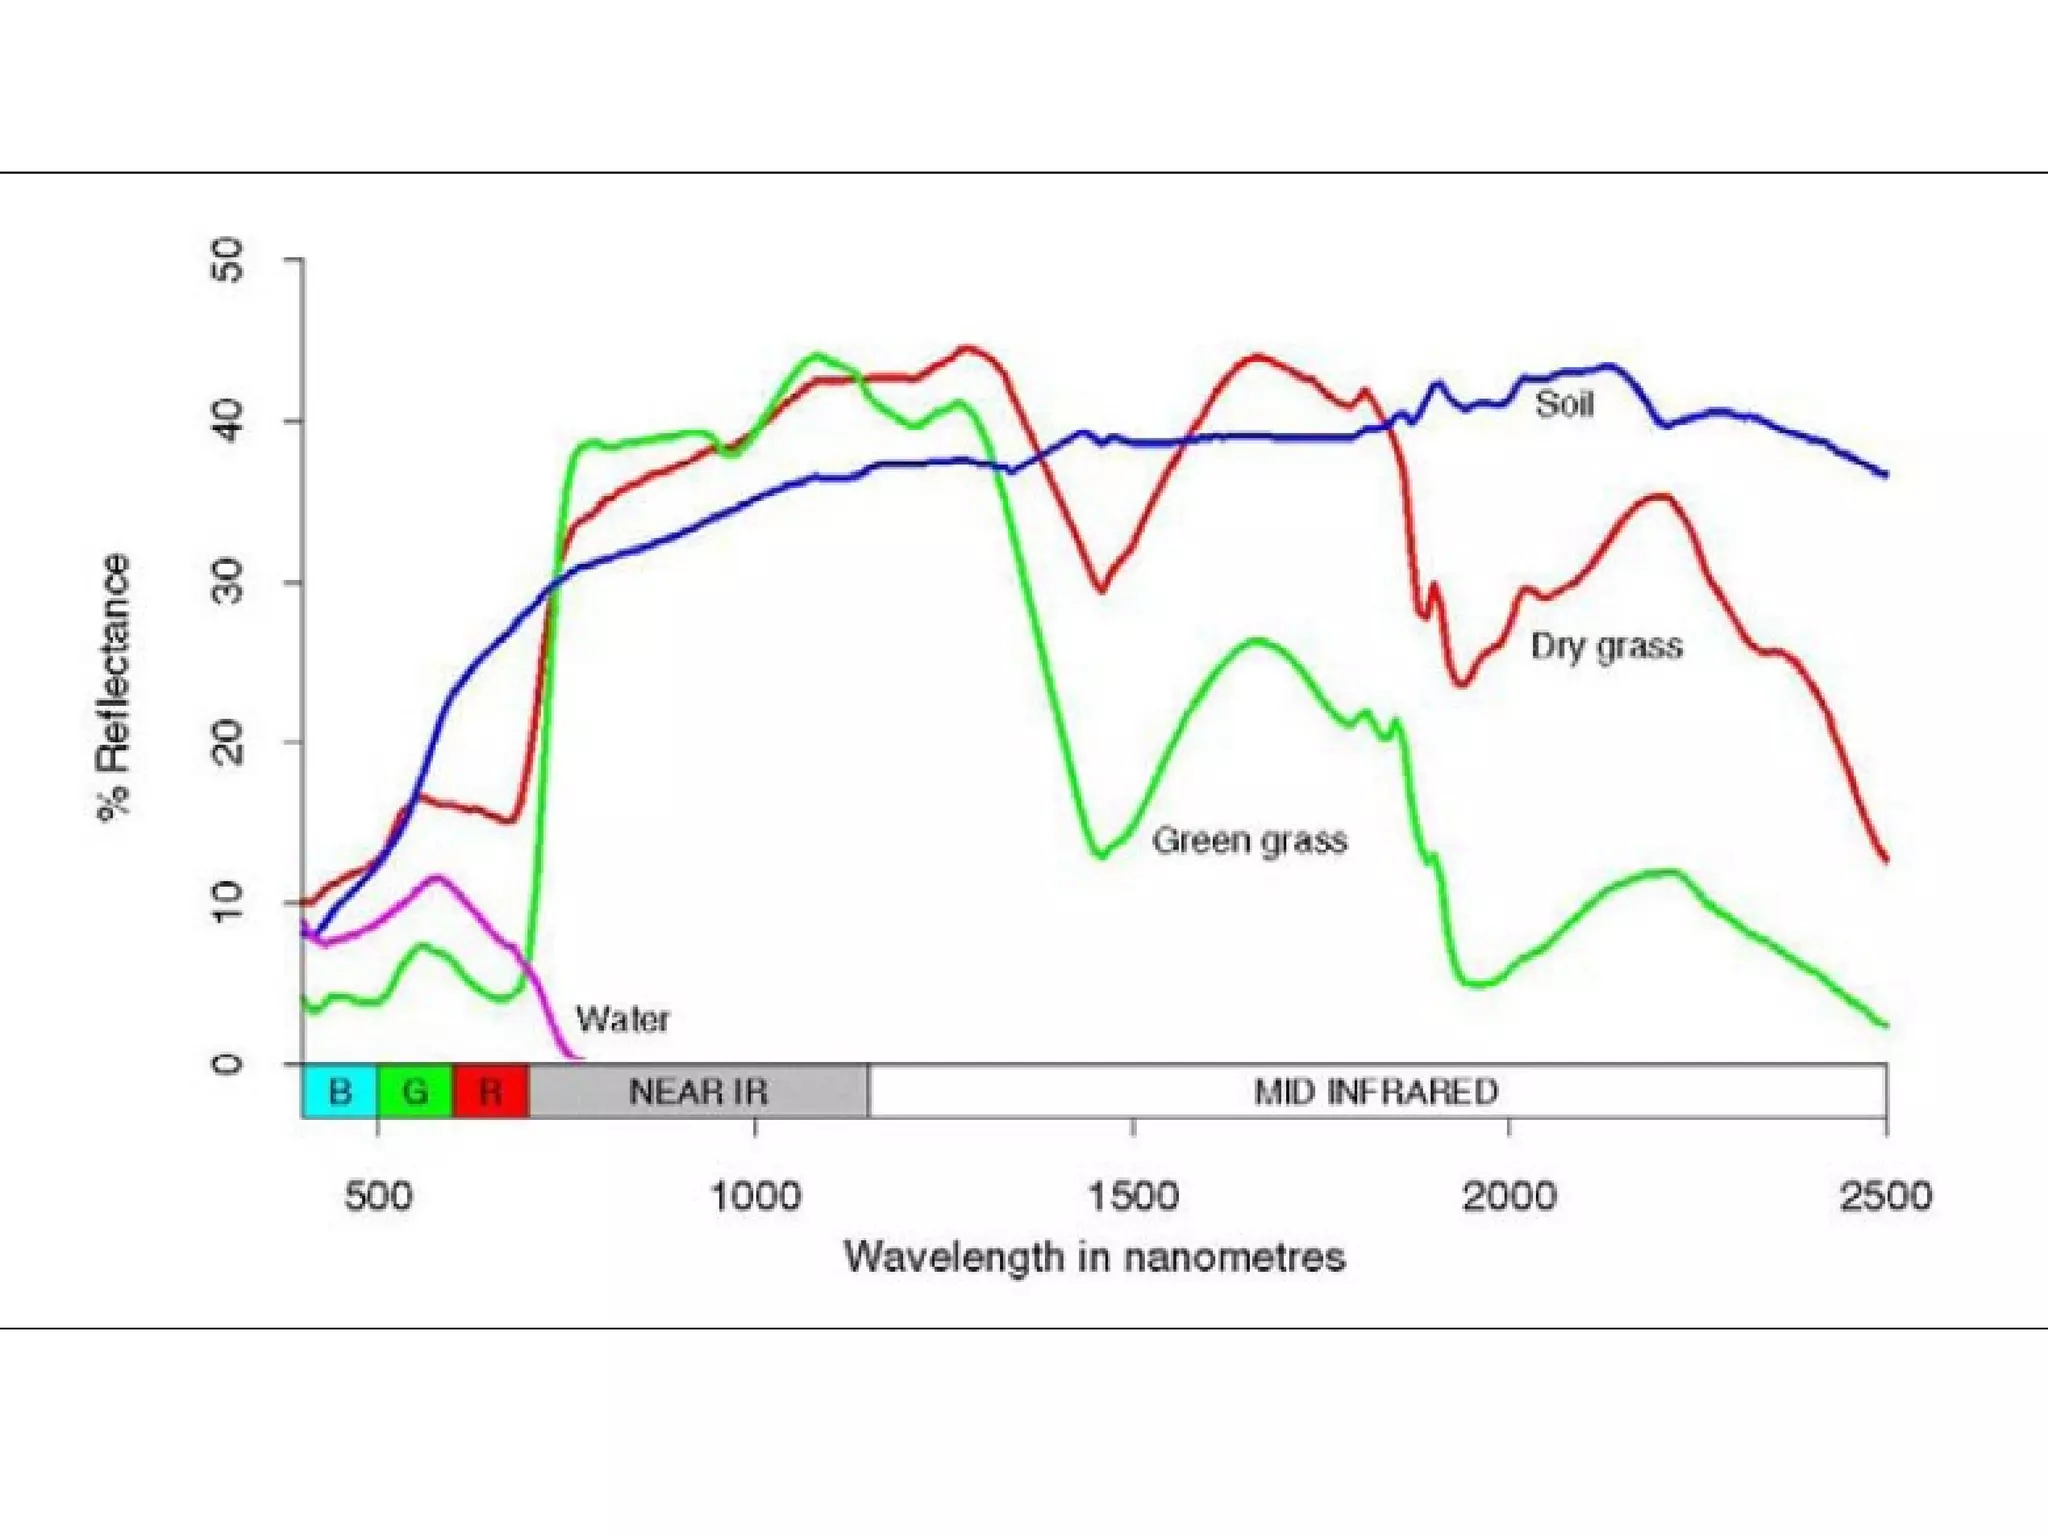
![Rayleigh Scattering:
In Rayleigh scattering the volume scattering coefficient σλ is given by :
σλ
[4π
=
2
NV
λ
4
2
] ⋅ [µ
2
[µ
2
]
]
− µ0
2 2
+ µ0
2 2
=
const
λ
4
N= no. of particles/cm2
…. V= vol. of scattering particles
λ = wavelength of radiation … µ= refractive index of the particles
µ0= refractive index of the medium
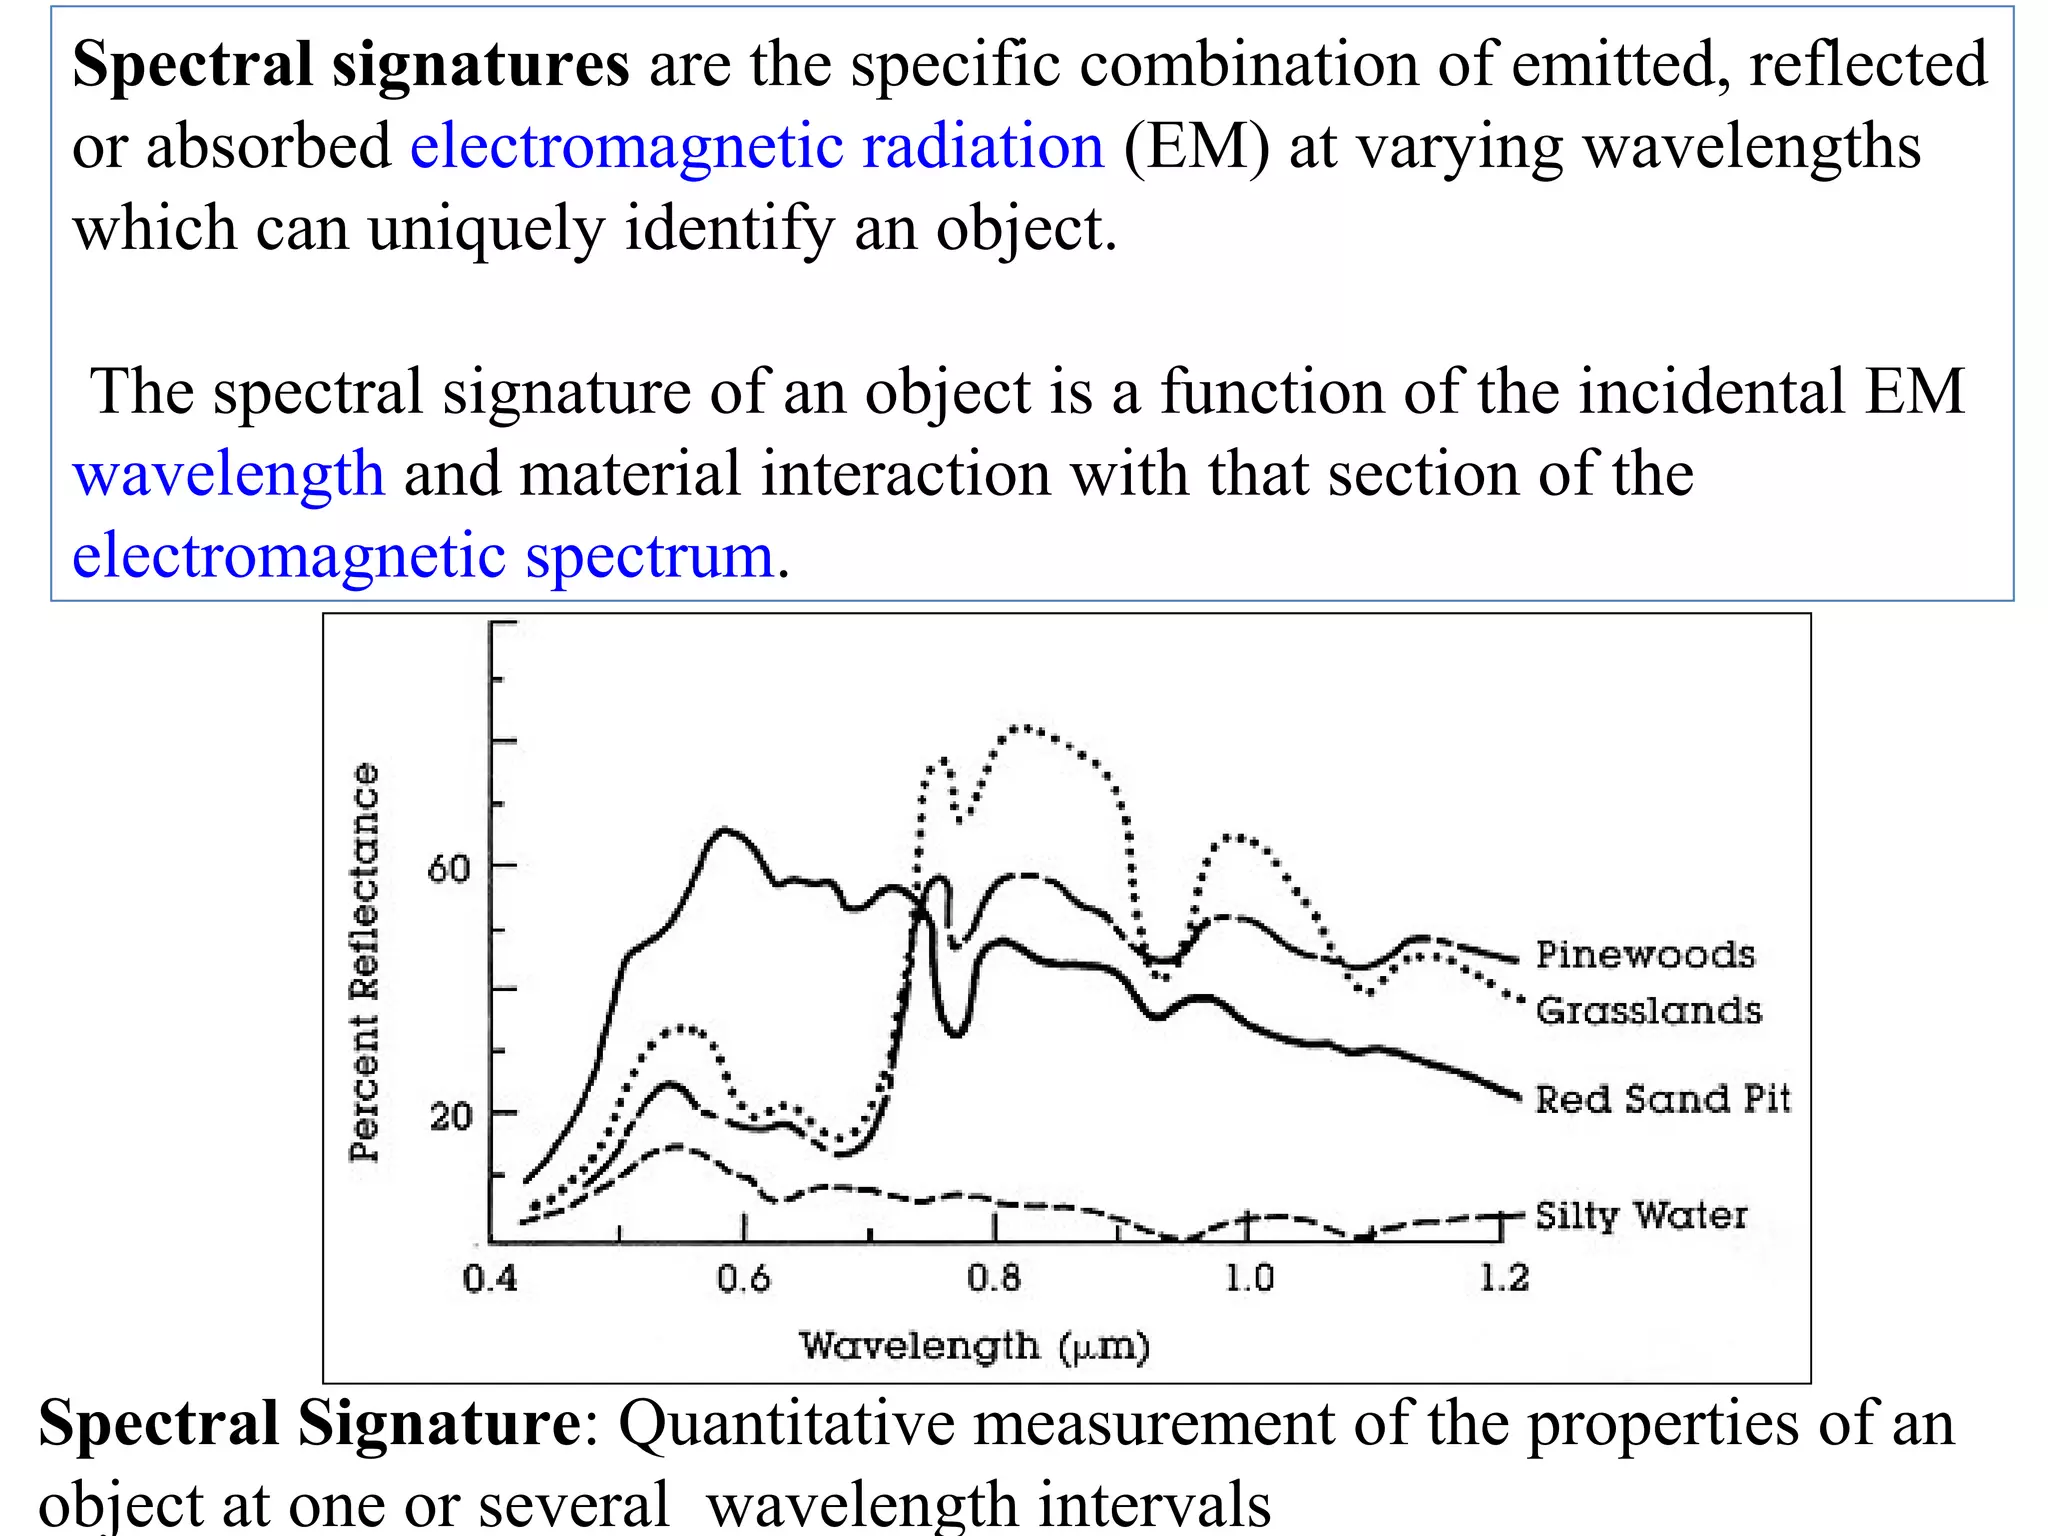
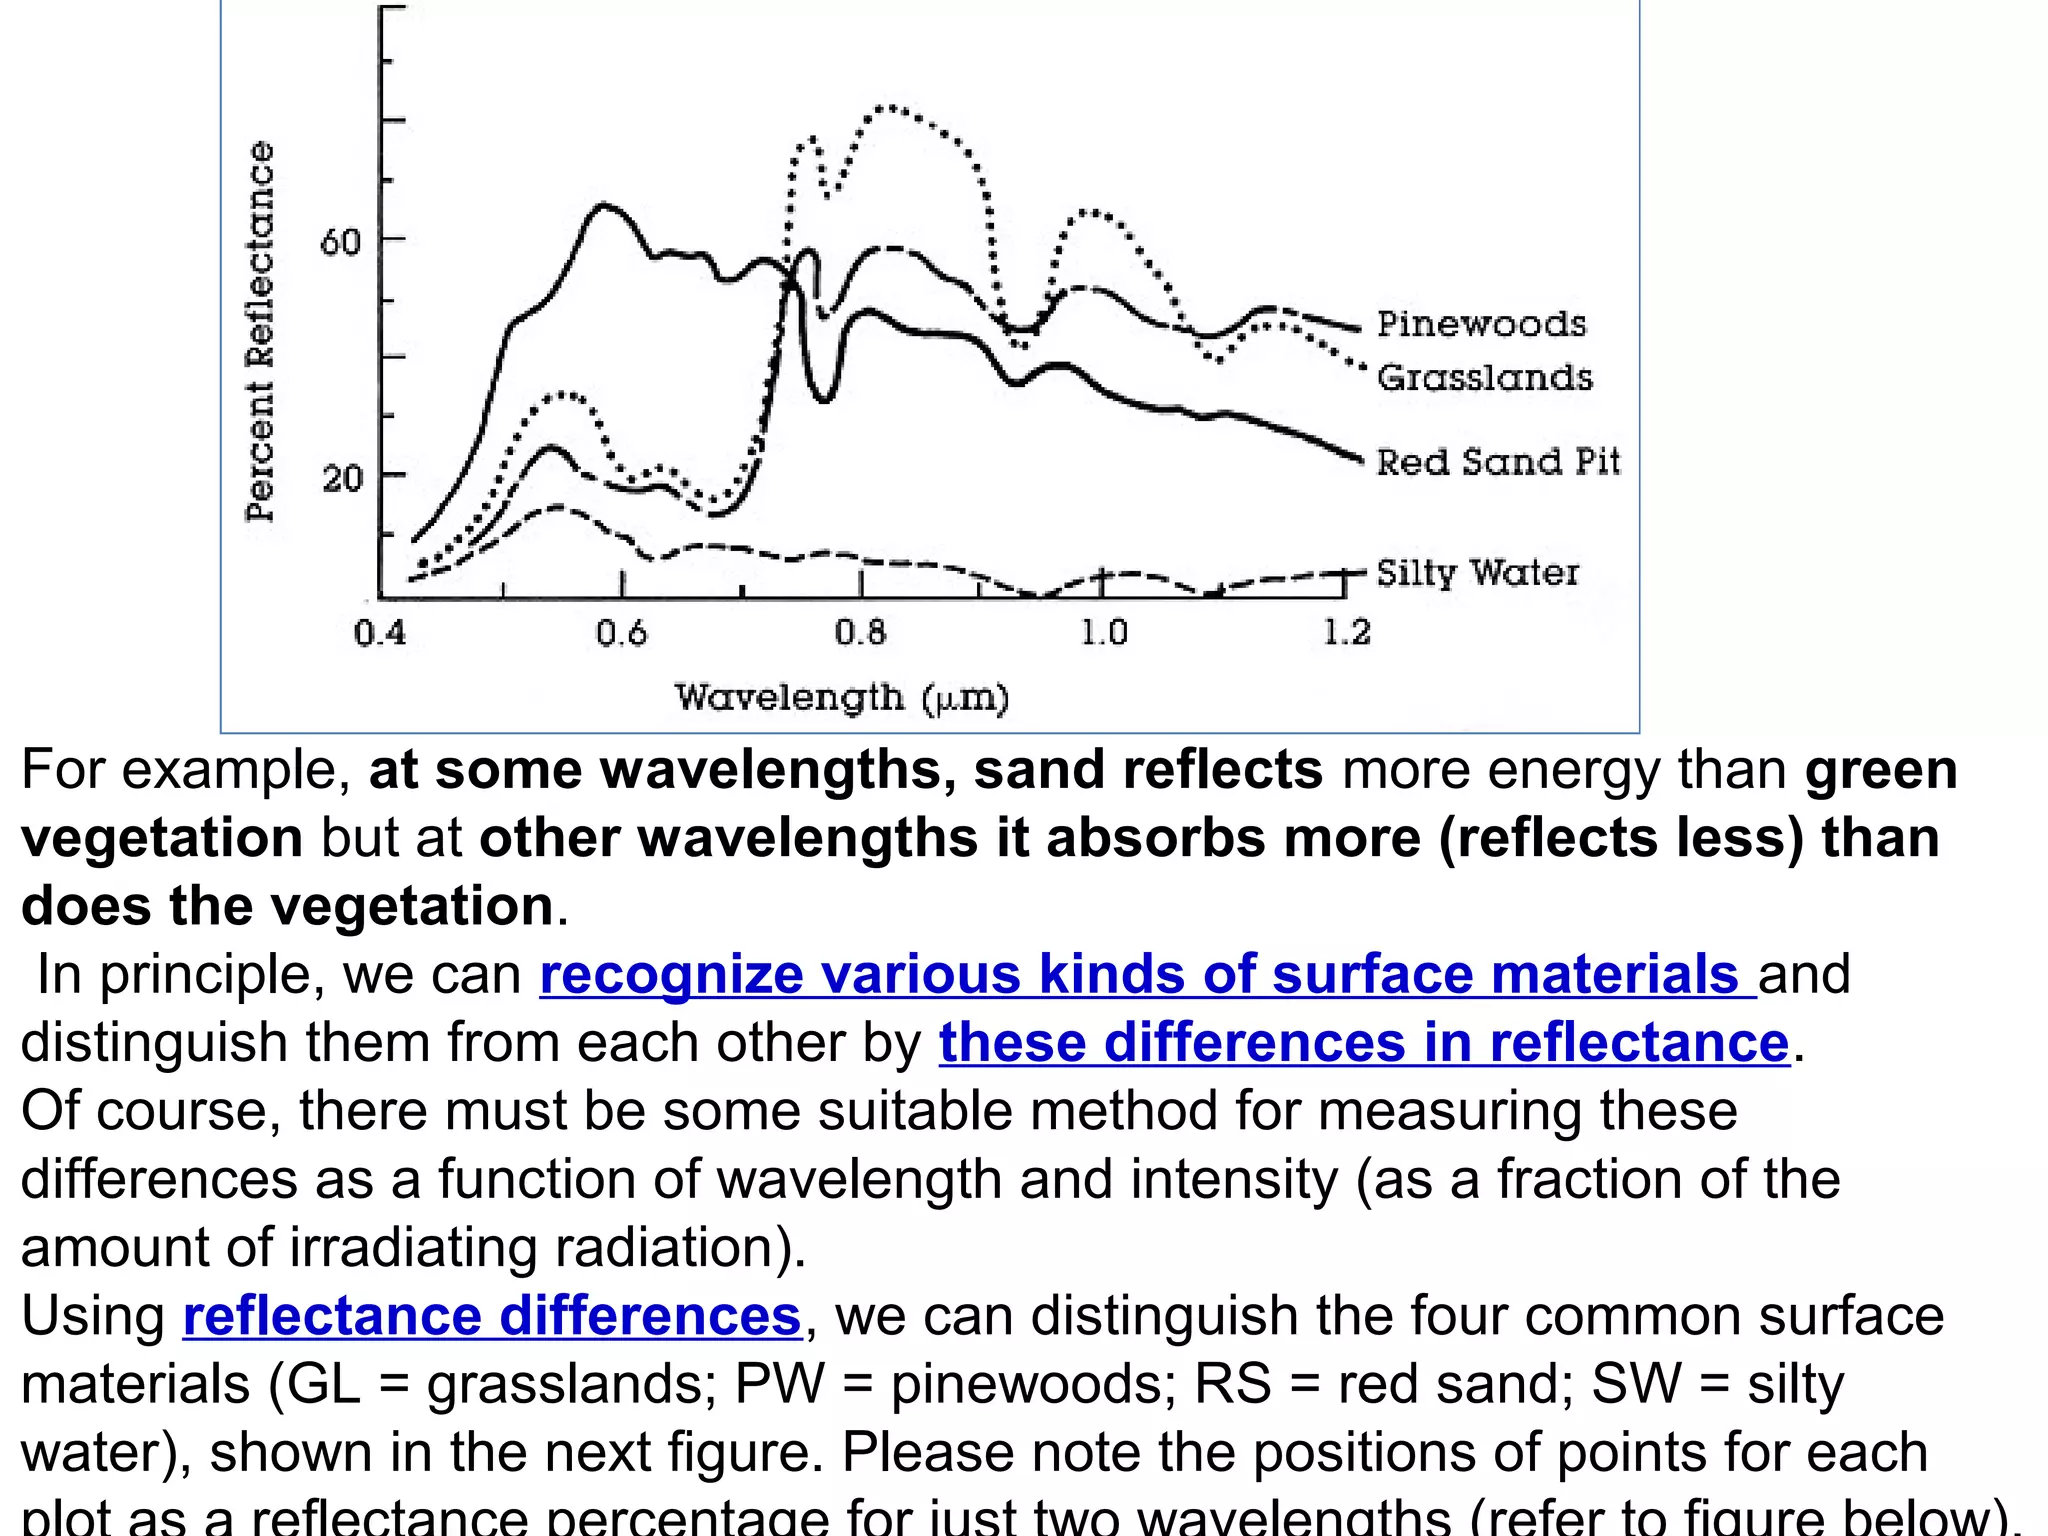
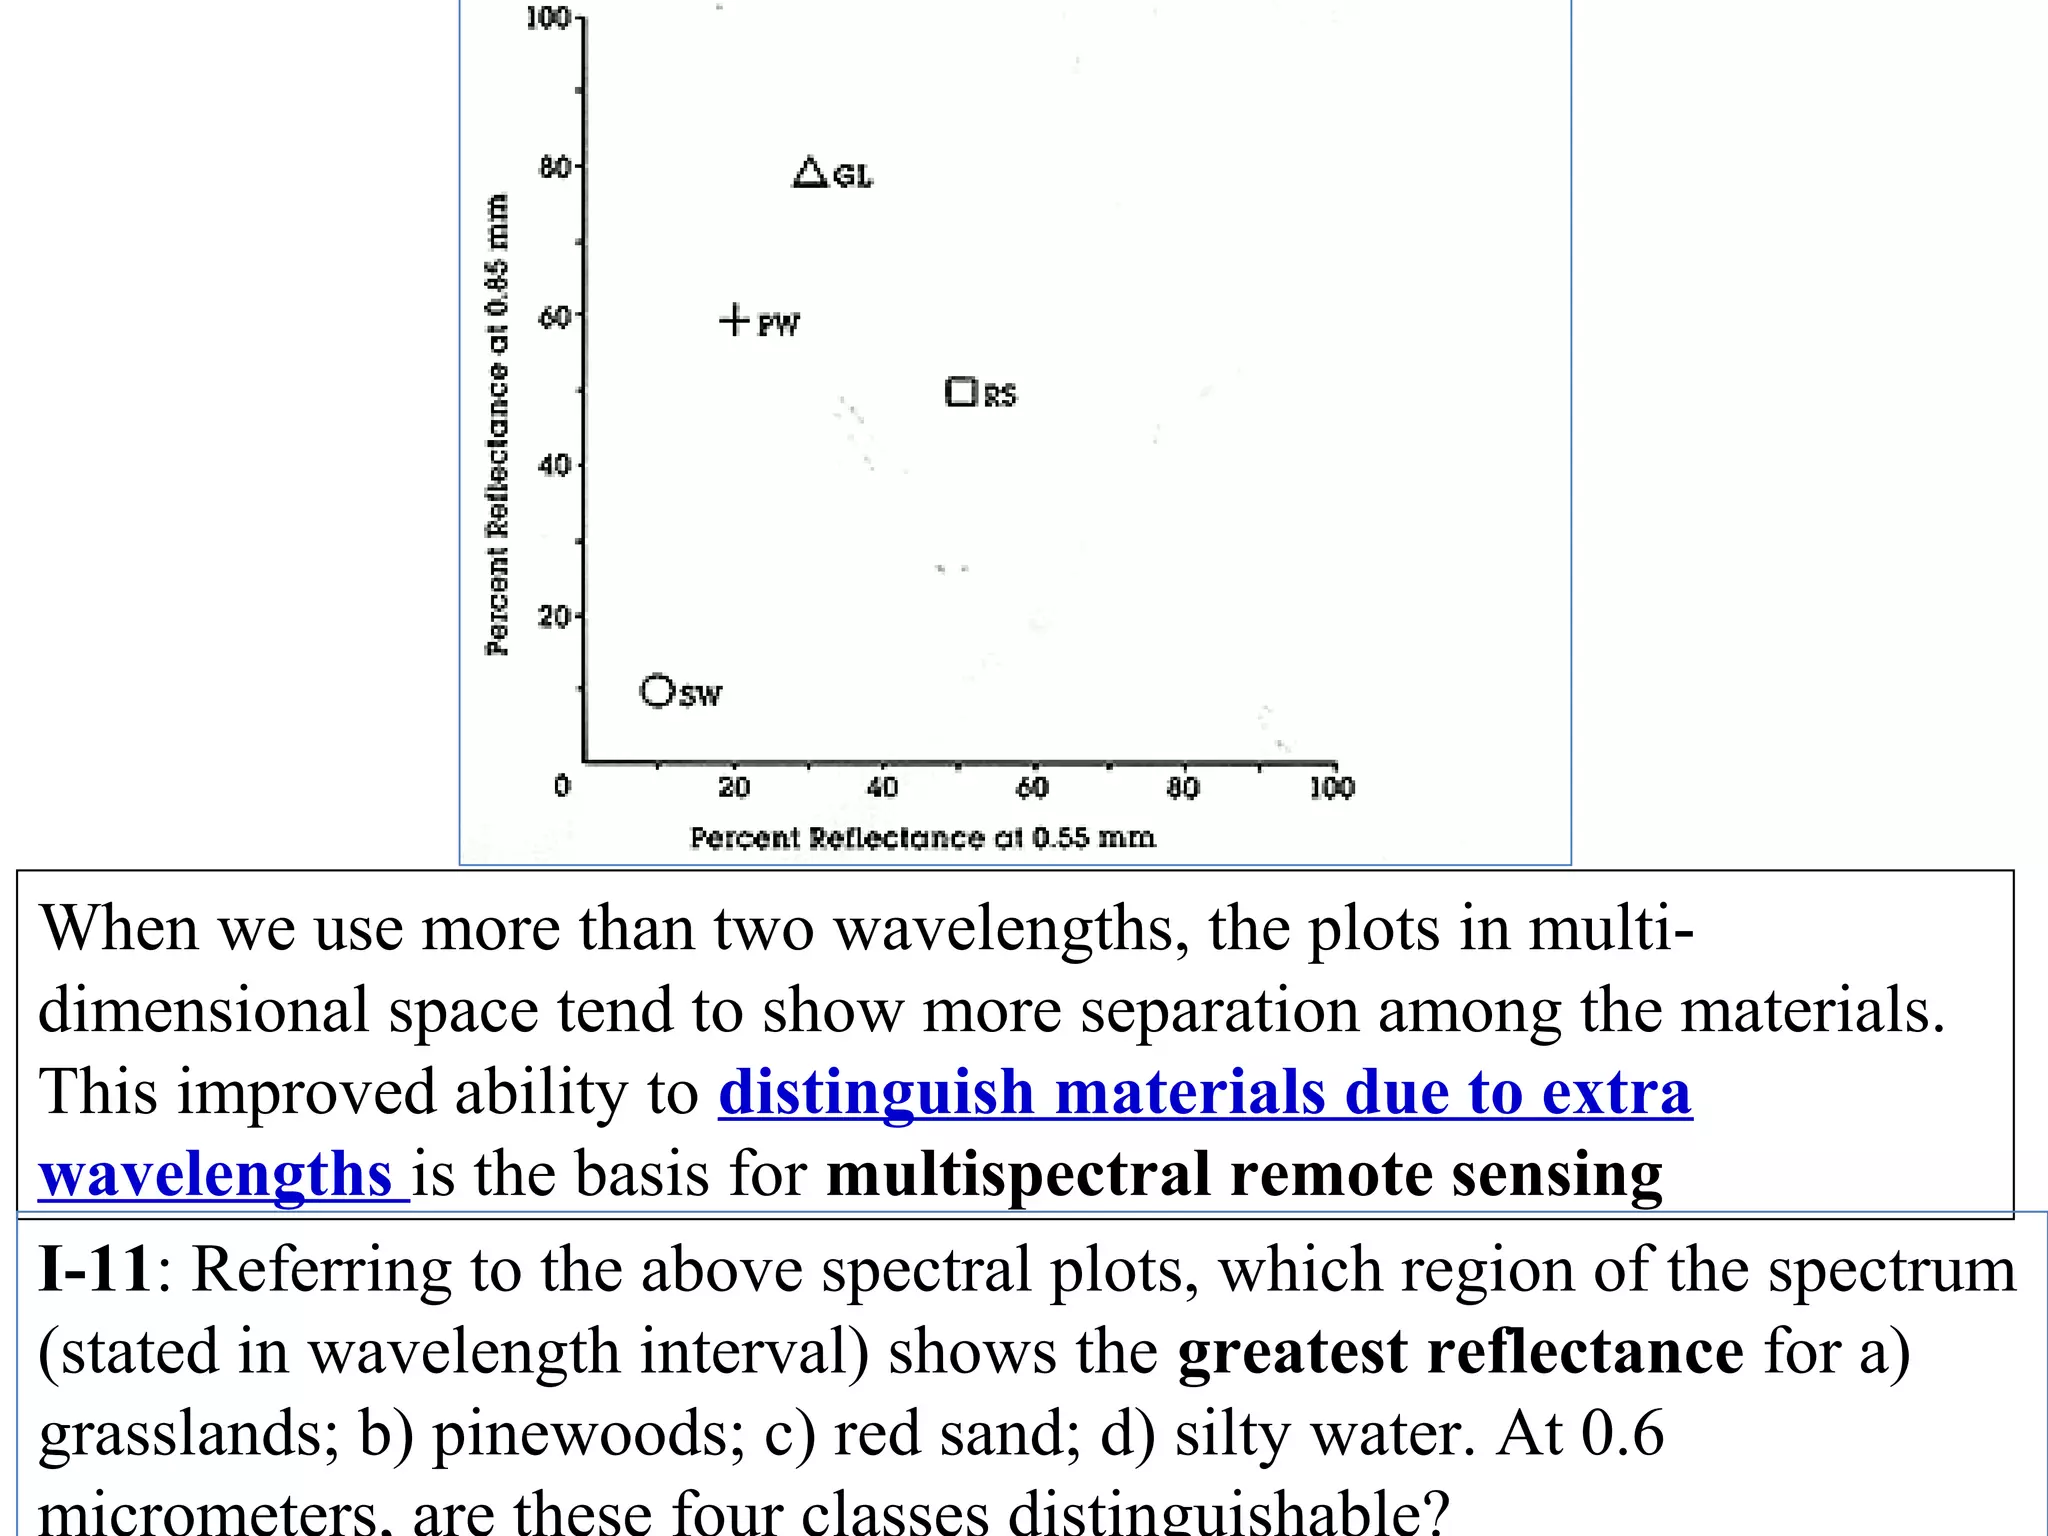
Because of Rayleigh scattering Multispectral remote sensing data
from the blue portion of the spectrum is of relatively limited
usefulness. In case of aerial photography, special filters are used to
filter out the scattered blue radiation due to haze present in the
atmosphere.](https://image.slidesharecdn.com/raleighansmiescatteringinremotesensingpkmani-140117025050-phpapp01/75/Raleigh-and-Mie-scattering-in-remote-sensing-7-2048.jpg)
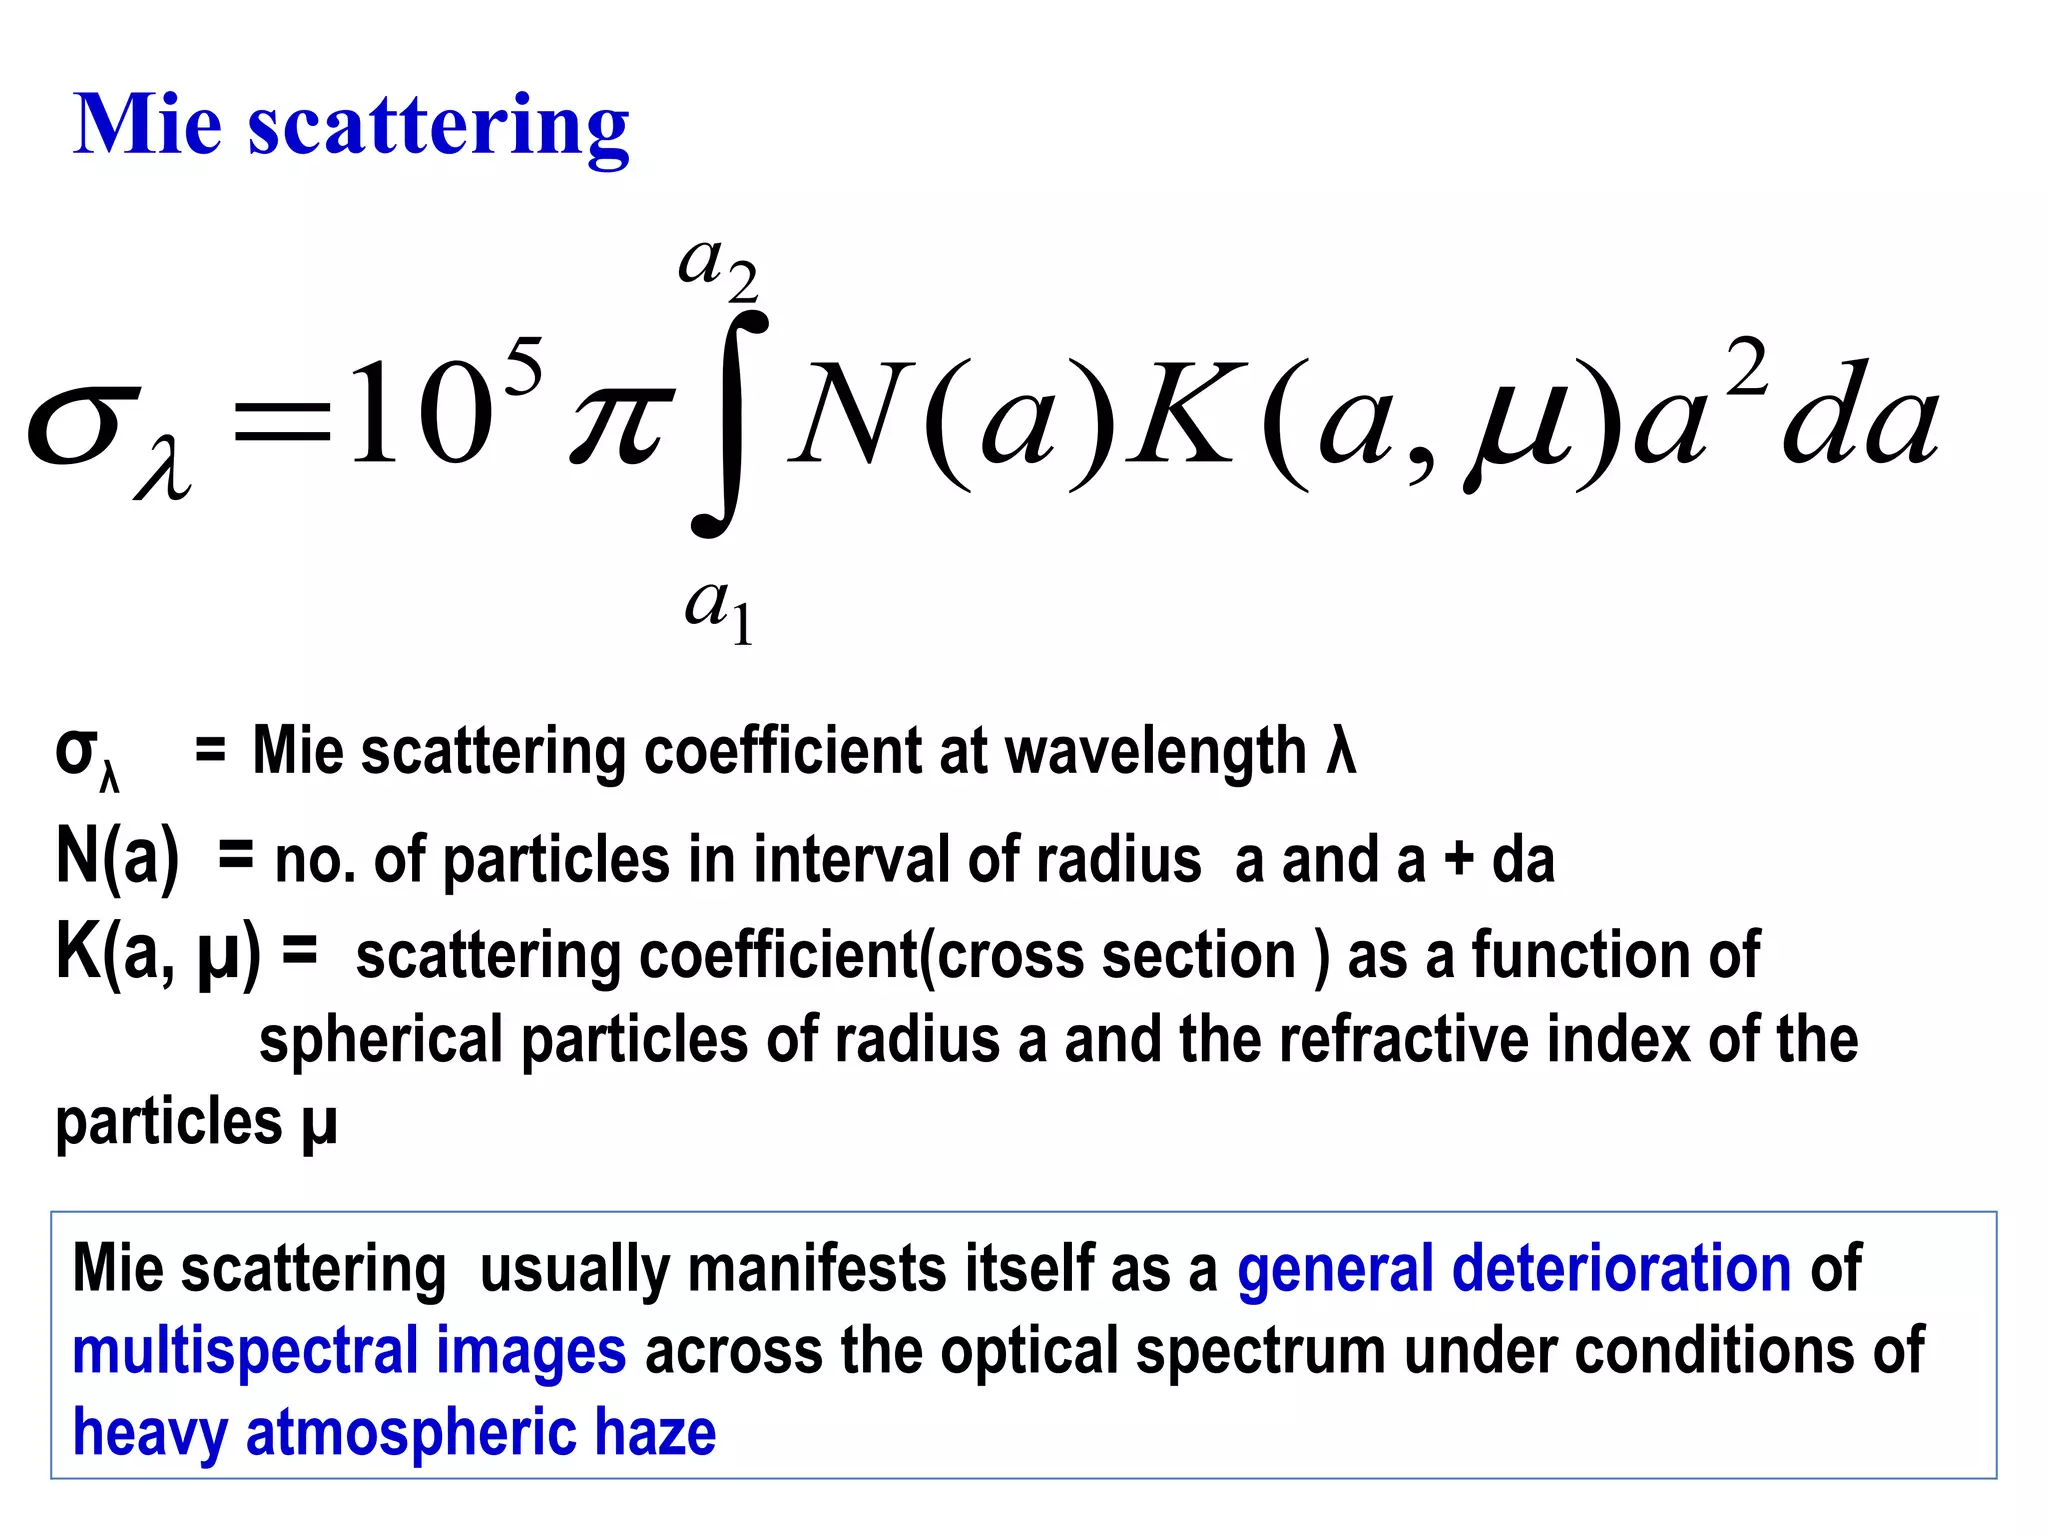


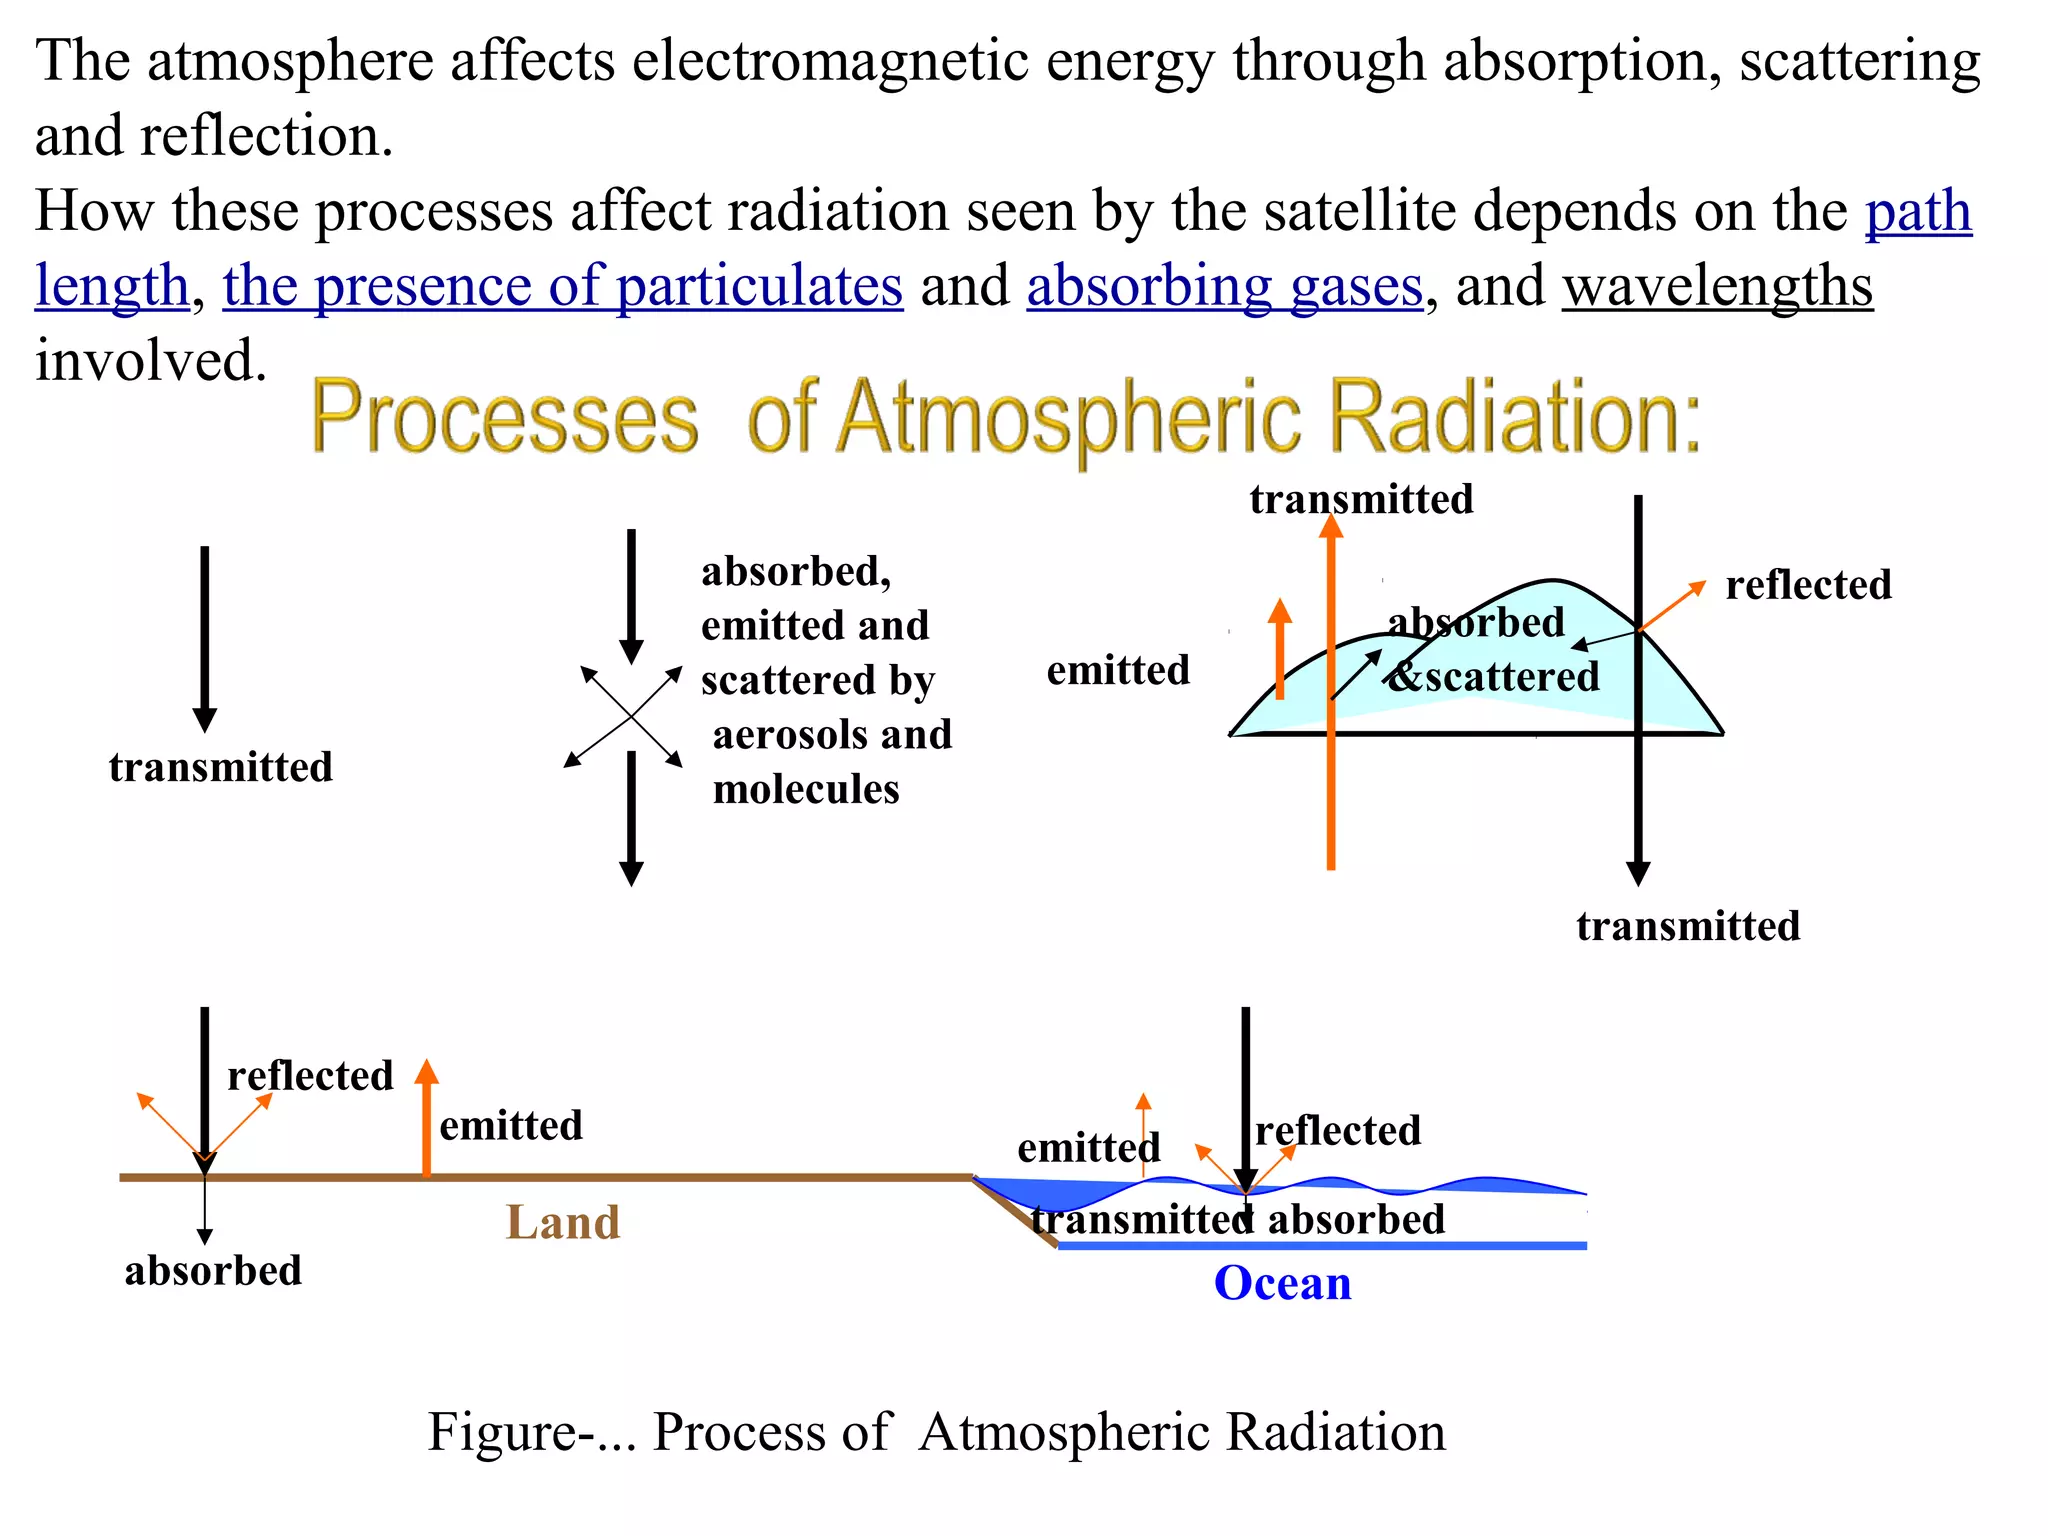
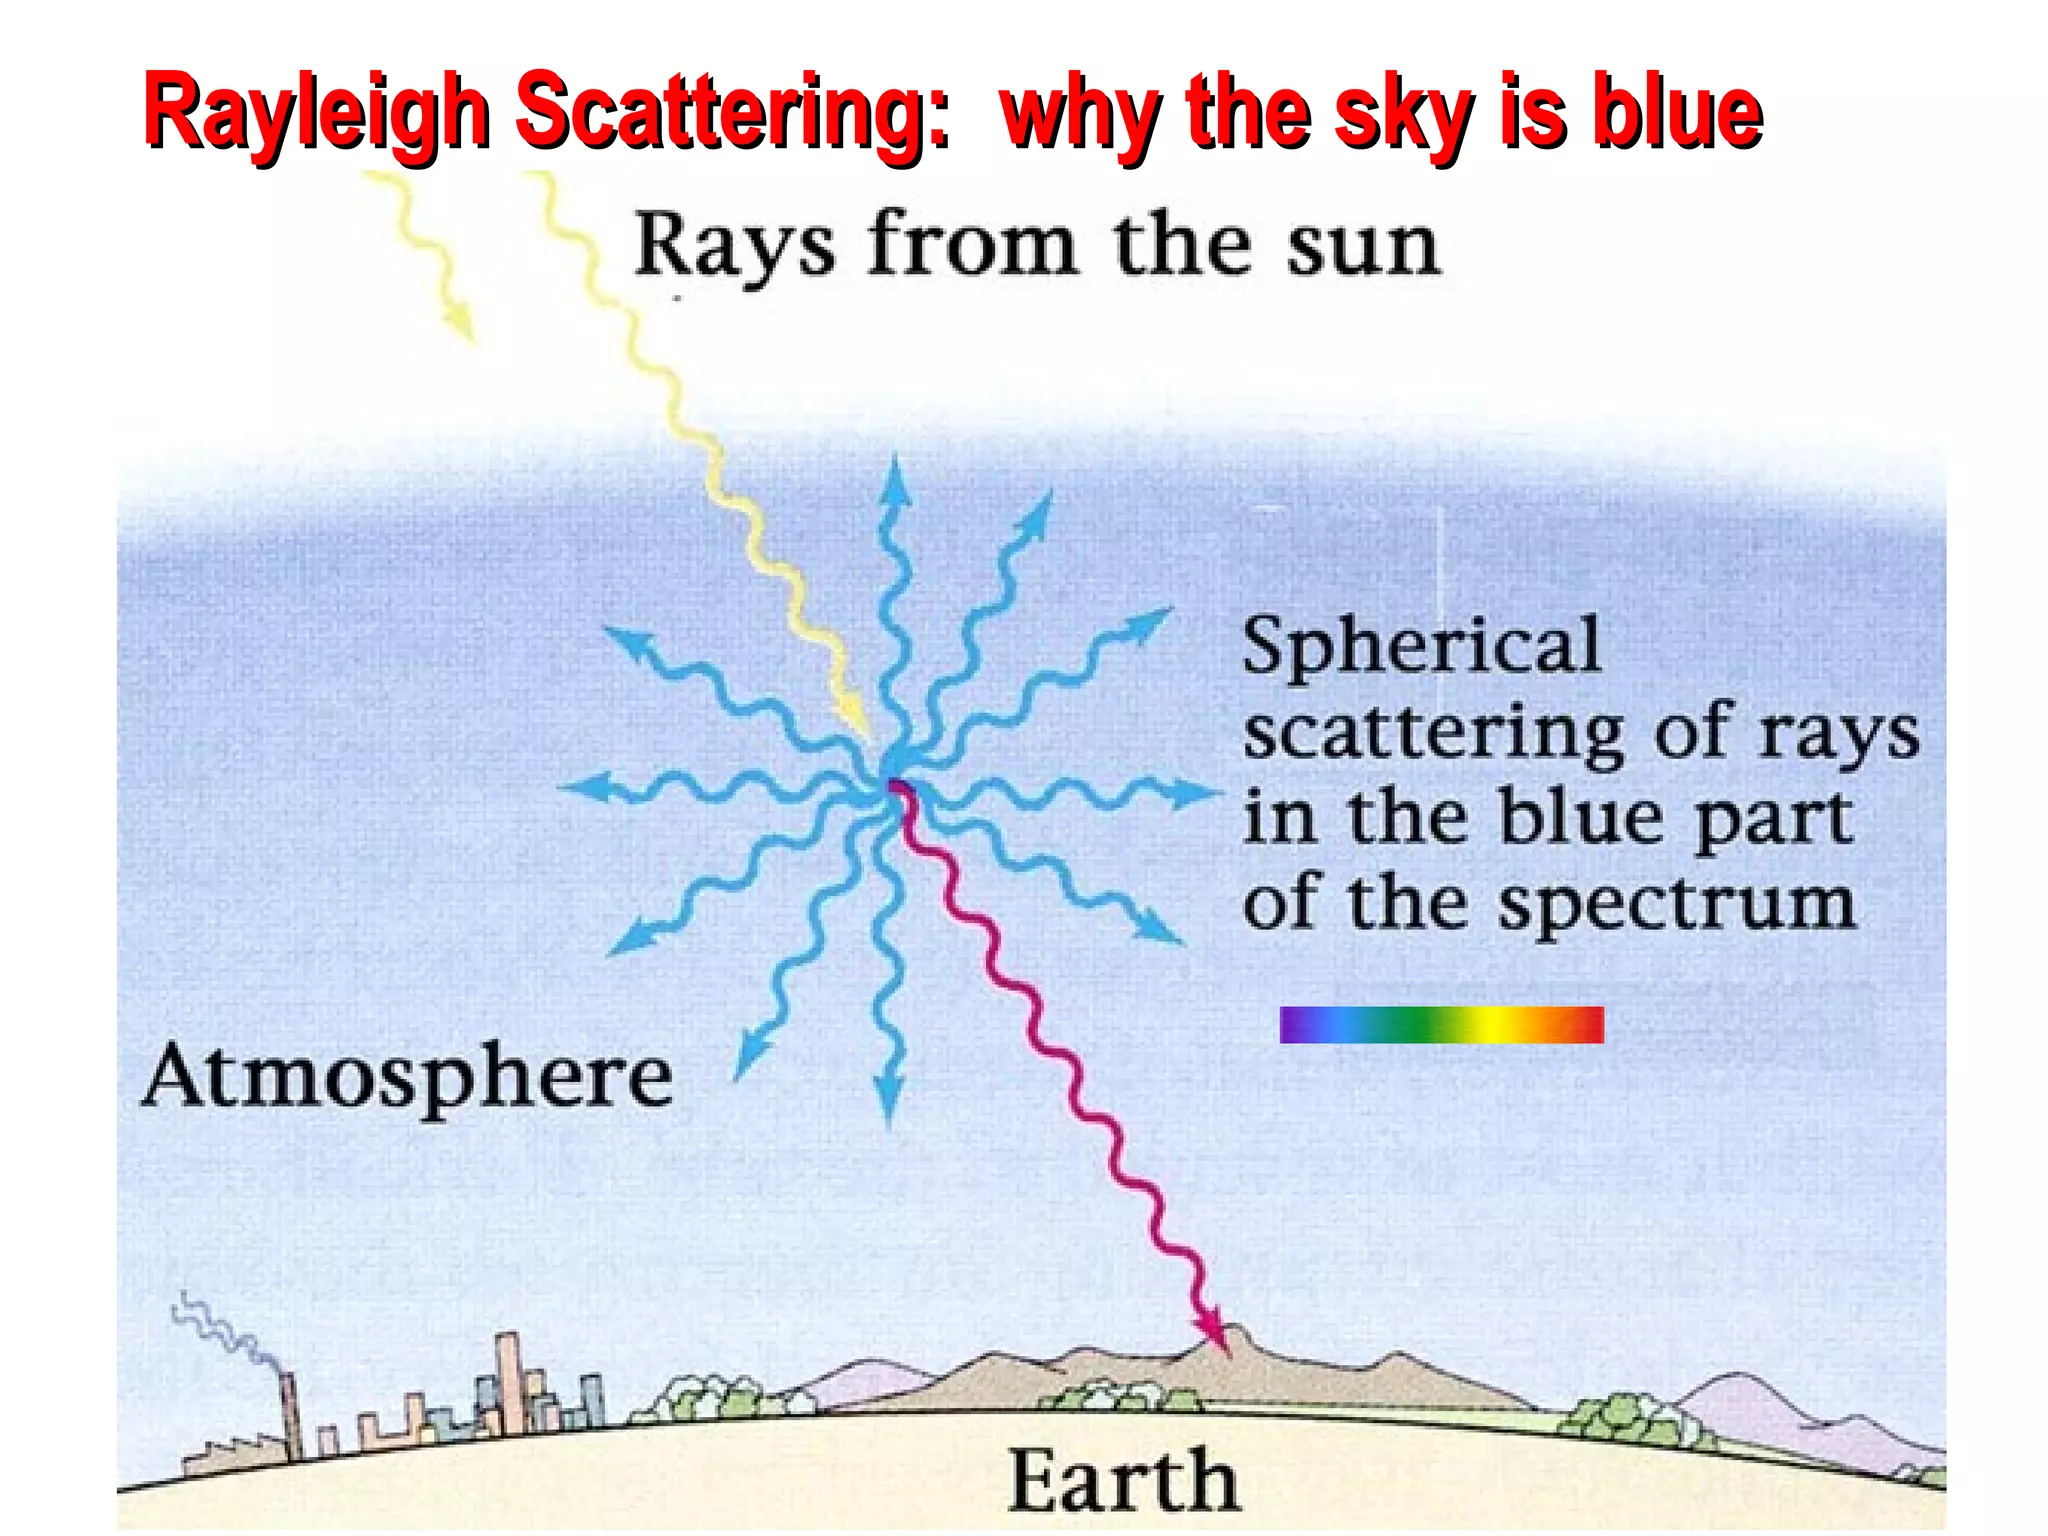
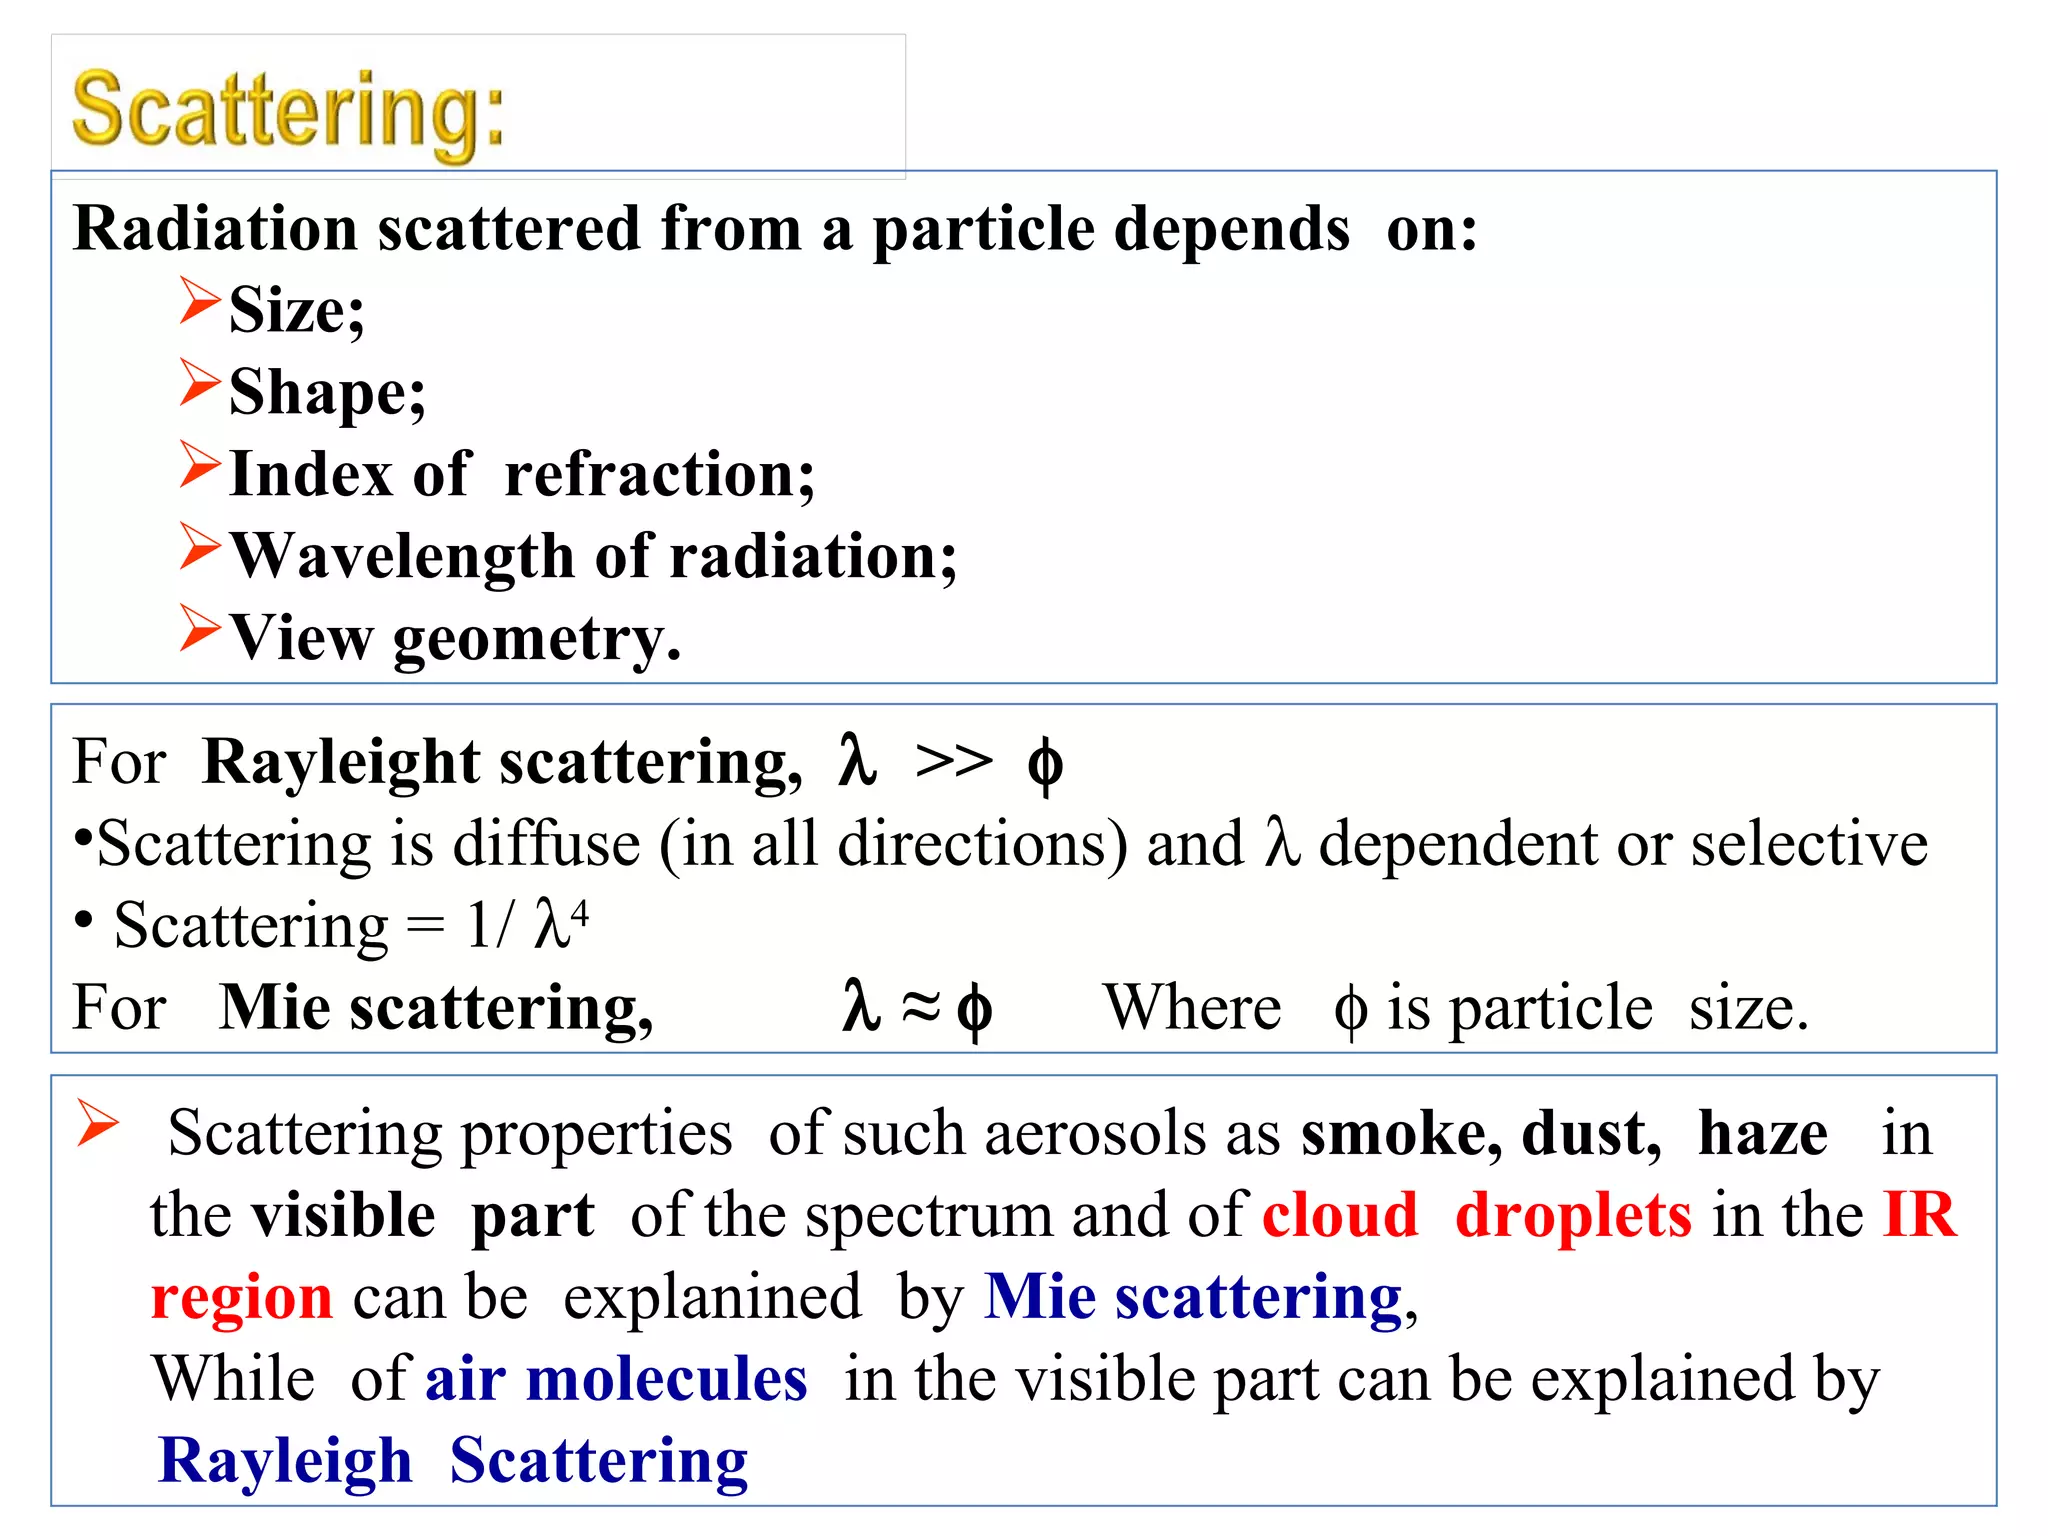
Rayleigh and Mie scattering are the dominant mechanisms by which sunlight is scattered in the atmosphere. Rayleigh scattering occurs when particles are much smaller than the wavelength of light and scatters light of short wavelengths more than long wavelengths, which is why the sky appears blue. Mie scattering occurs when particles are around the same size as the wavelength of light and results in scattering that is dependent on the size, shape, and composition of particles. Together these processes influence the light that reaches satellite sensors and enables remote sensing of the Earth.


