Downloaded 142 times
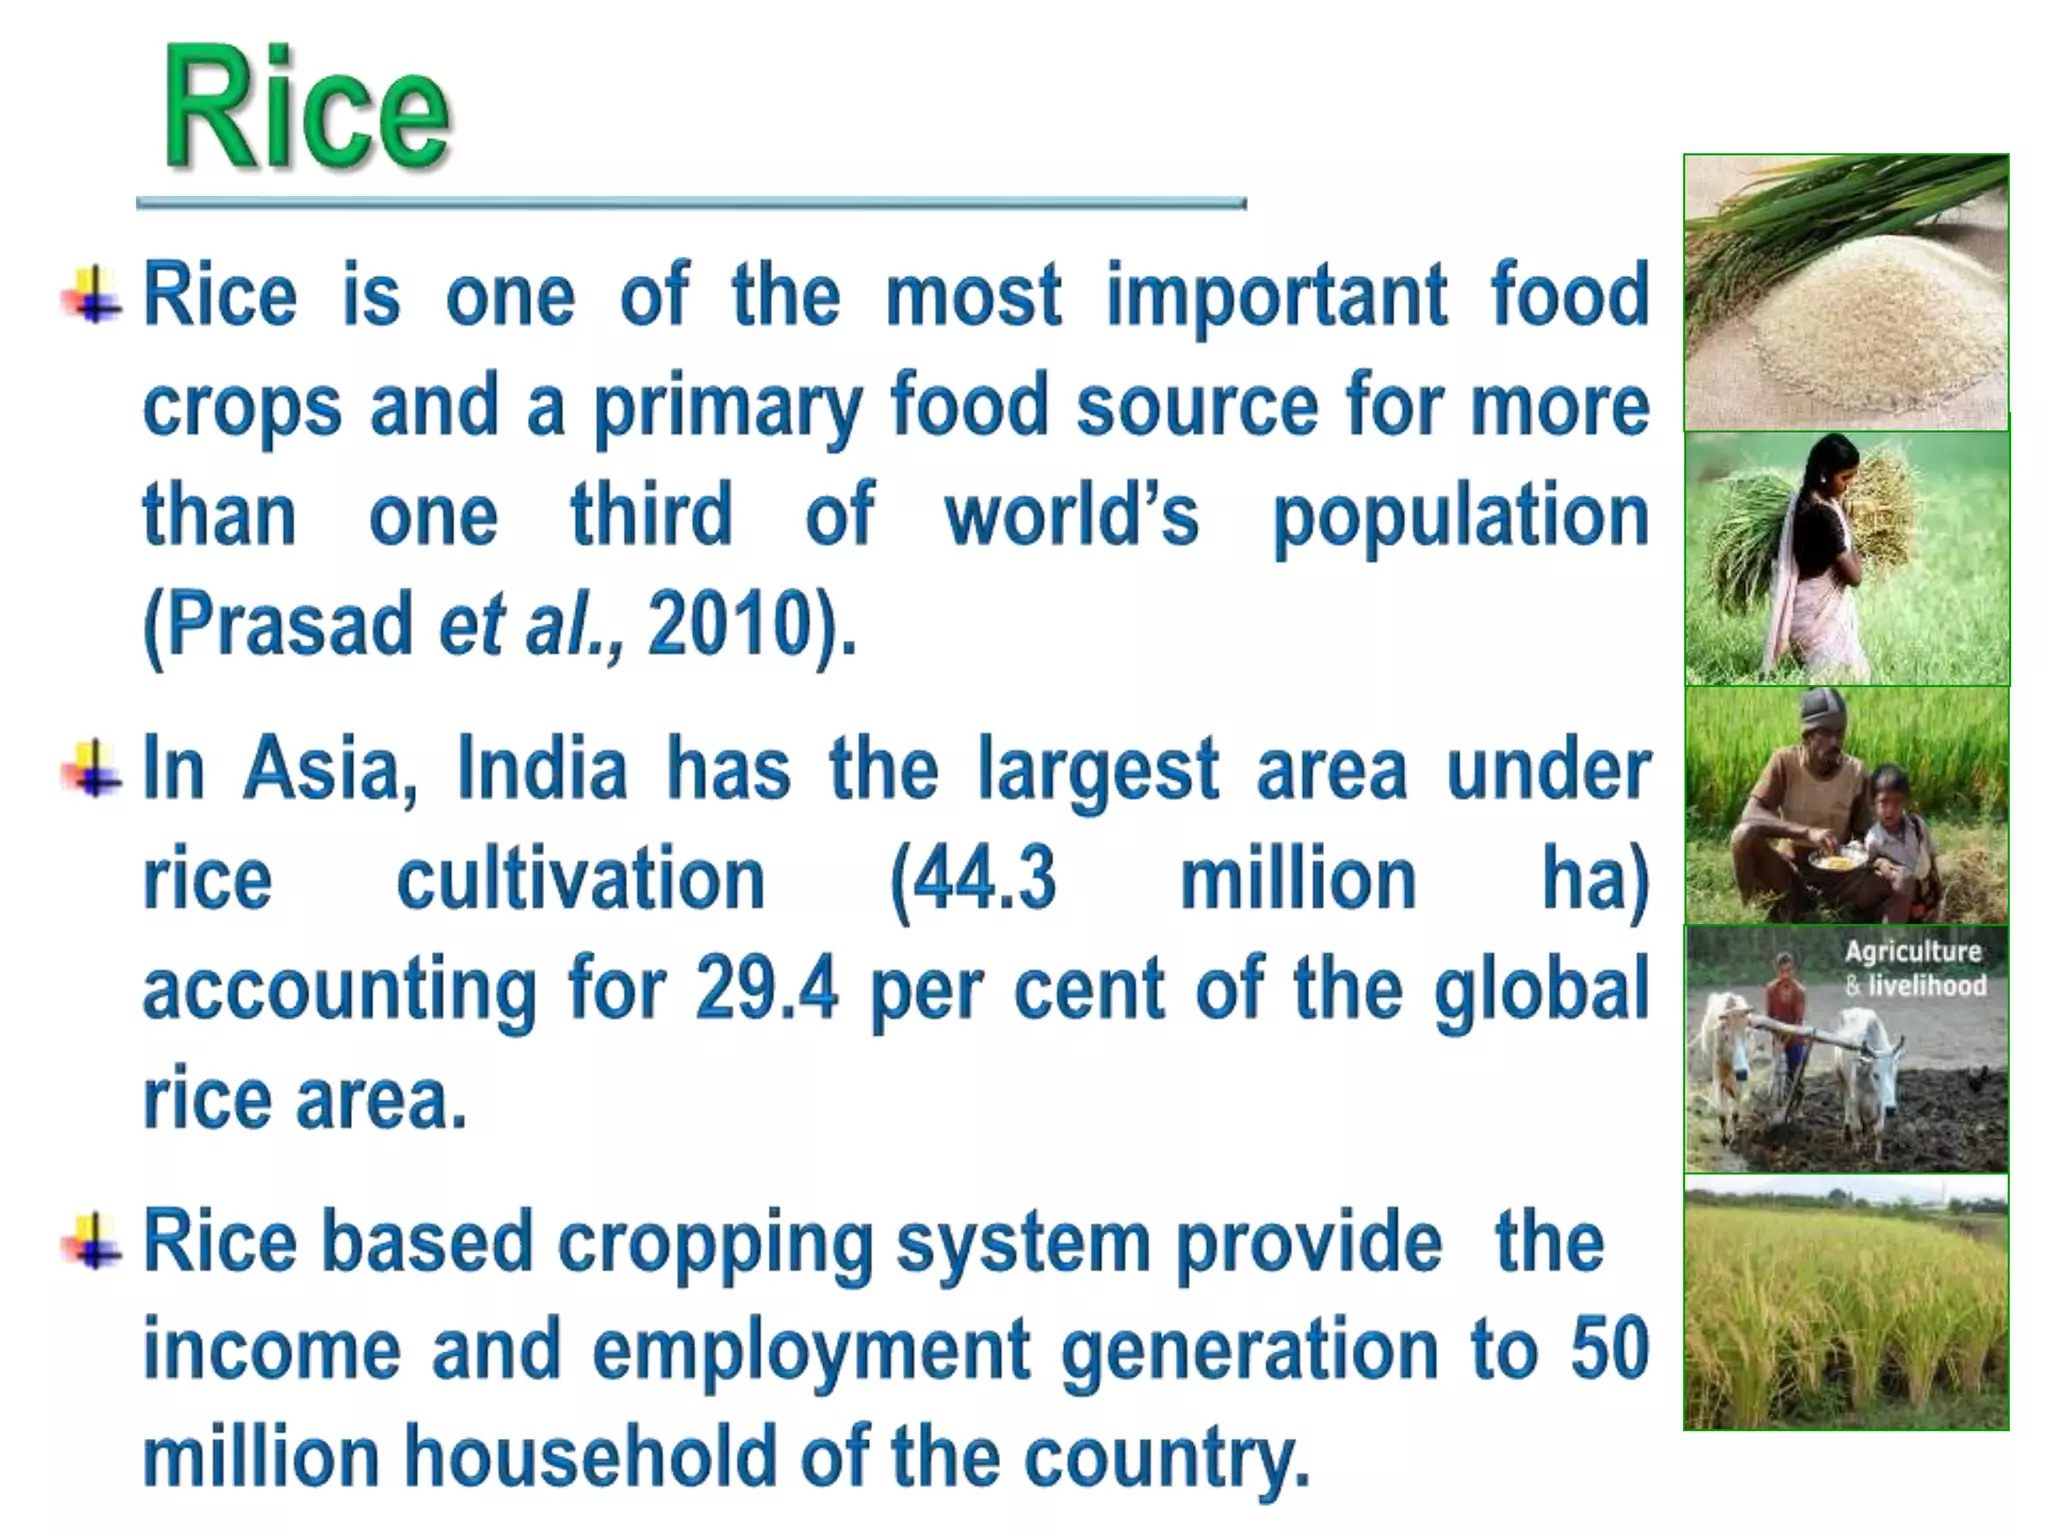
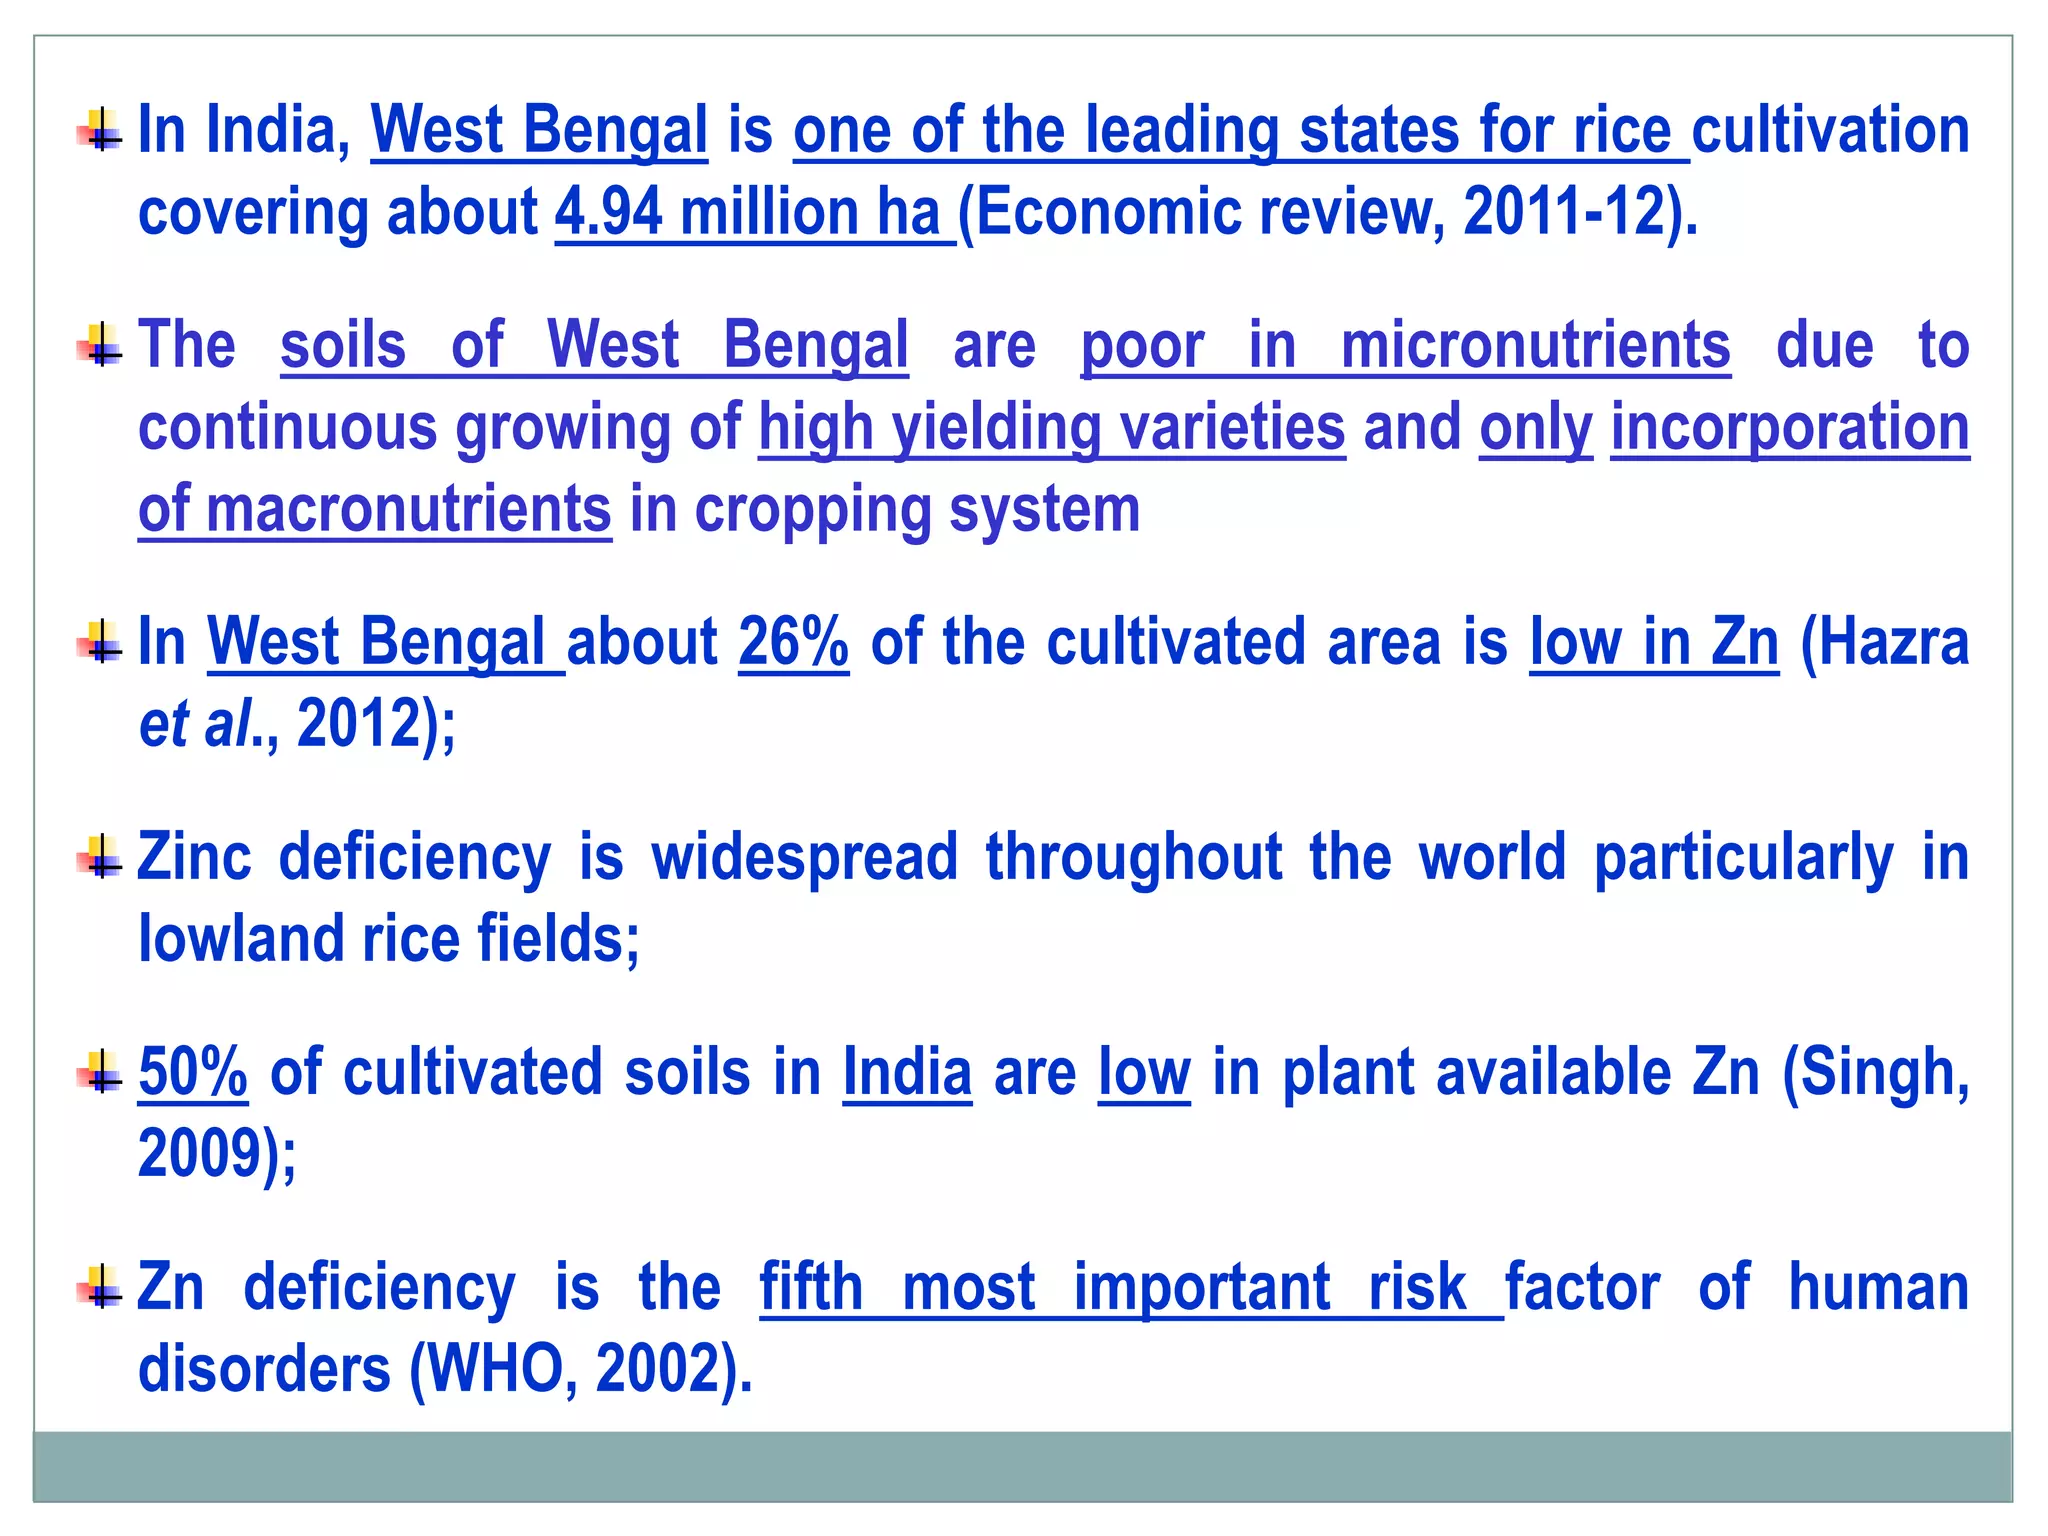
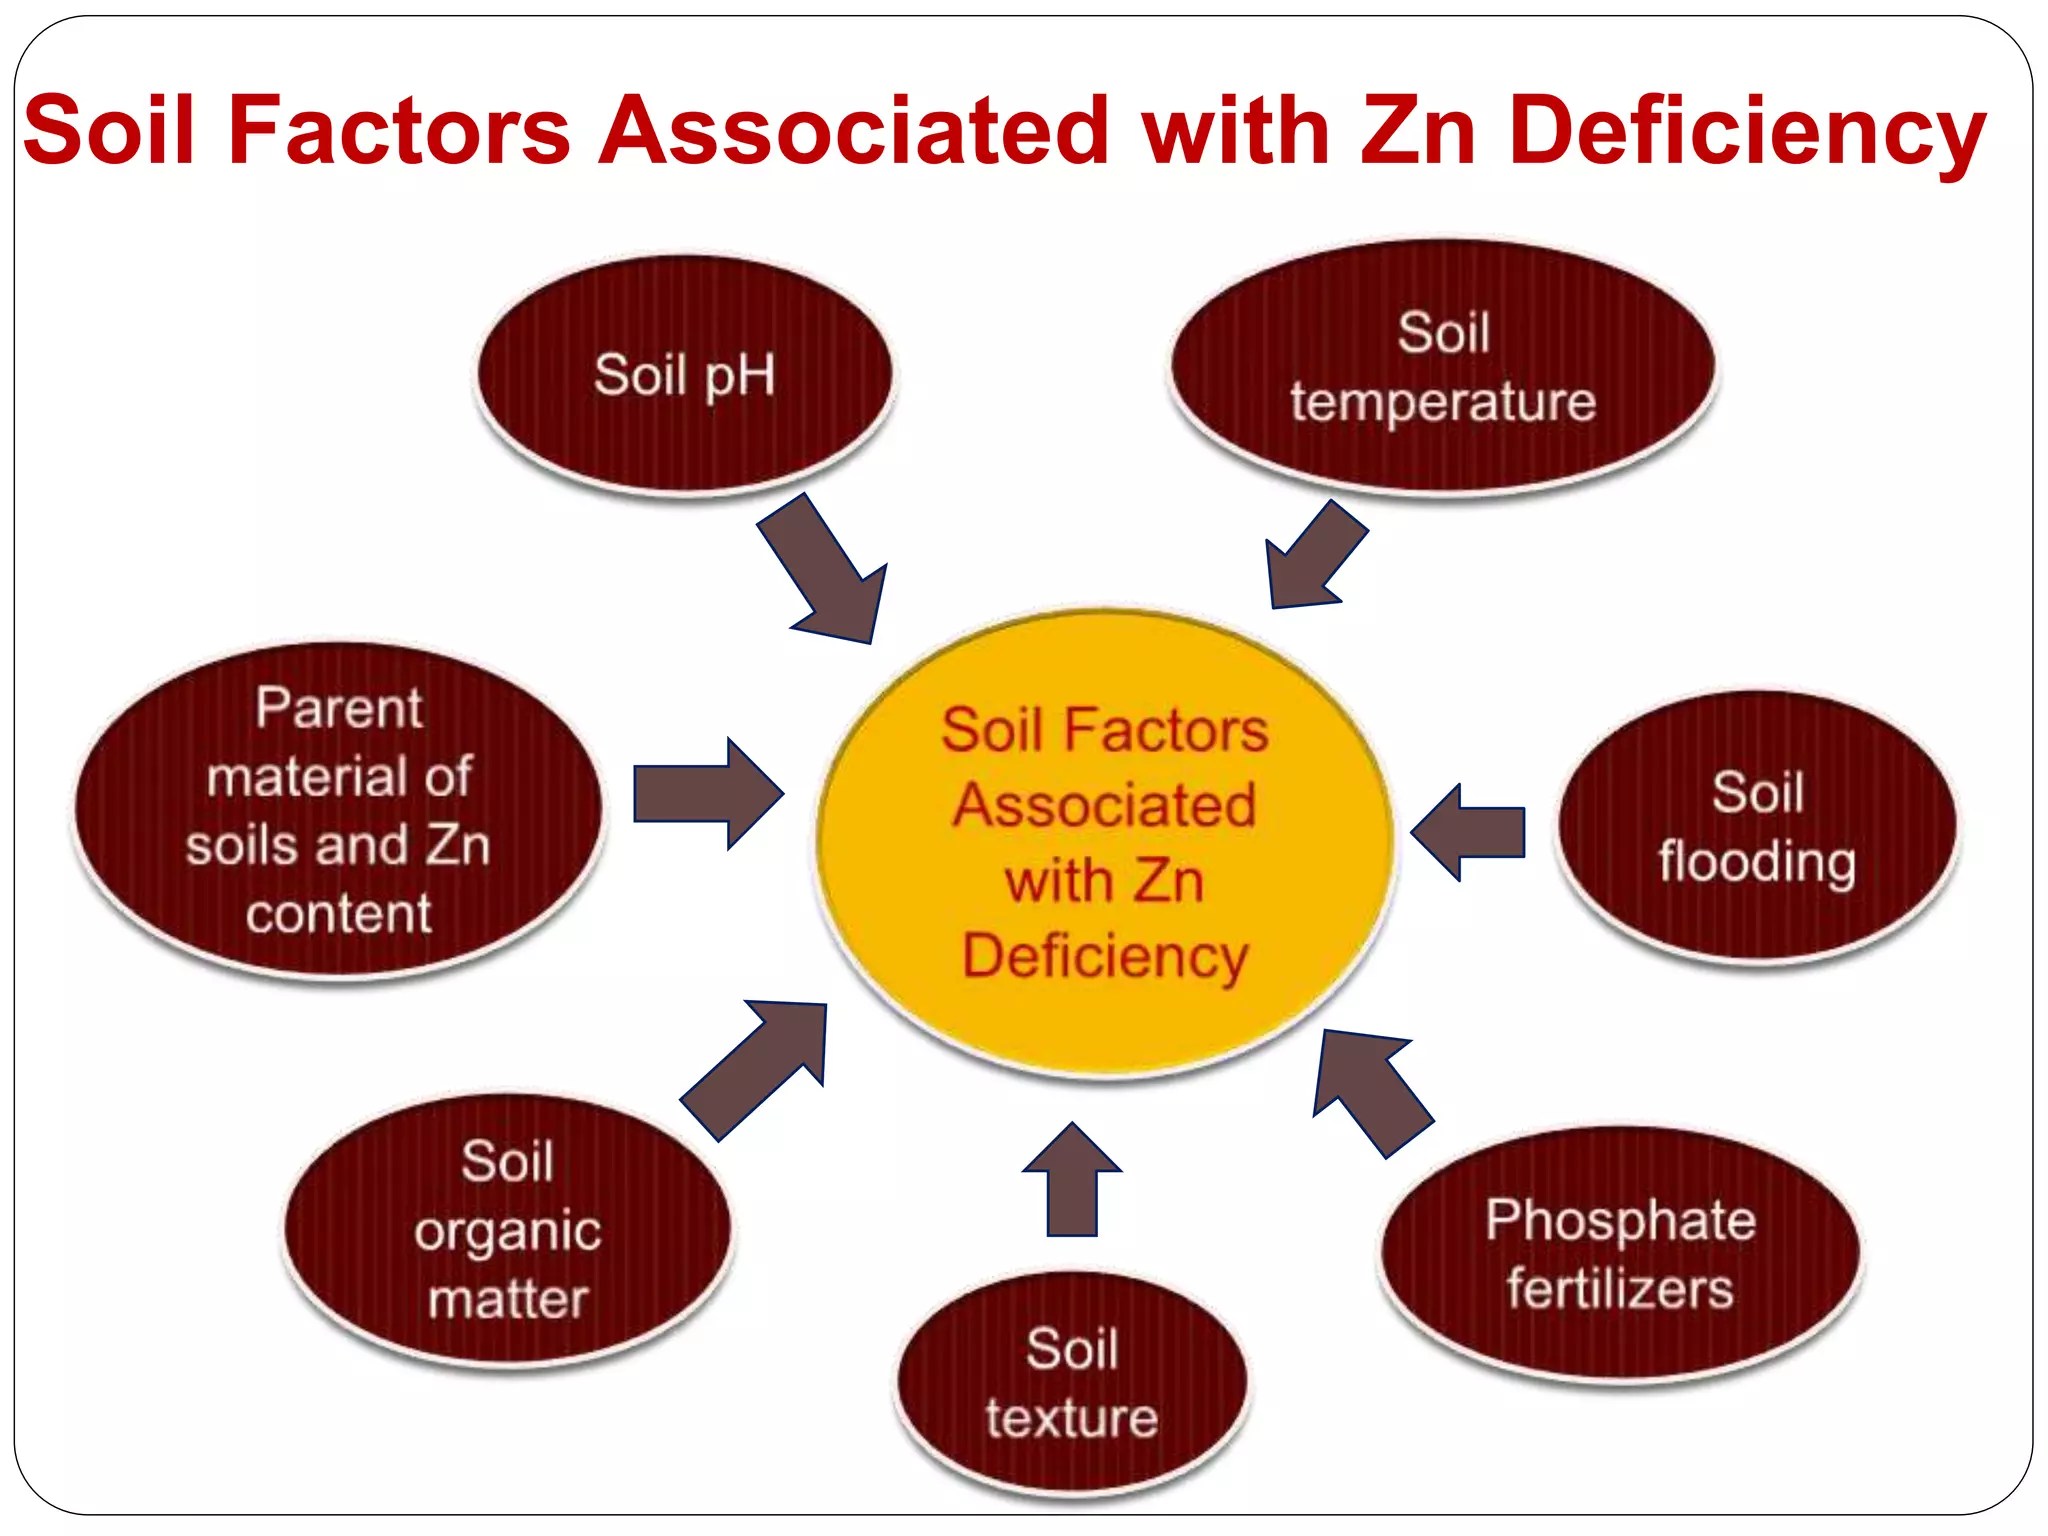

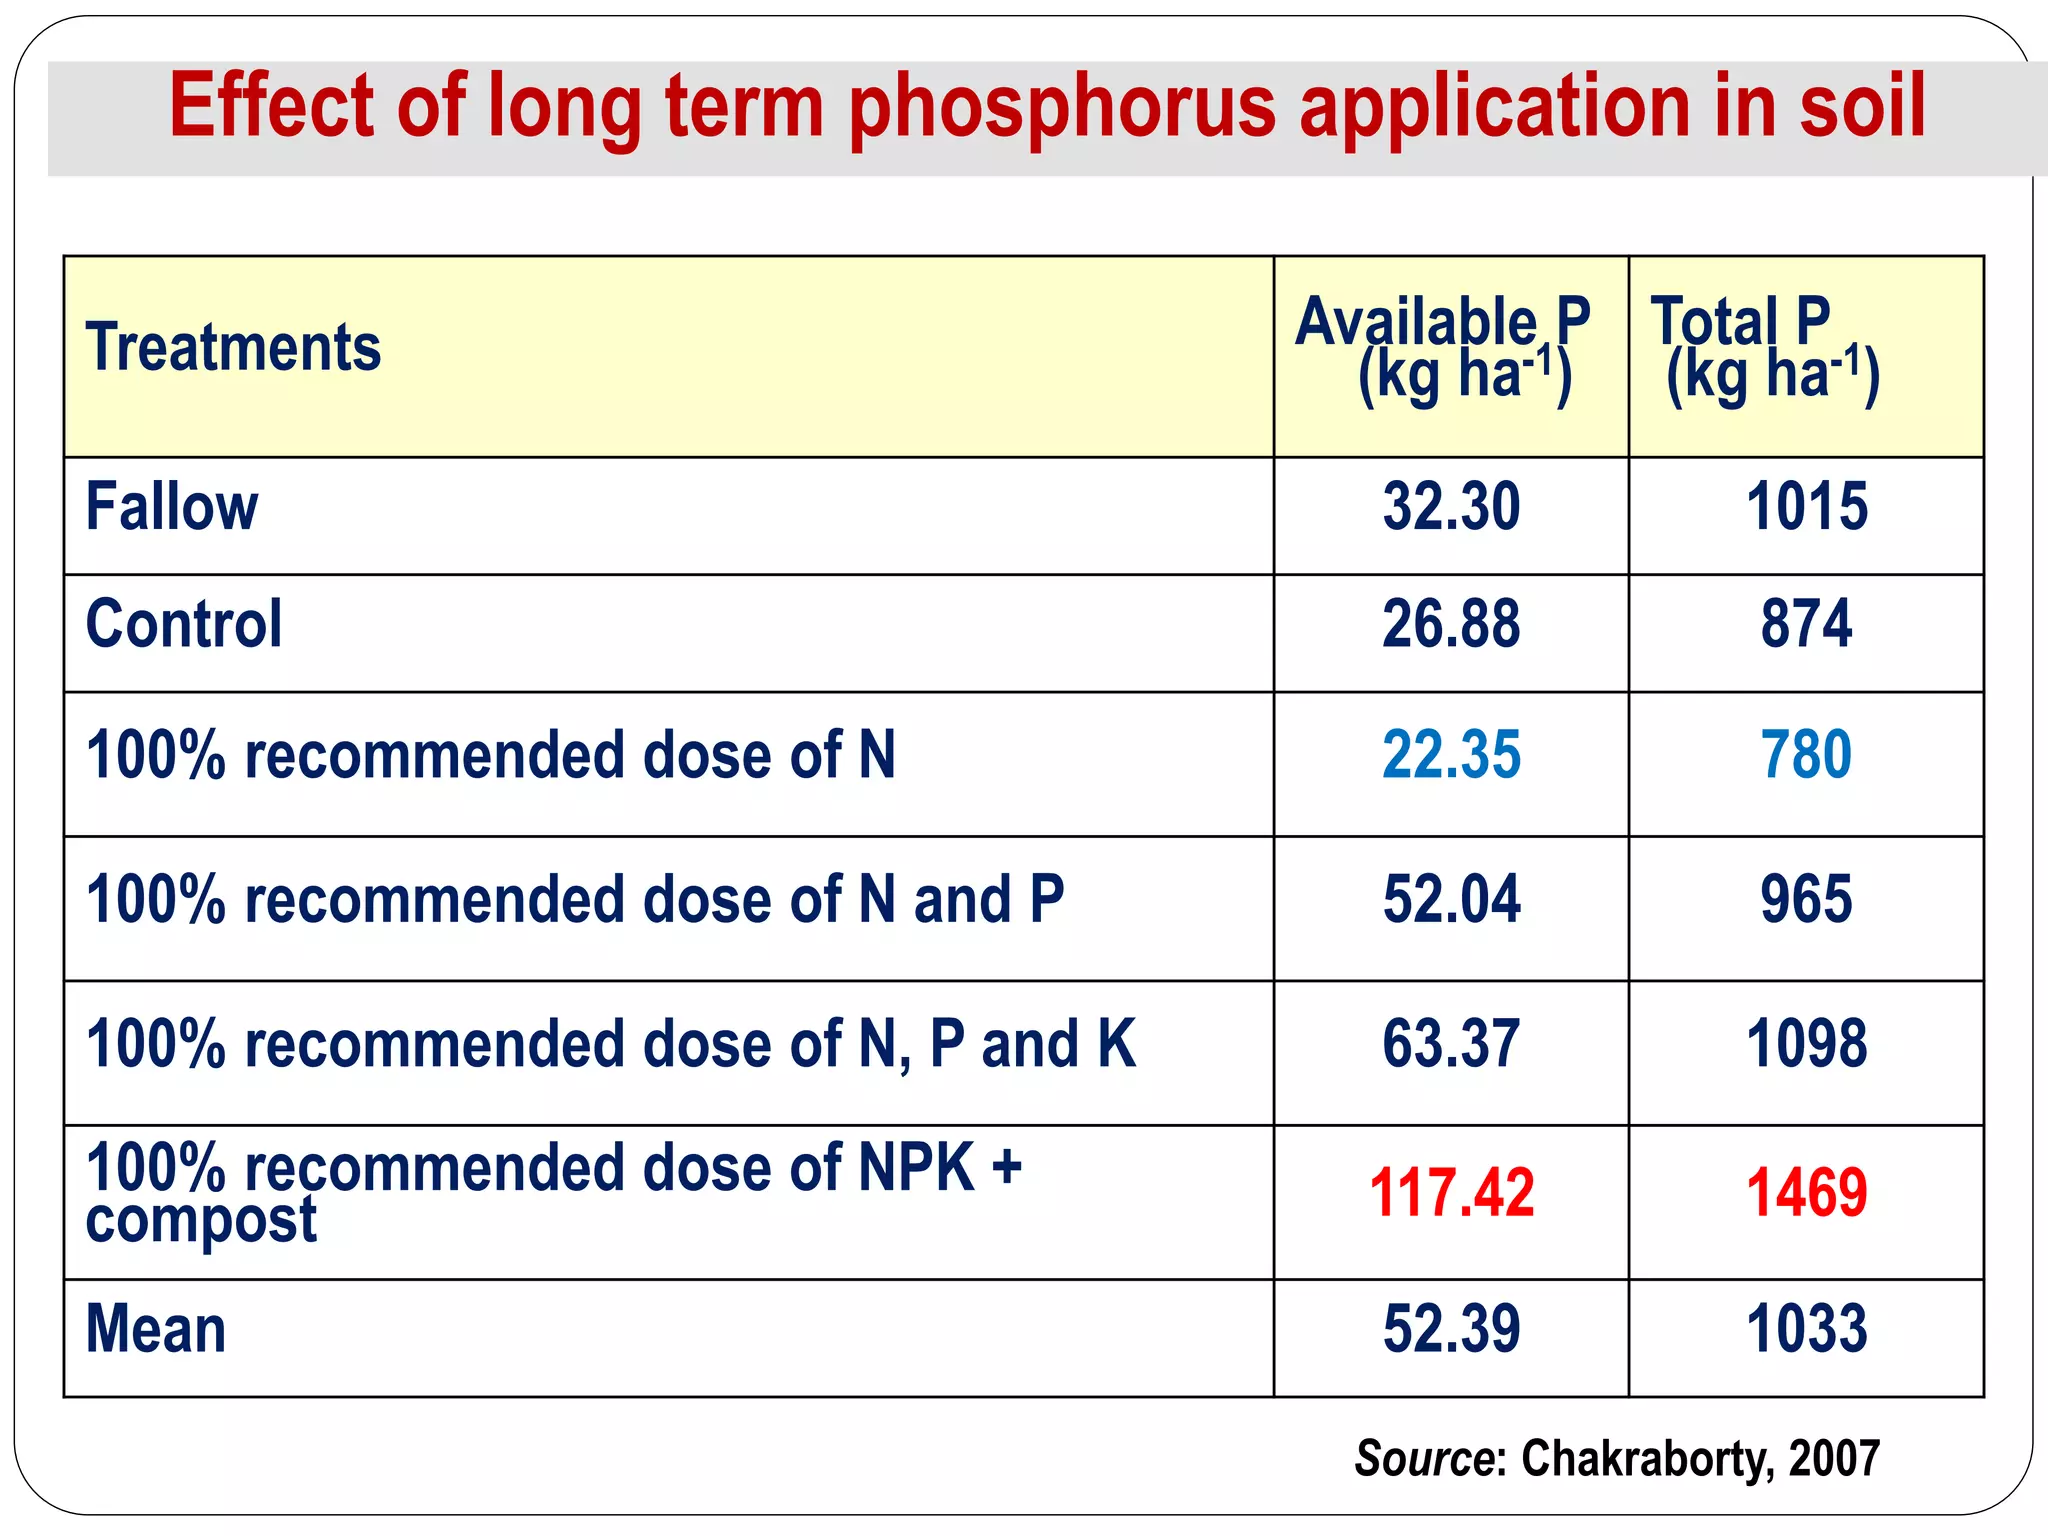
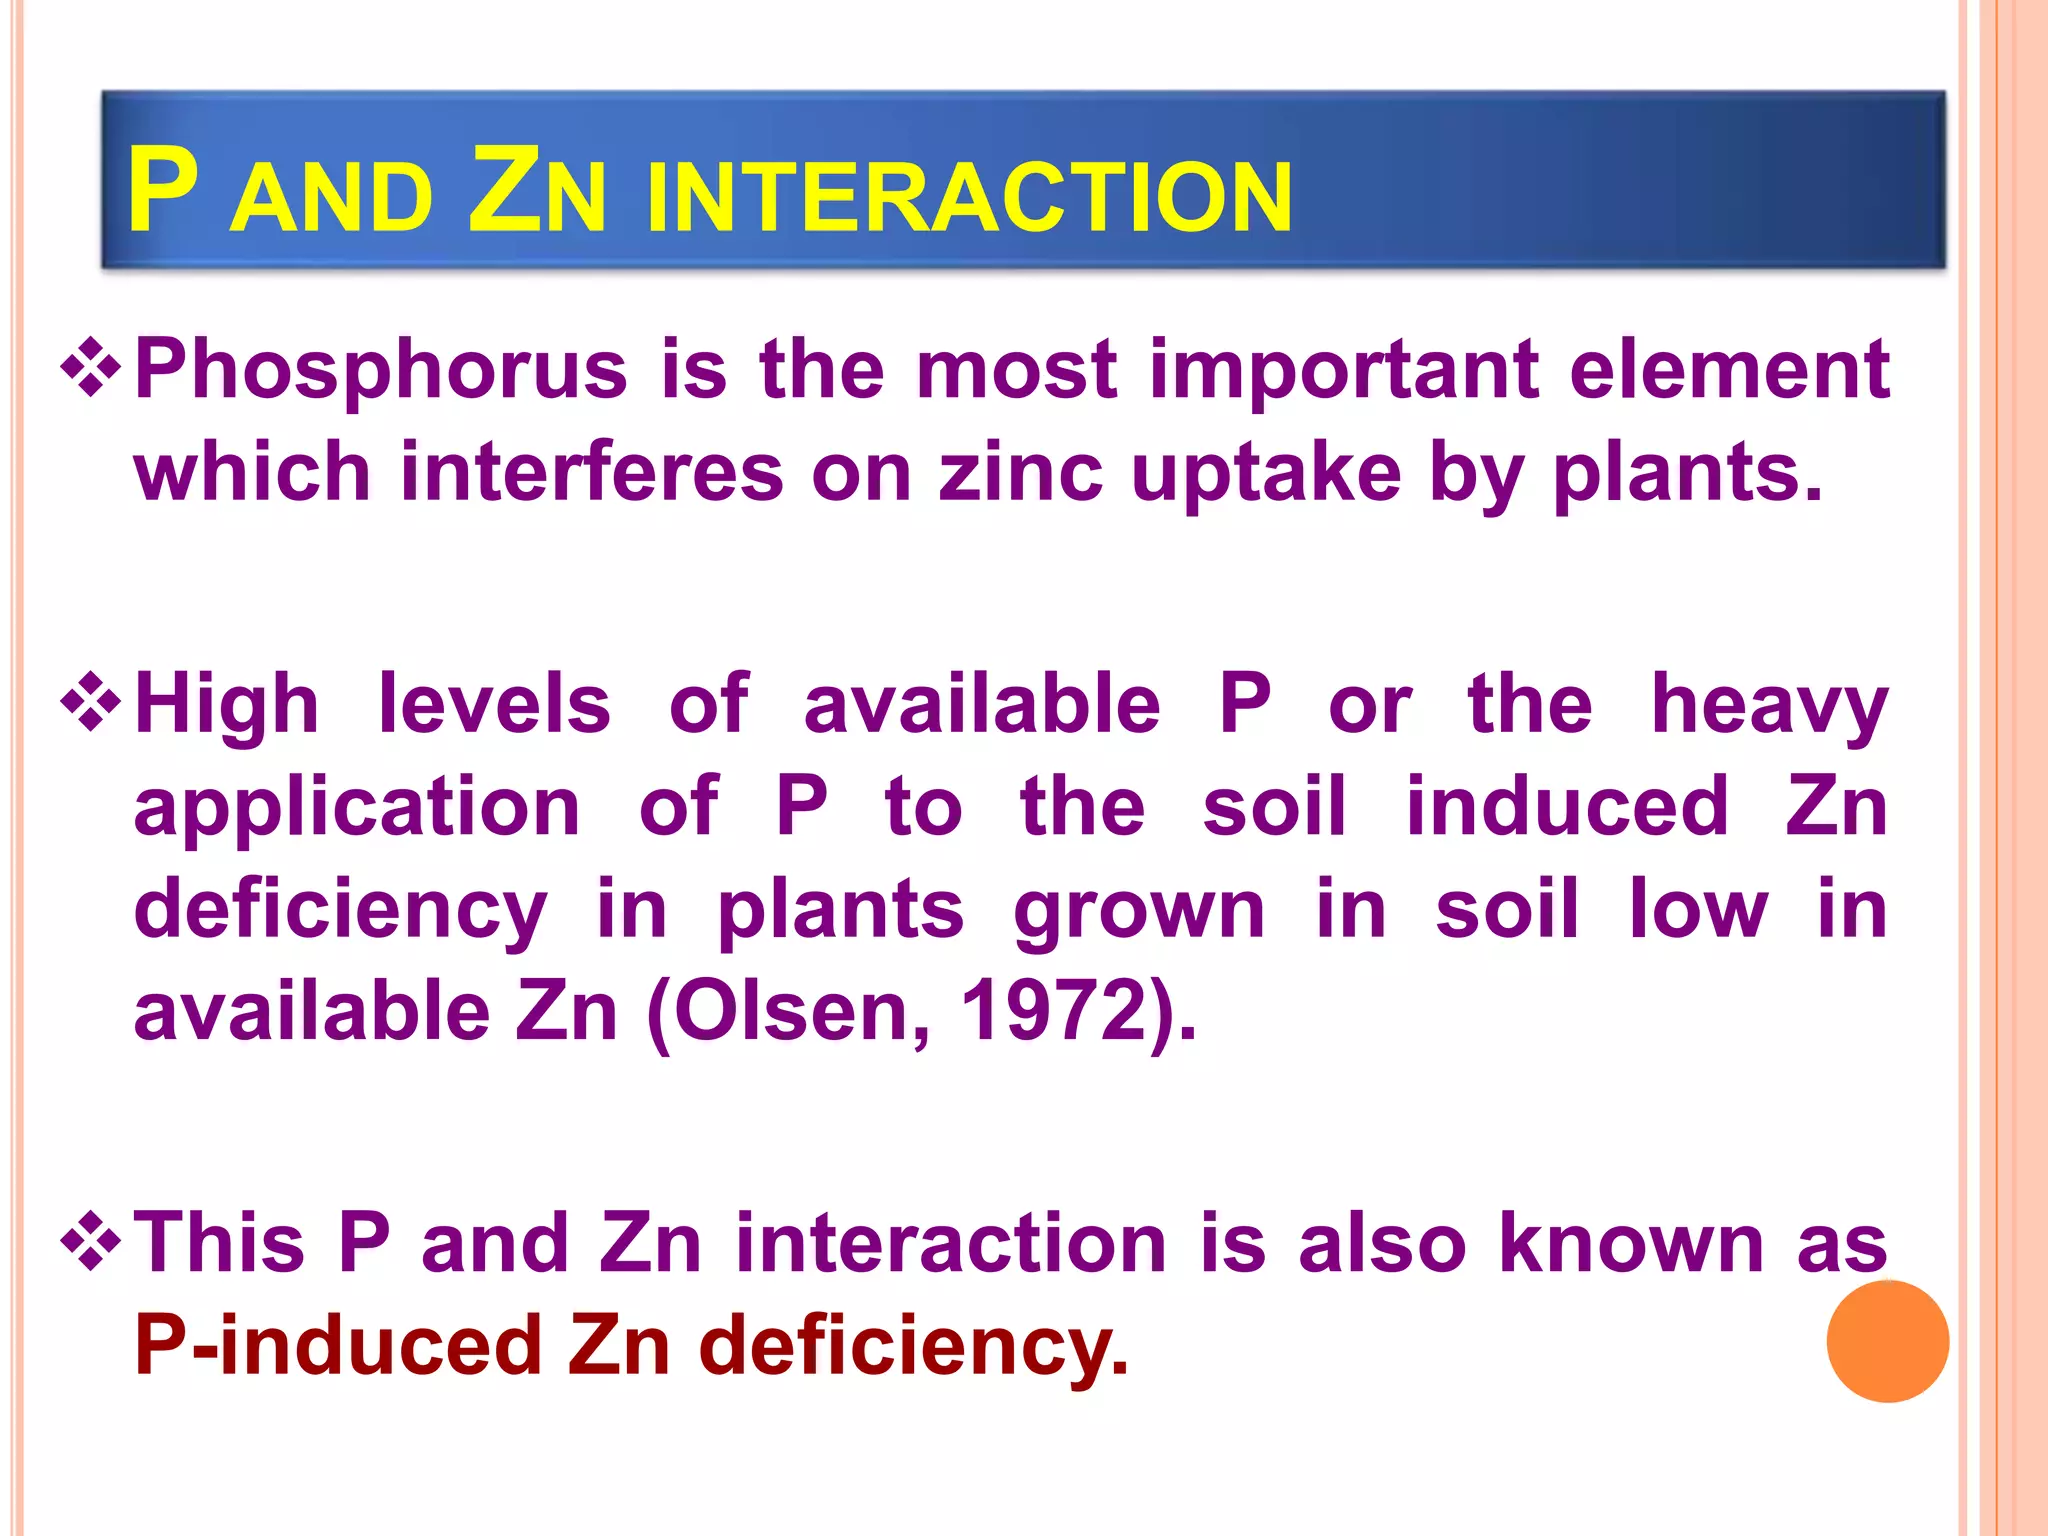
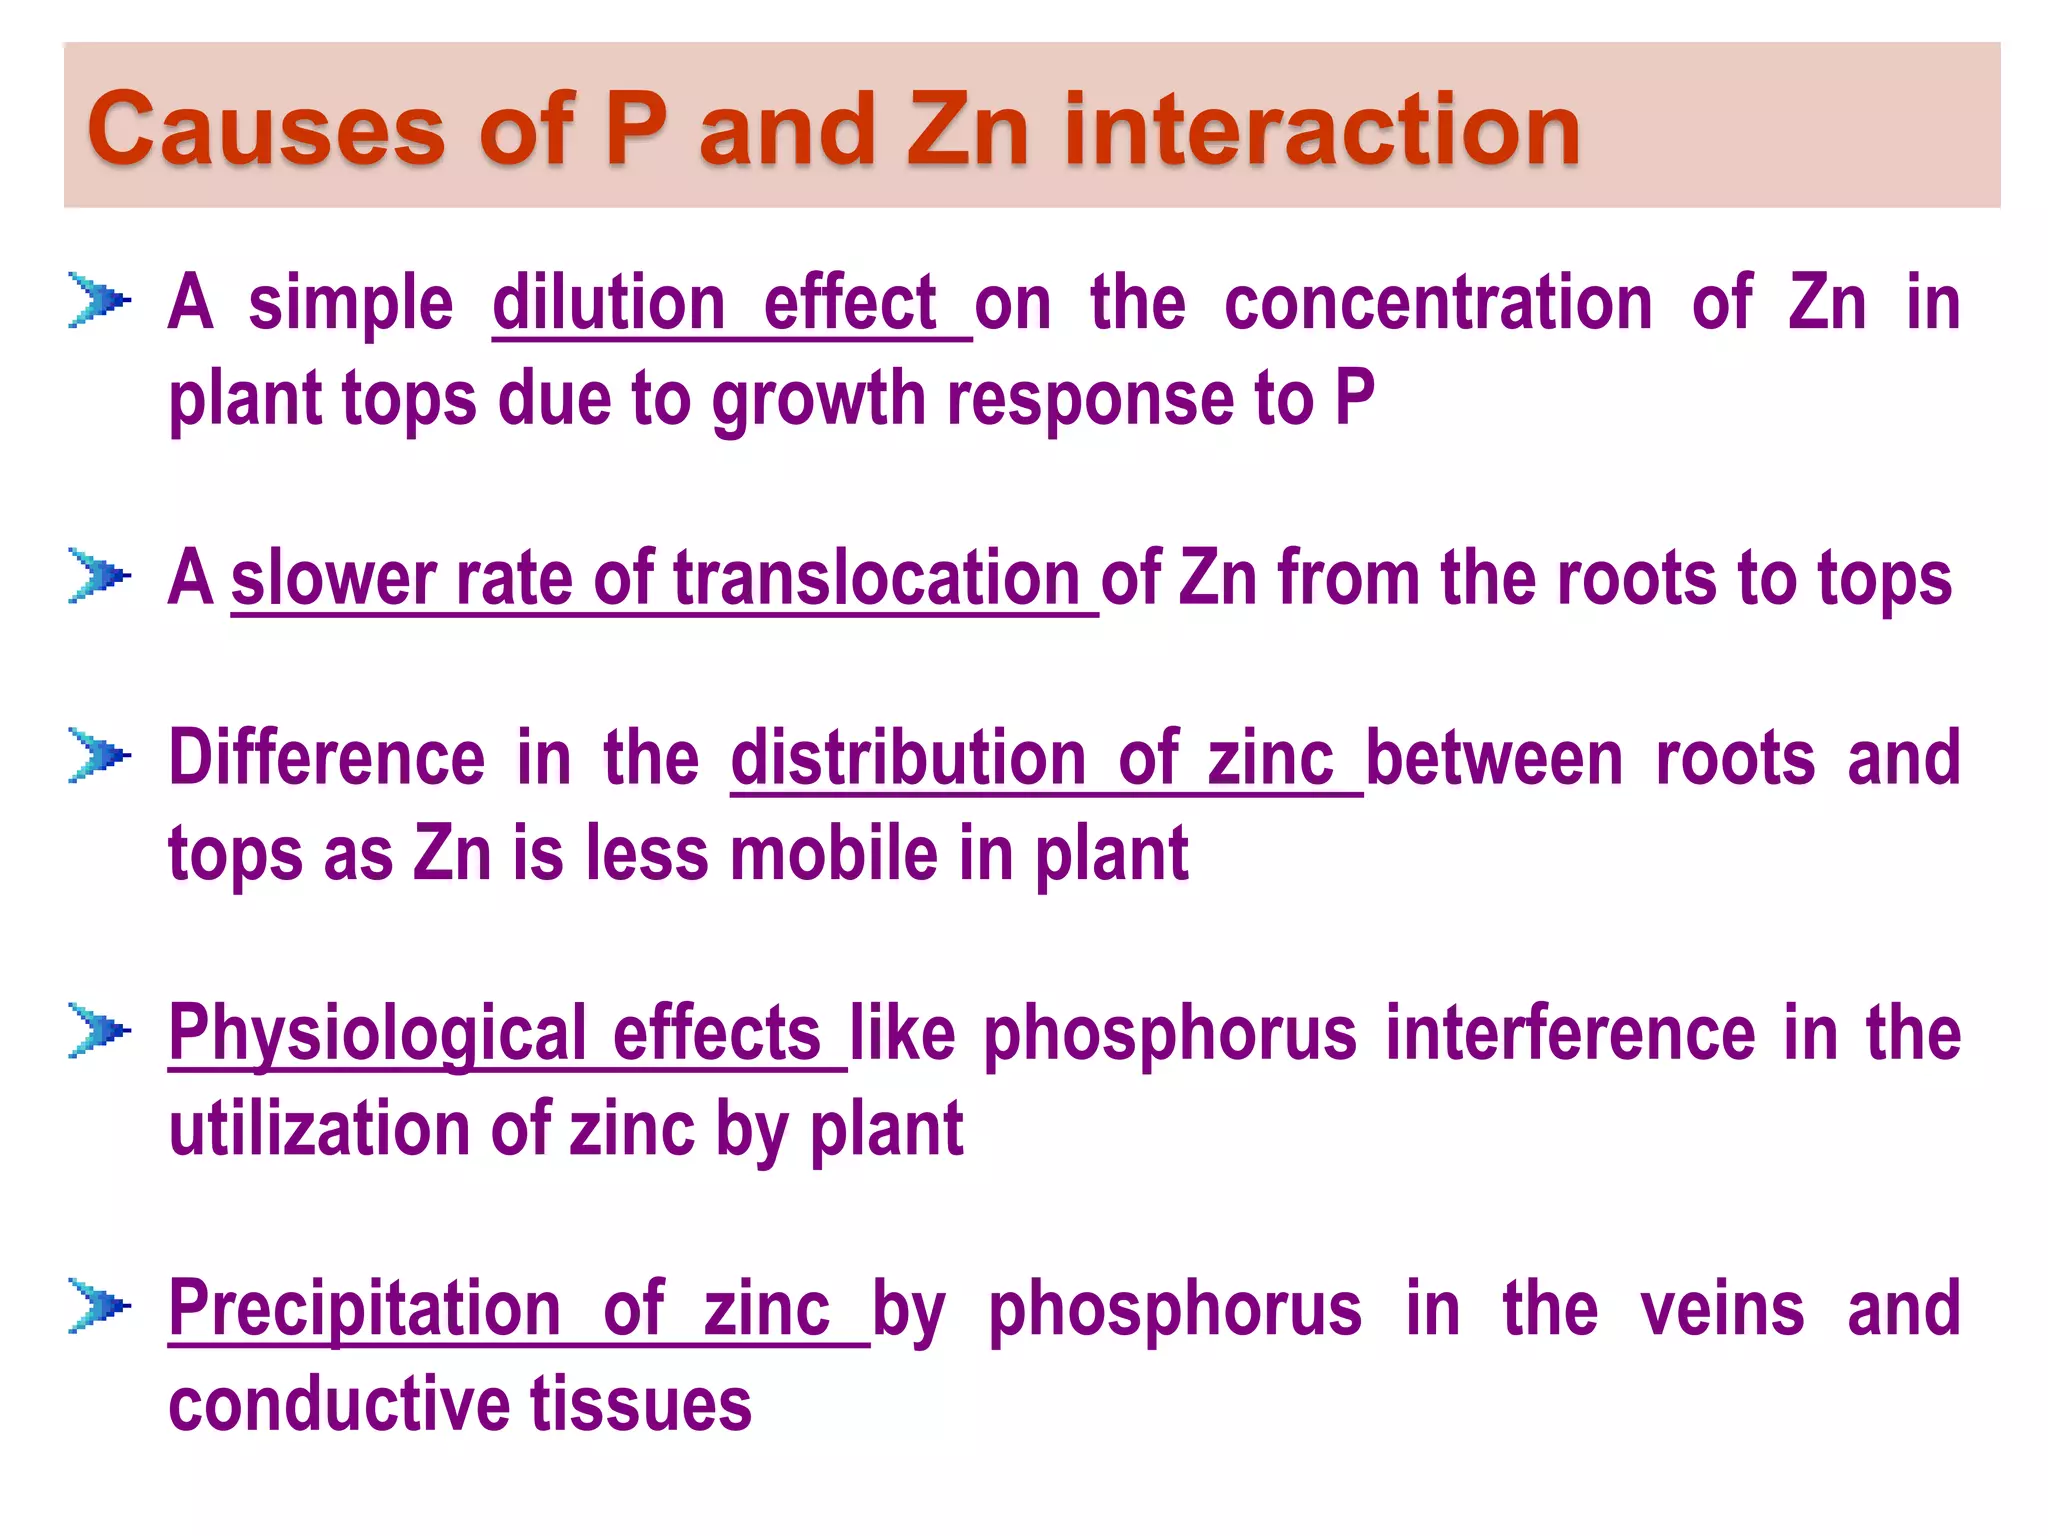
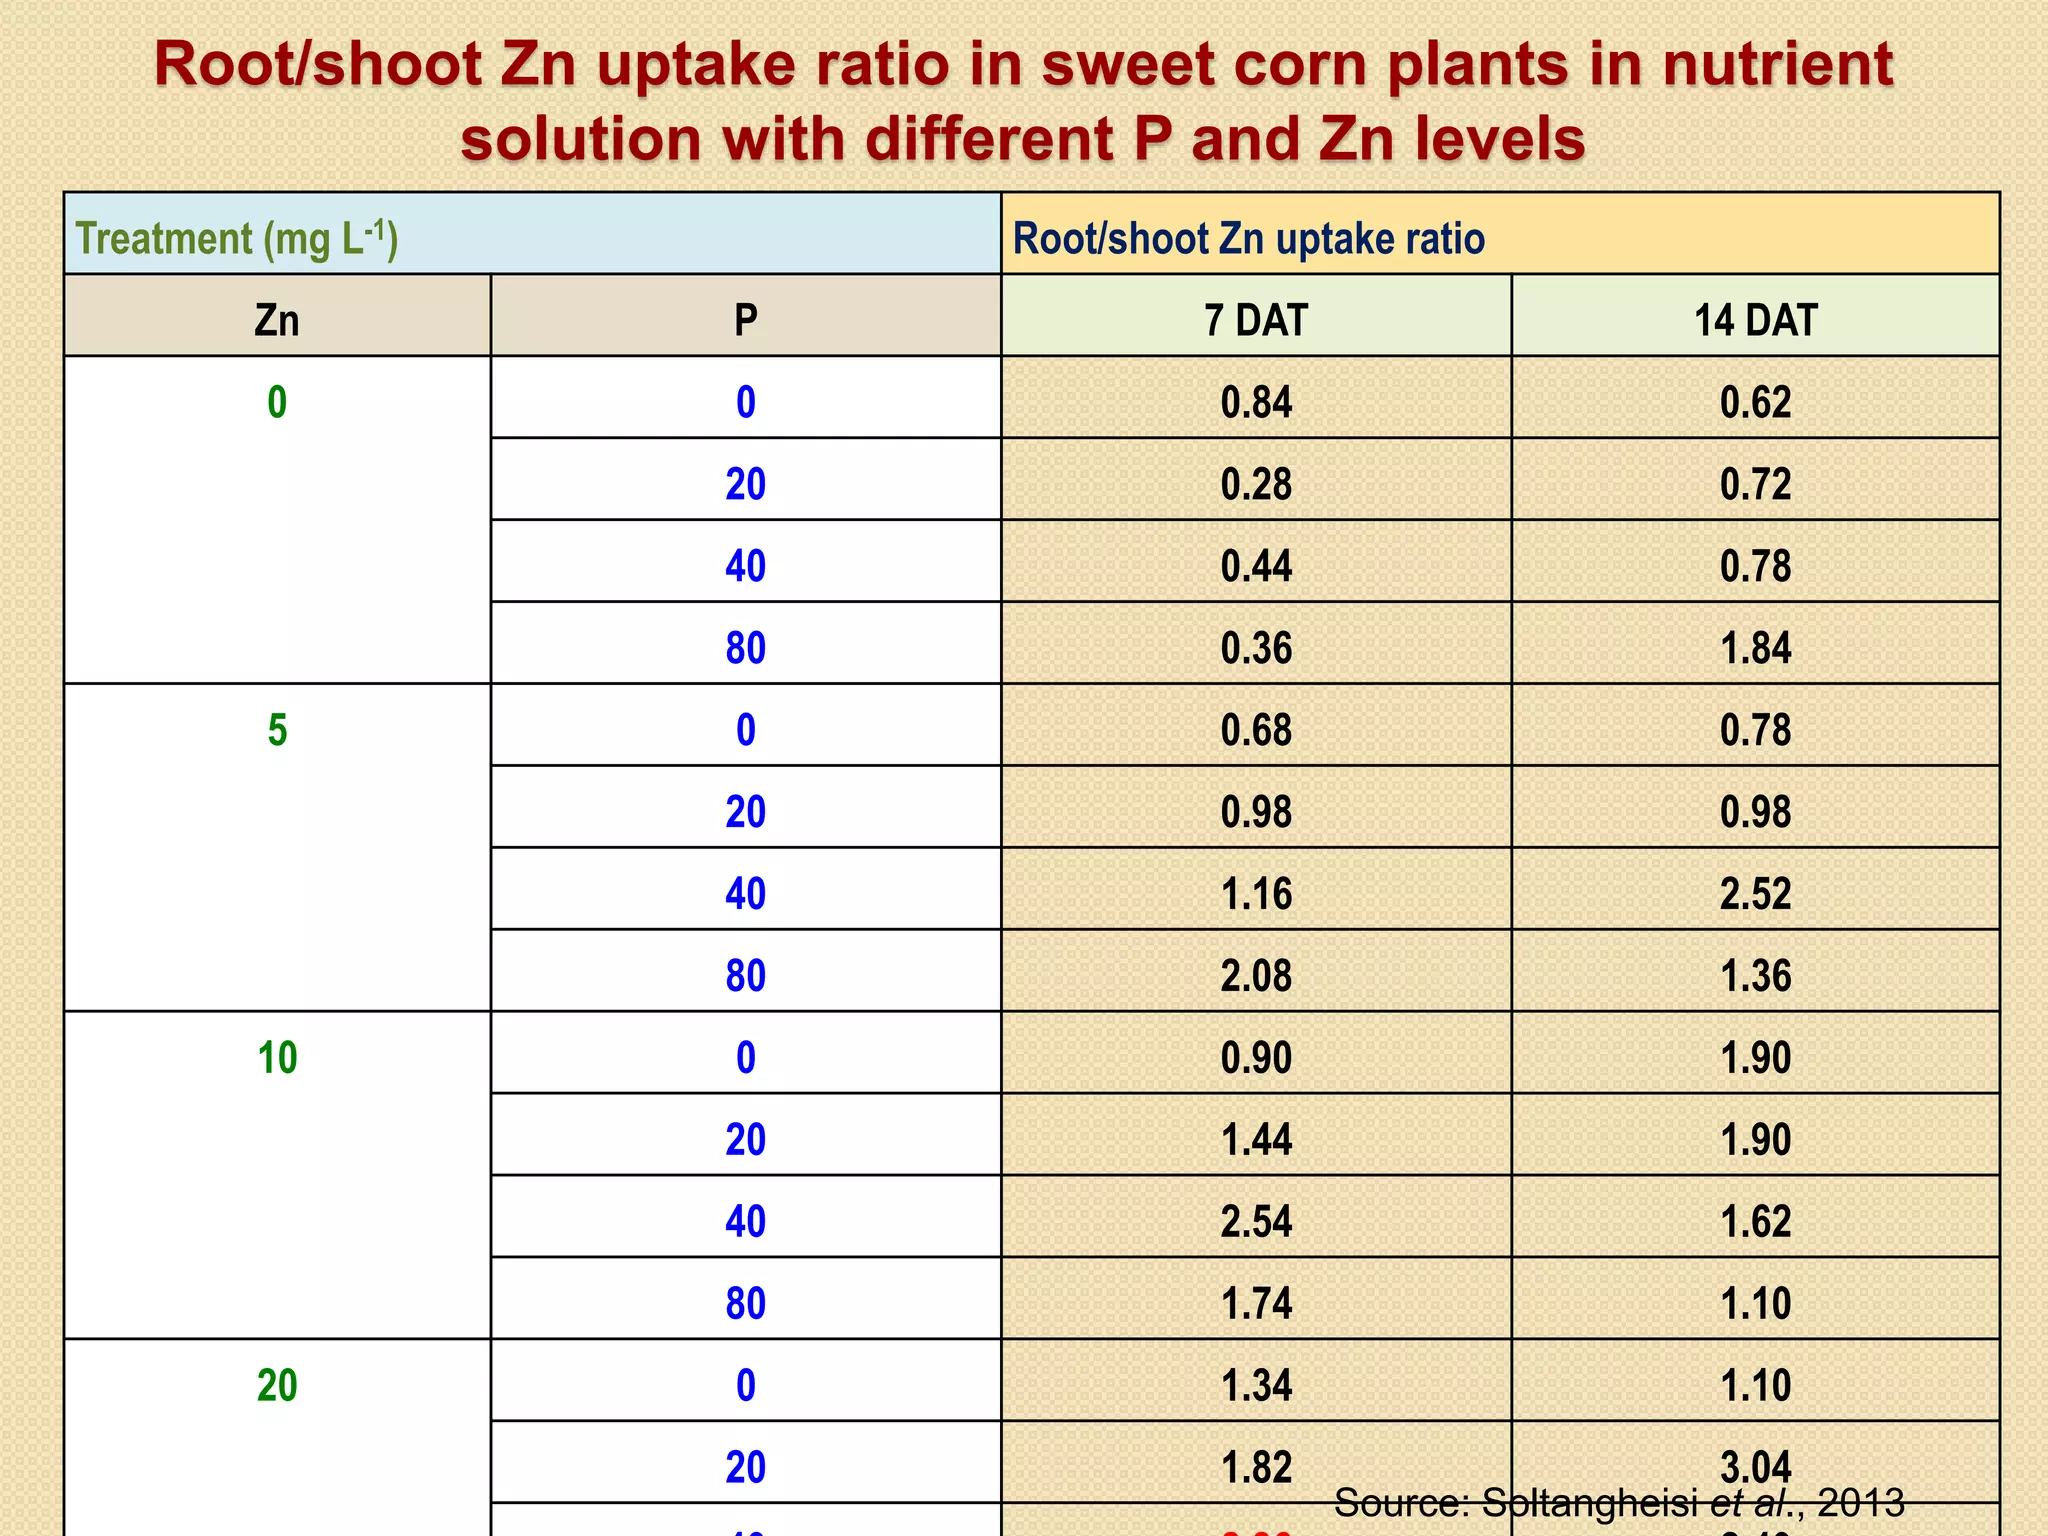
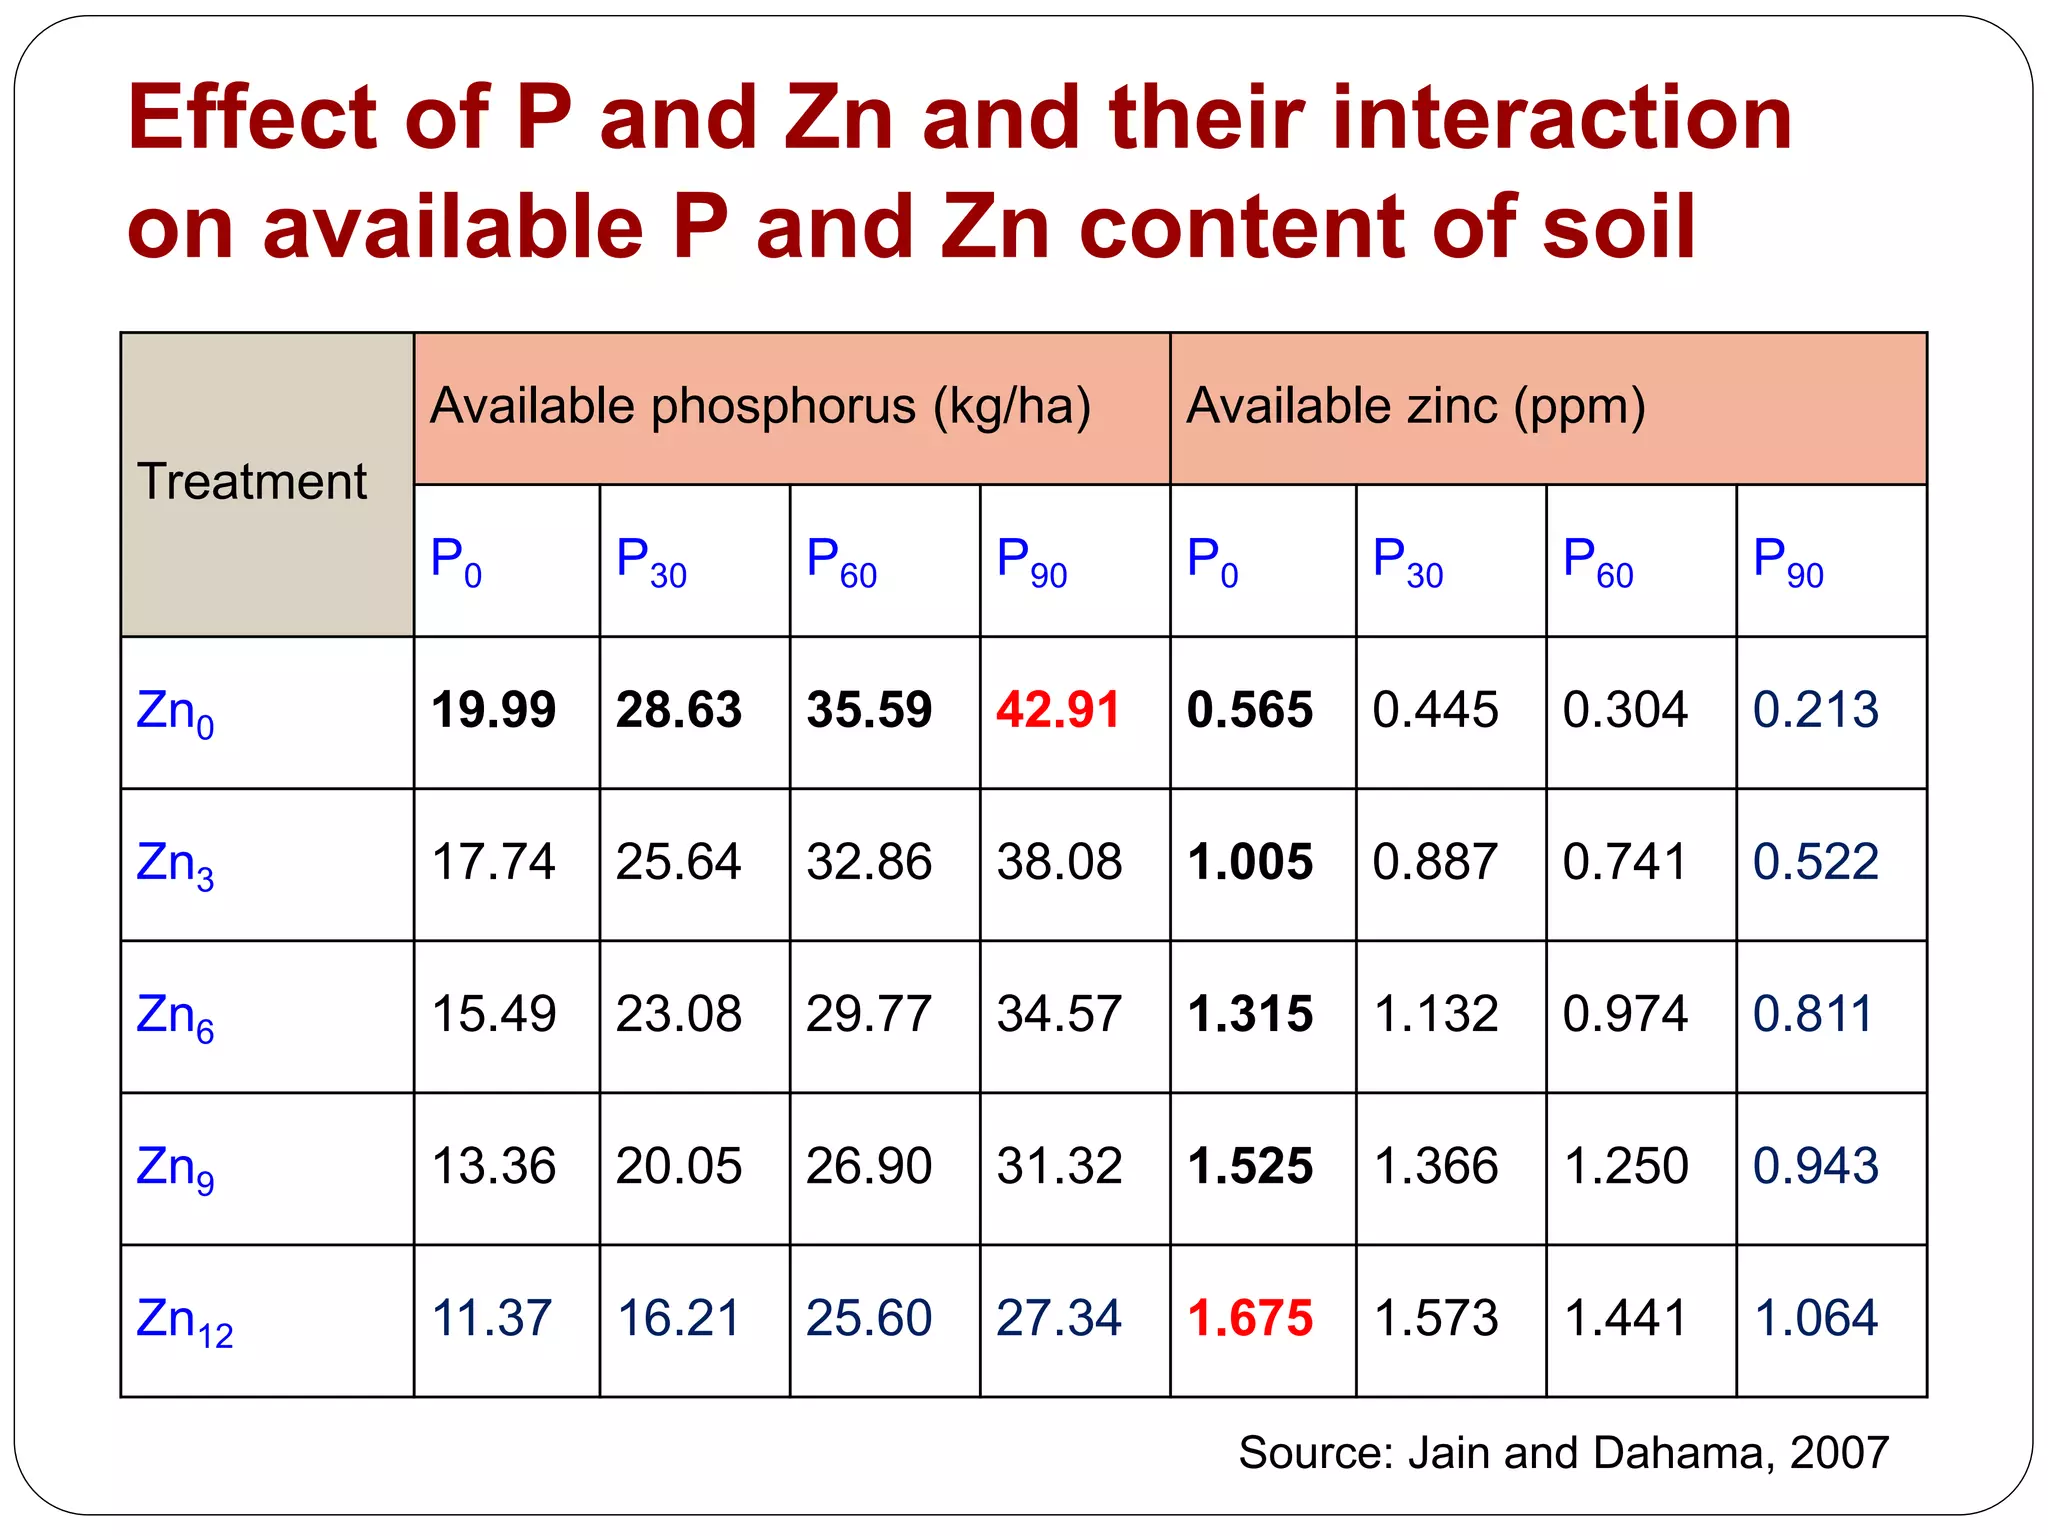
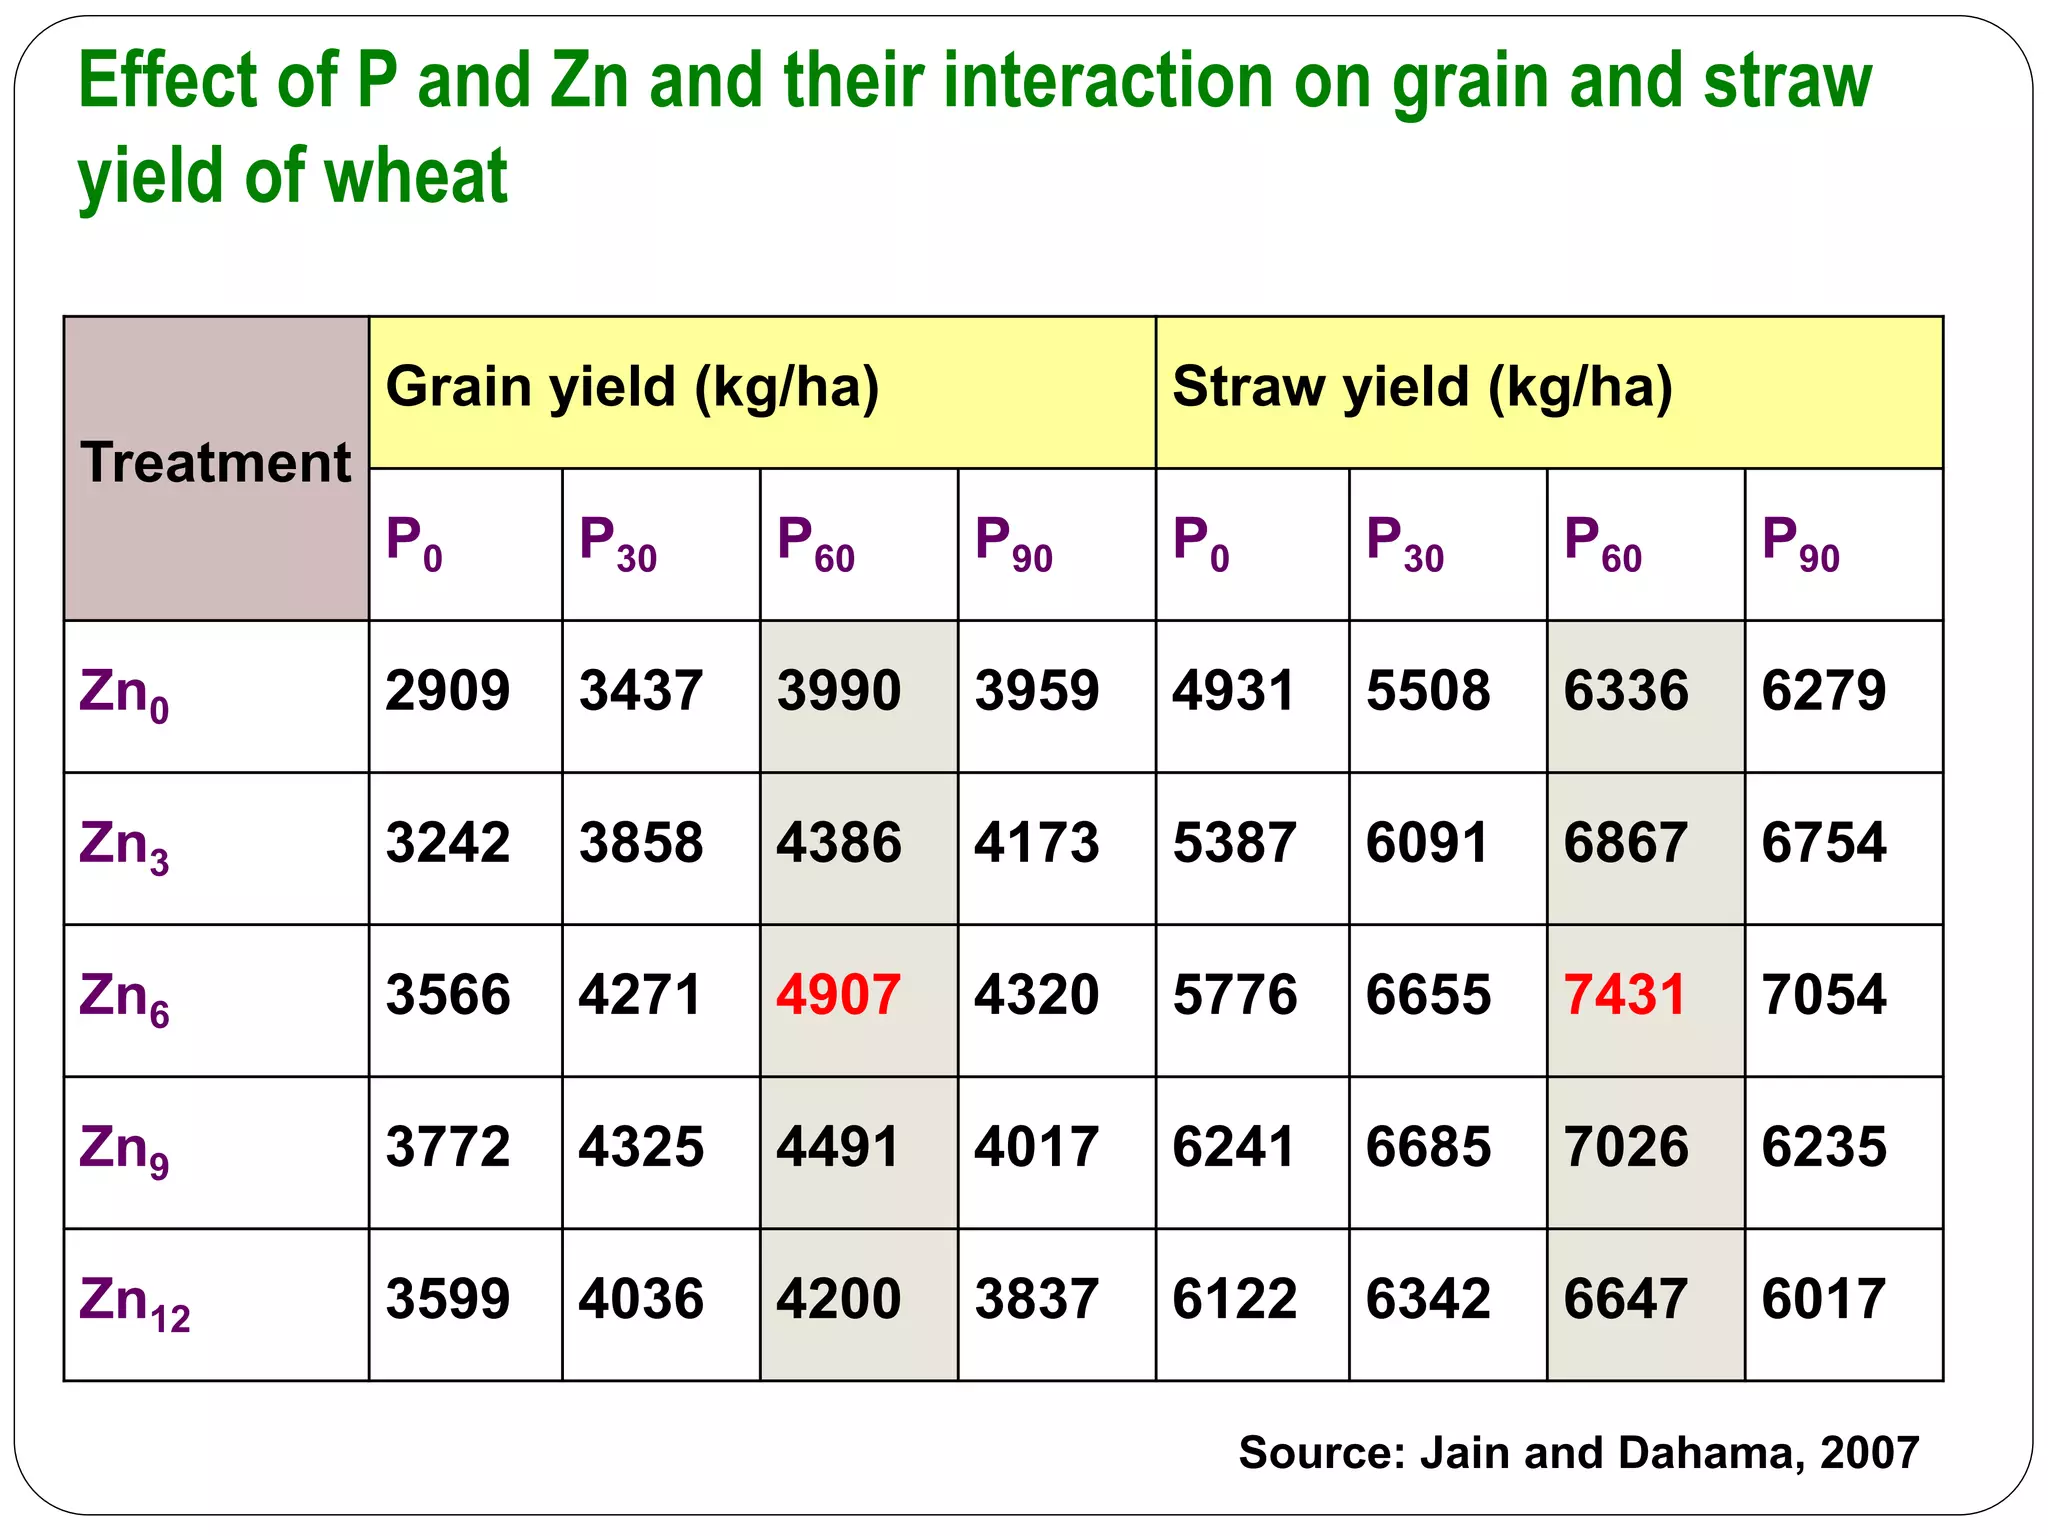
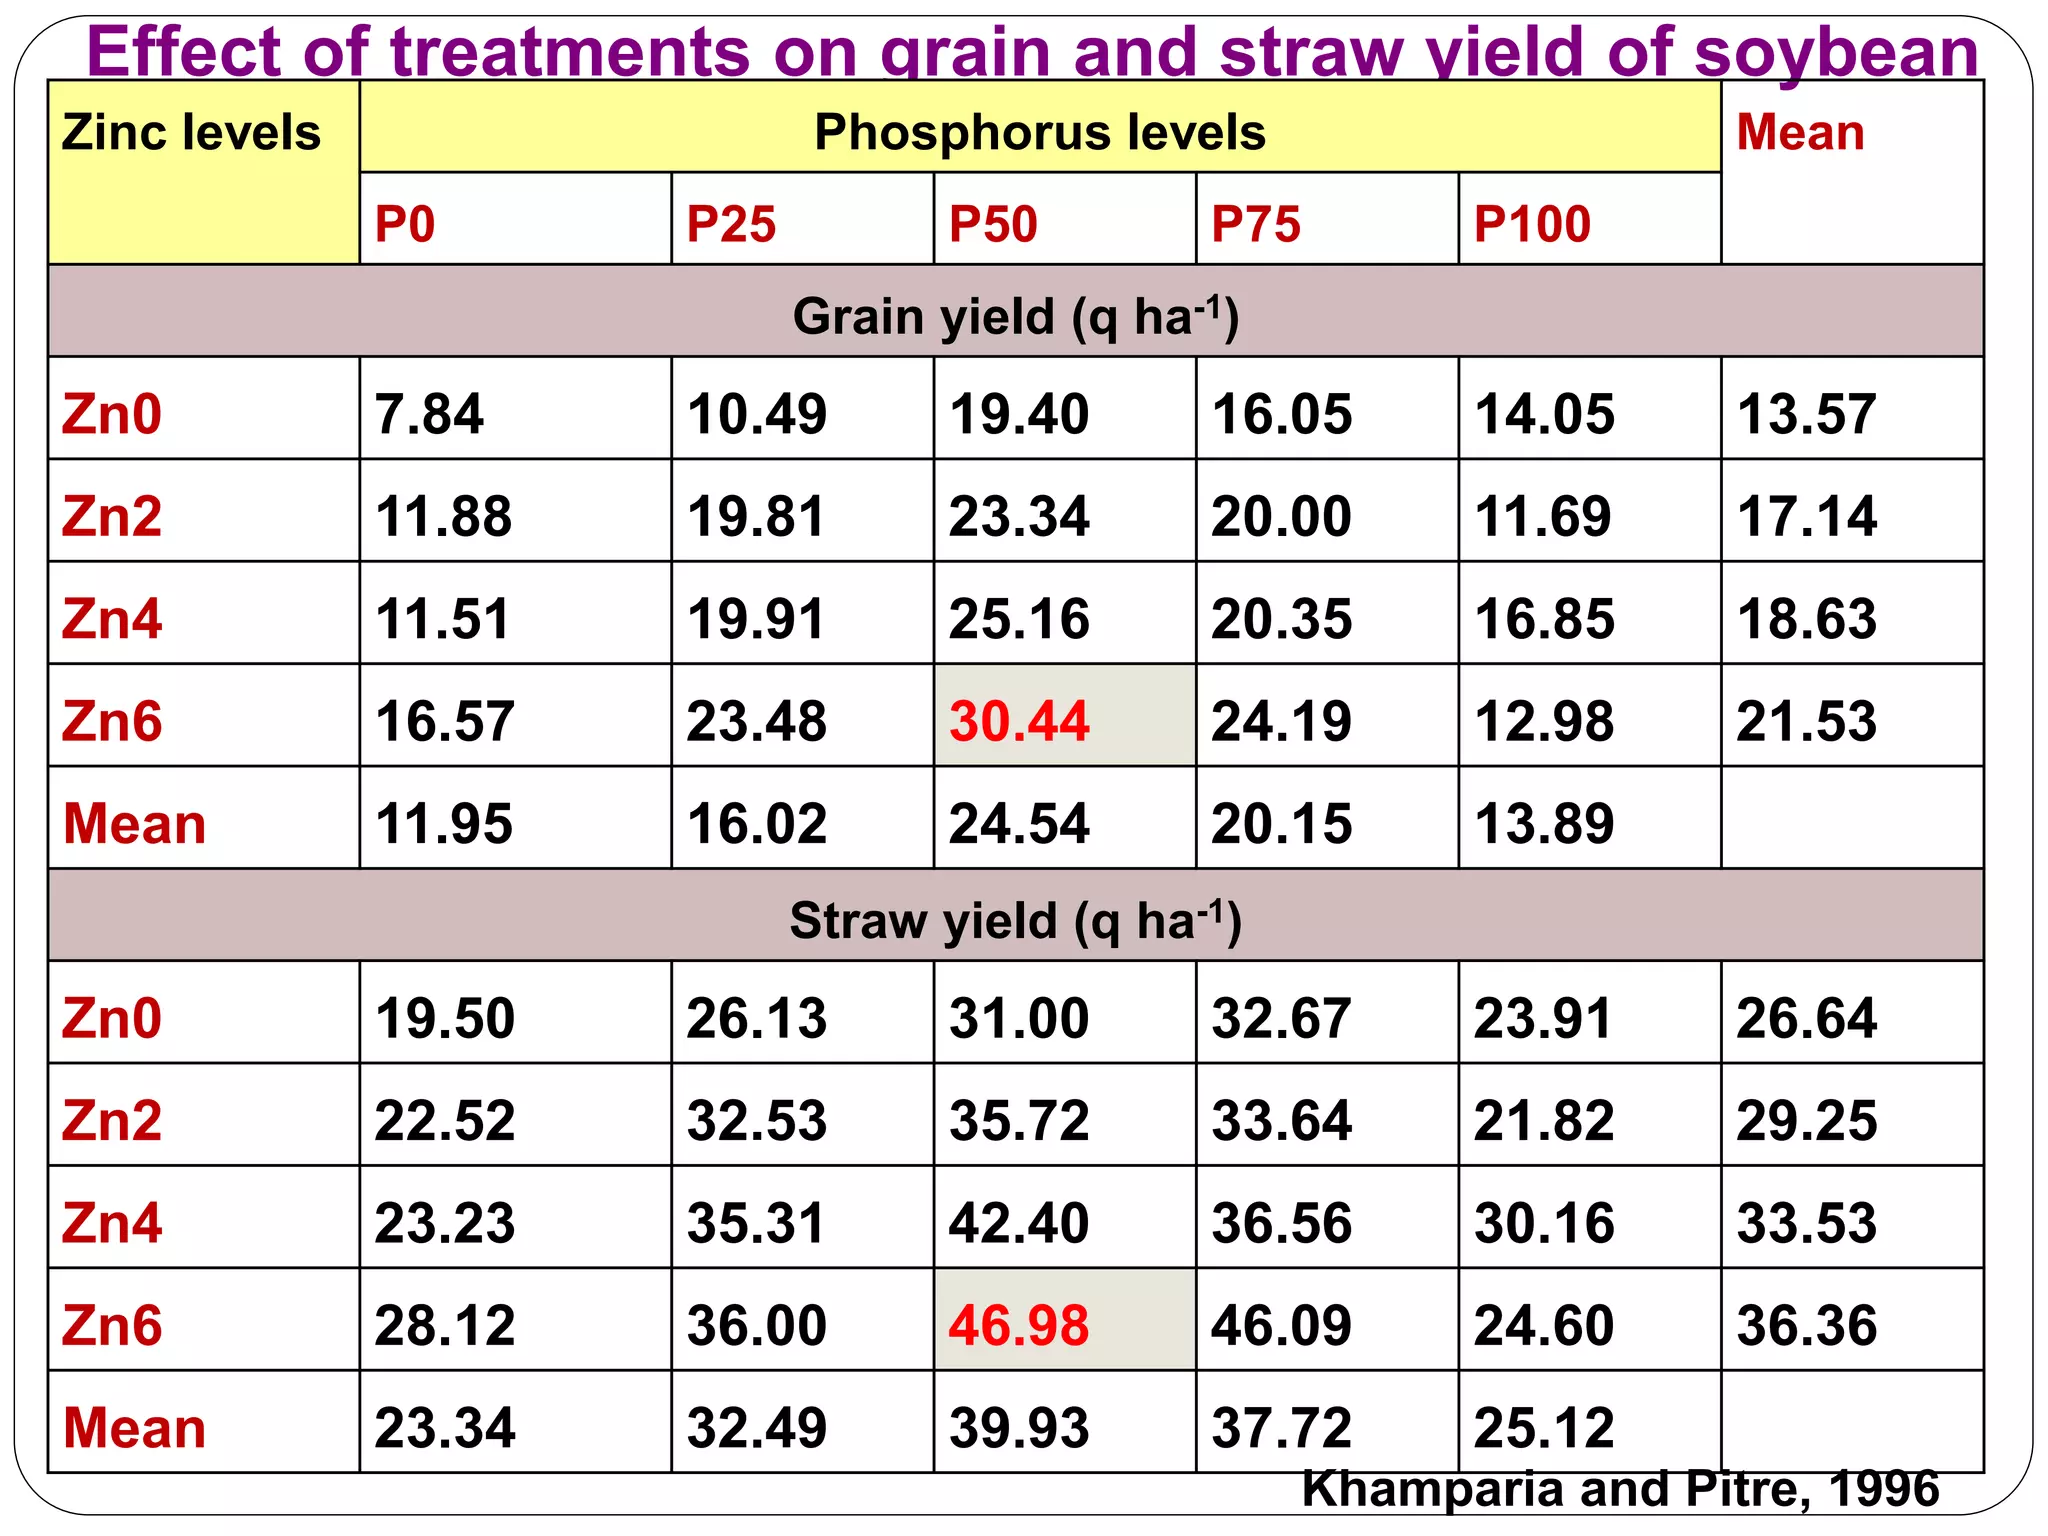
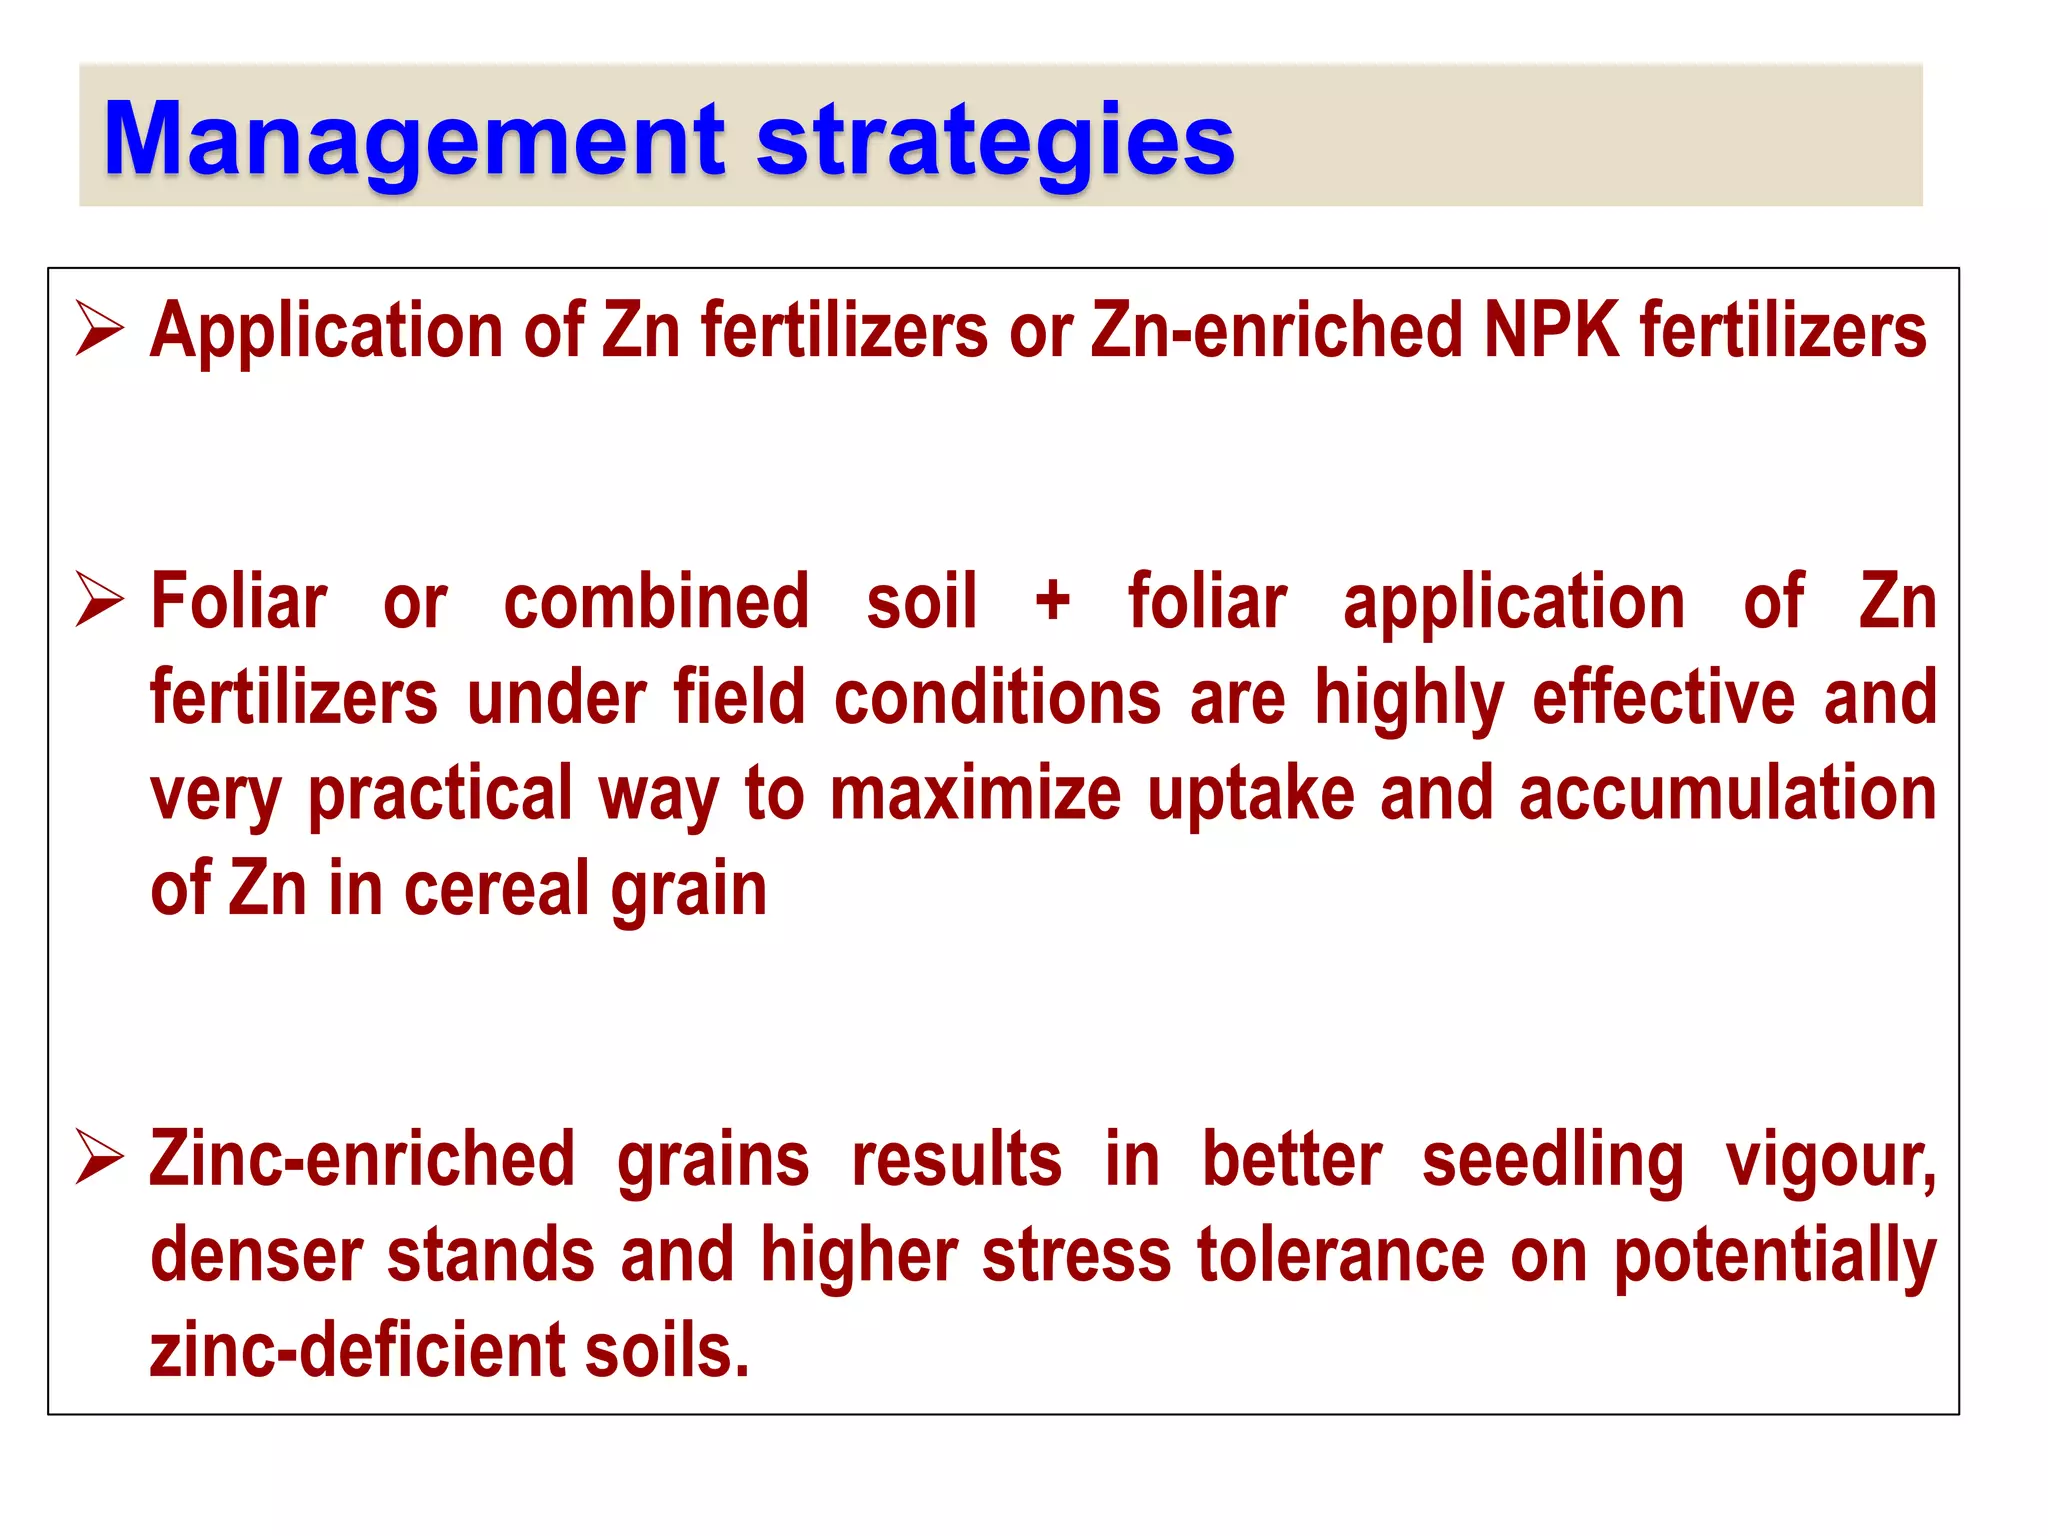


The document examines the effect of phosphorus build-up on zinc availability in soils used for rice cultivation in West Bengal, India, emphasizing zinc deficiency as a widespread issue. It discusses the critical roles of phosphorus and zinc in plant growth, their interaction, and how phosphorus can induce zinc deficiency. The document also outlines management strategies to improve zinc uptake in crops, highlighting the importance of applying zinc fertilizers to mitigate deficiencies.