Downloaded 268 times


![The signature of shale on
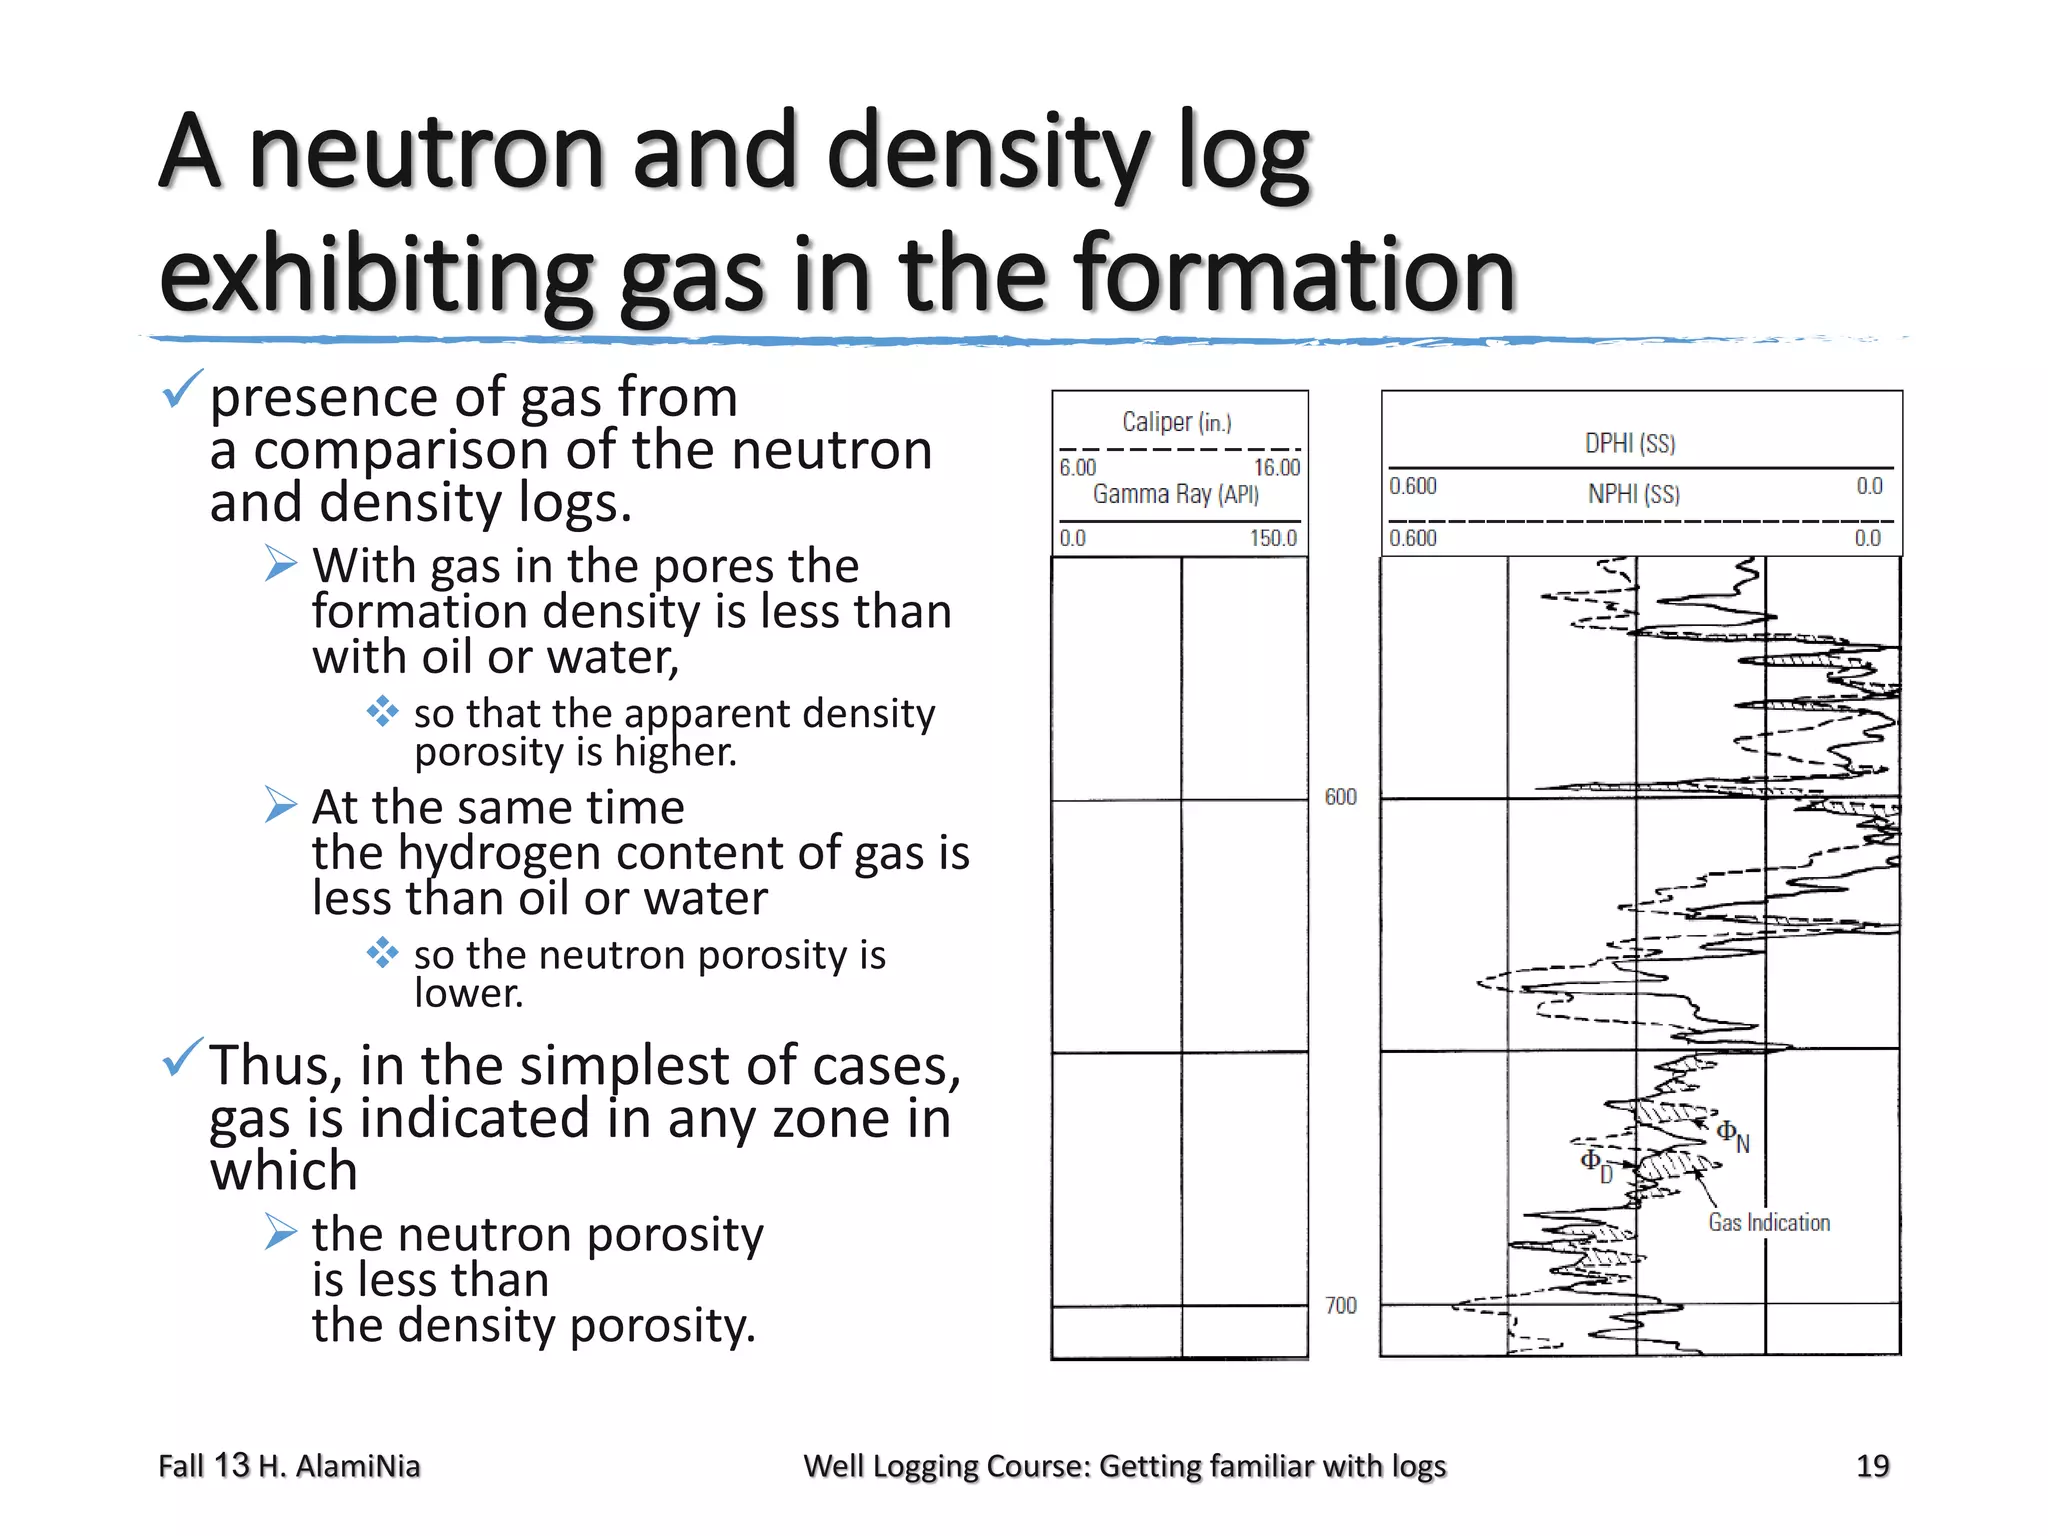
a neutron and density combination log
Shale produces
the opposite effect
[rather than gas]
the neutron porosity
may far exceed
the density porosity
Fall 13 H. AlamiNia
Well Logging Course: Getting familiar with logs
20](https://image.slidesharecdn.com/q921-log-20lec4-20v1-131102220907-phpapp02/75/Q921-log-lec4-v1-20-2048.jpg)


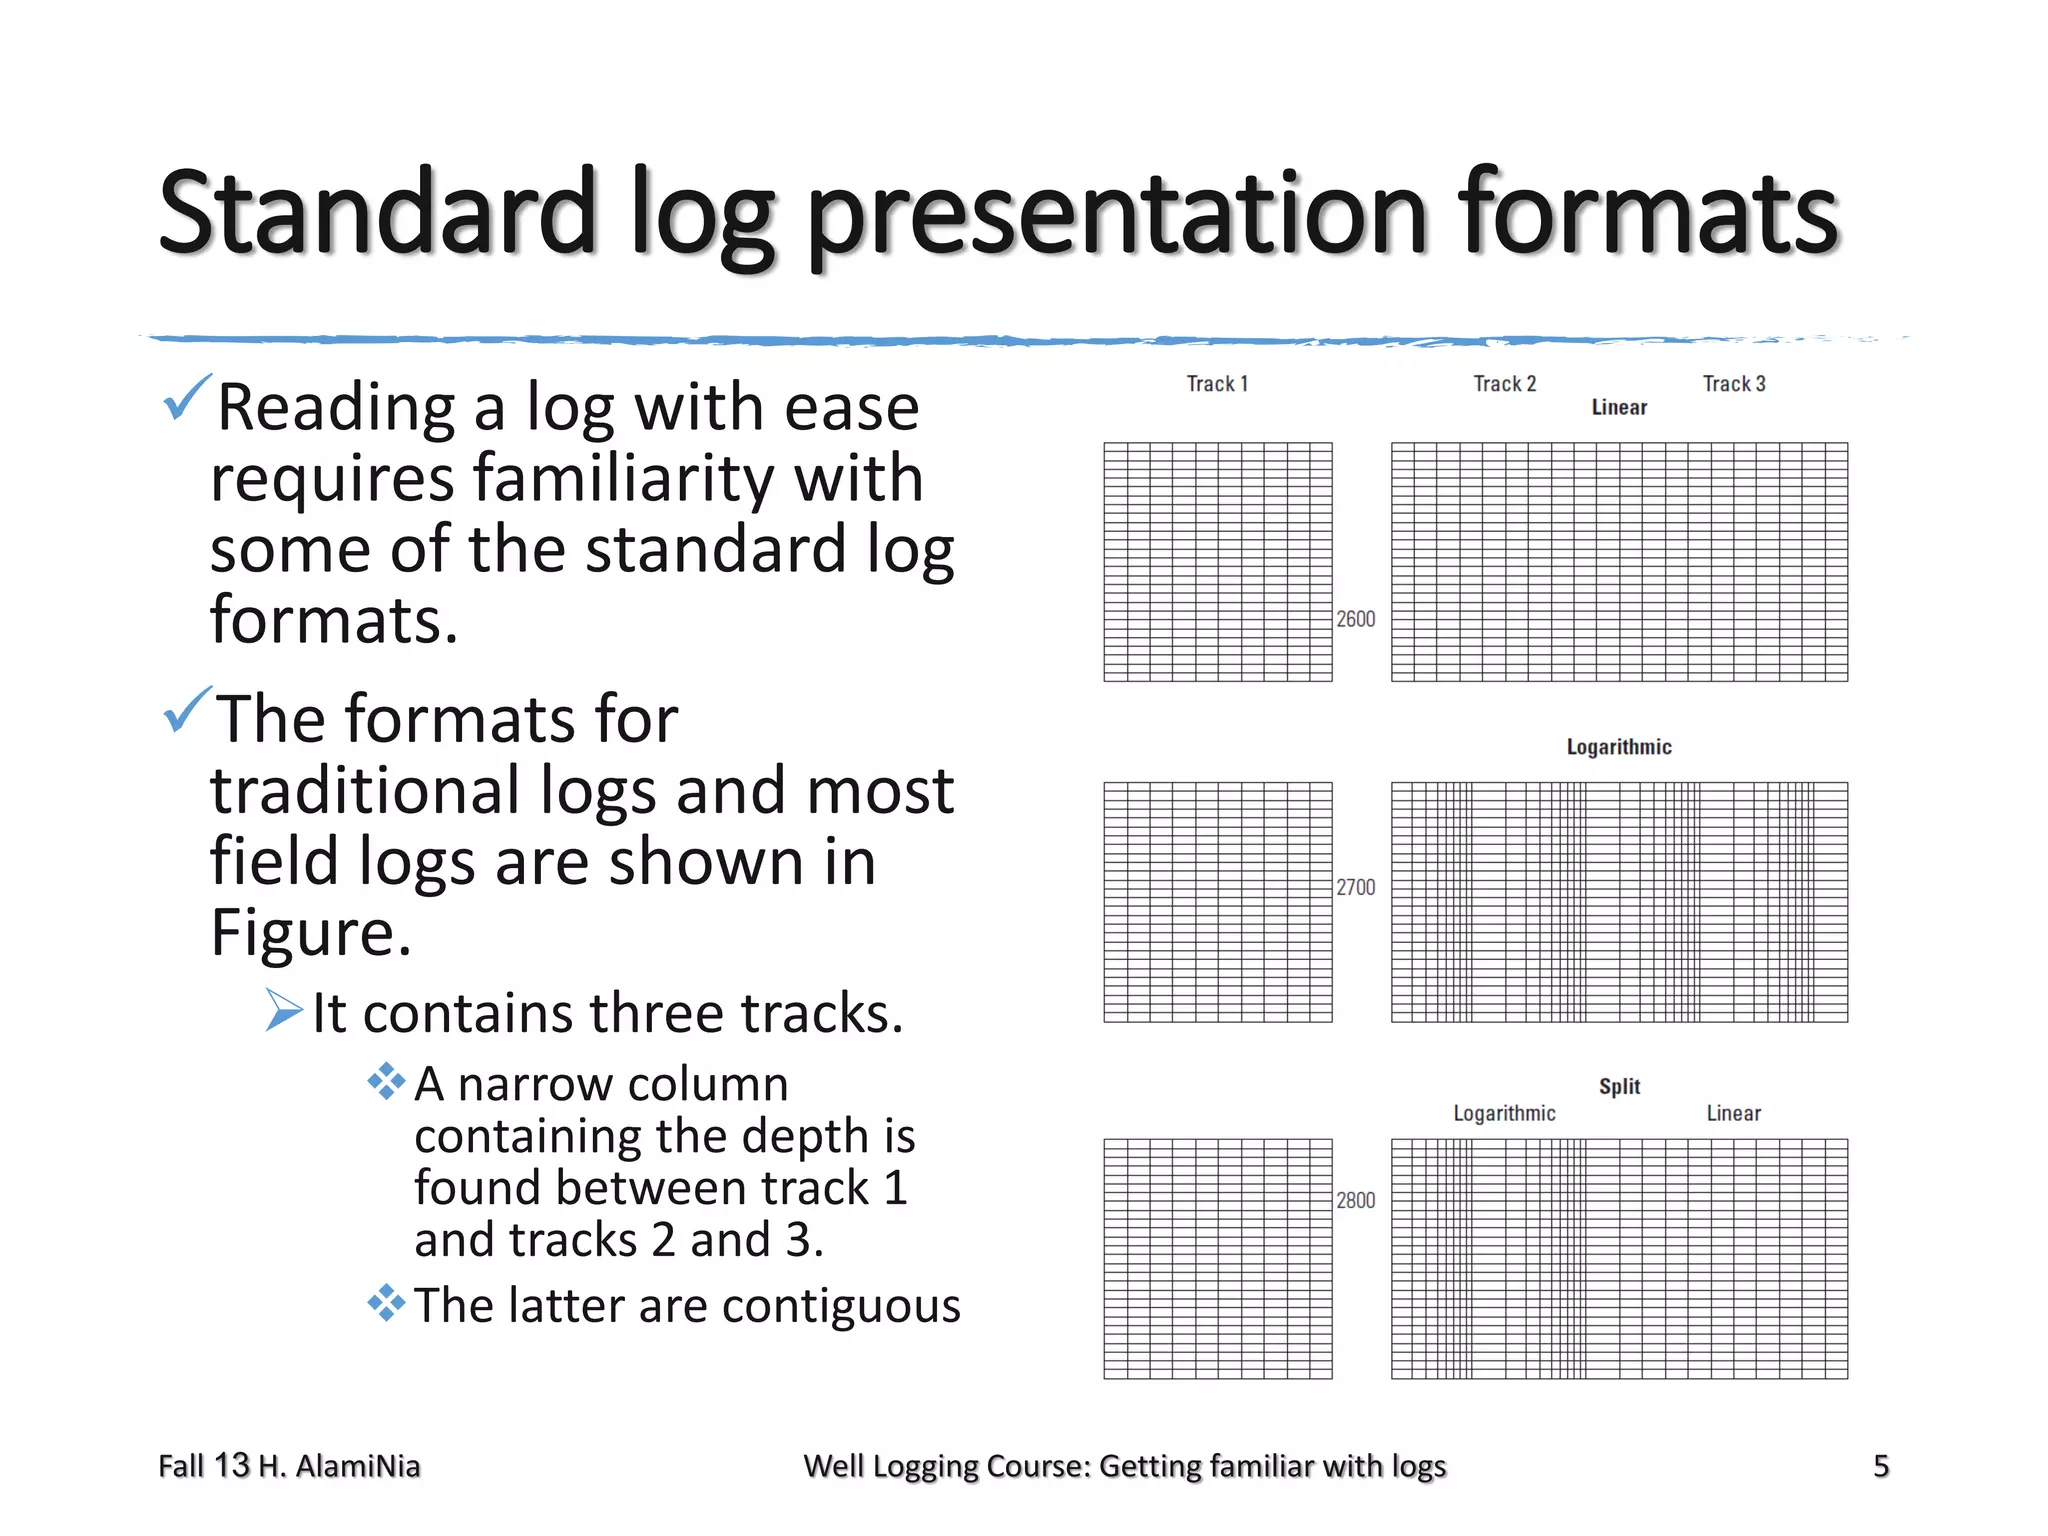
This document provides an overview of well logging concepts and techniques. It discusses key well log formats and presentations, including standard tracks used for depth, resistivity, porosity, and other measurements. Common logs like SP, gamma ray, resistivity, neutron, and density are examined. Signatures indicating lithology, fluid content, and invasion are described. Proper interpretation requires understanding scales, crossovers caused by lithology changes, and matrix effects. An example of logs in a horizontal well is also provided.


