This document discusses using spectroscopic ellipsometry to analyze molecular fractal surfaces through physical adsorption of water and other liquids. It provides background on existing surface adsorption theories and how they have been expanded to account for fractal surfaces. Experimental data is presented on water adsorption measured by ellipsometry on various surfaces like gold, silicon, and germanium. The data is analyzed using modified adsorption models that incorporate the fractal dimension of the surfaces to determine properties like monolayer coverage and surface dimensionality.
![1
Molecular Fractal Surfaces Analysis by Spectroscopic
Ellipsometry
F. Ferrieu*
1
, J. P. Piel**
2
, J. L. Stehlé
2
, A. Danel
3
.
1
STMicroelectronics, 850, rue Jean Monnet, F38926 CROLLES Cédex France.
2
SOPRA-SA 26, rue Pierre Joigneaux, 92270 BOIS-COLOMBES France
3
CEA/LETI Minatec 17 rue des Martyrs 38054 GRENOBLE cedex 9 France.
Received zzz,revised zzz,accepted zzz
Published online zzz
PACS 06.20.-f, 07.60.Fs, 85.40.-e, 67.70.+n,68.03.Fg,
*
Corresponding author:e-mail: frederic.ferrieu@cea.fr , Phone +33 438784056Fax +33438785273
**
e-mail jean-phlippe.piel@sopra-sa.com Phone+33146496700Fax +33 142422934
This paper reports on recent highlights in the application of fractals to surface science. The use of Spectroscopic Ellipsometry
(SE) for emphasizing the surface properties of thin films is simply described. The physical adsorption of water by non-porous
materials, which gives rise to a Type II isotherm and only few studies exists [1], is reported. Our aim is to demonstrate the
application of the surface adsorption optical technique for surface analysis. Some examples are presented and discussed.
1 Introduction During these last years the
Ellipsometry-Porosimetry, (EP), investigation field
has been extensively prospected, [2], leading to
commercial equipments able to analyze the pore size
distribution and density of porous materials such as
for example low k dielectrics. However, in the past
high sensitivity ellipsometry was also used to study
the adsorption of liquids vapors onto solids surface.
The earlier papers from D. Beaglehole, [3], and J.G.
Dash [4] stated most of the physics of the interactive
forces present in the adsorption phenomena between
an adsorbate species and a surface. This important
field of surface science is closely related to similar
phenomena such as wetting, spreading and surface
melting. The extent of adsorption depends on the
strength and range of the potential between substrate
and the adsorbing molecules. Similar effects have
been studied first in the adsorption of gases
phenomena such as clustering and even percolation
transition in He (helium) (wetting) and other thin
films [4]. However in most of these works the surface
morphology has not been specifically considered
assuming that clustering and wetting phenomena are
only driven from the interacting forces between the
substrate and the adsorbing molecule. In the
semiconductor field, the study of surface states is
mandatory in most of the epitaxial or deposition
growth process. One could be aware of the possible
applications which could be developed with this
method in the surface state of thin deposited films,
e.g., in the case of the atomic layer deposition (ALD).
If one considers a silicon wafer substrate with its
native oxide, its surface state can be altered after
specific etching process and following various
treatments, plasma deposition sputtering or ion bias
plasma which yield various intrinsic surface
properties. Furthermore a “composite” surface can be
seen of a patchwork of regions and the control of the
active surface area (ASA) ratio certainly turns a key
parameter. The paper discuss of the level of
understanding of the information which can be
obtained through this technique. As a counterpart of
the other surfaces analysis methods, the optical
technique is non destructive, fast and easy to
implement even on line or in situ. Several parameters
have mainly to be considered, rather often, one only is
retained: i.e., the surface roughness value. It can be:
either mechanical or optical [5]). None of these
approaches fills other surface information requests
such as the Gaussian nature of a random surface or in
a hemispherical or conical quasi periodically
distribution. Here come additional correlation effects,
since the phenomenon is repetitive and self affine, it
has to be described with a fractal dimension. From
AFM data, the surface peak-peak autocorrelation
function H(r) can be seen as:
(1)](https://image.slidesharecdn.com/5c17fc65-91f5-46b7-846b-c2f31418d410-150203050901-conversion-gate02/85/Molecular-Fractal-Surfaces-Analysis-ICSE4-ffvi-1-320.jpg)
![1
Molecular Fractal Surfaces Analysis by Spectroscopic
Ellipsometry
F. Ferrieu*
1
, J. P. Piel**
2
, J. L. Stehlé
2
, A. Danel
3
.
1
STMicroelectronics, 850, rue Jean Monnet, F38926 CROLLES Cédex France.
2
SOPRA-SA 26, rue Pierre Joigneaux, 92270 BOIS-COLOMBES France
3
CEA/LETI Minatec 17 rue des Martyrs 38054 GRENOBLE cedex 9 France.
Received zzz,revised zzz,accepted zzz
Published online zzz
PACS 06.20.-f, 07.60.Fs, 85.40.-e, 67.70.+n,68.03.Fg,
*
Corresponding author:e-mail: frederic.ferrieu@cea.fr , Phone +33 438784056Fax +33438785273
**
e-mail jean-phlippe.piel@sopra-sa.com Phone+33146496700Fax +33 142422934
This paper reports on recent highlights in the application of fractals to surface science. The use of Spectroscopic Ellipsometry
(SE) for emphasizing the surface properties of thin films is simply described. The physical adsorption of water by non-porous
materials, which gives rise to a Type II isotherm and only few studies exists [1], is reported. Our aim is to demonstrate the
application of the surface adsorption optical technique for surface analysis. Some examples are presented and discussed.
1 Introduction During these last years the
Ellipsometry-Porosimetry, (EP), investigation field
has been extensively prospected, [2], leading to
commercial equipments able to analyze the pore size
distribution and density of porous materials such as
for example low k dielectrics. However, in the past
high sensitivity ellipsometry was also used to study
the adsorption of liquids vapors onto solids surface.
The earlier papers from D. Beaglehole, [3], and J.G.
Dash [4] stated most of the physics of the interactive
forces present in the adsorption phenomena between
an adsorbate species and a surface. This important
field of surface science is closely related to similar
phenomena such as wetting, spreading and surface
melting. The extent of adsorption depends on the
strength and range of the potential between substrate
and the adsorbing molecules. Similar effects have
been studied first in the adsorption of gases
phenomena such as clustering and even percolation
transition in He (helium) (wetting) and other thin
films [4]. However in most of these works the surface
morphology has not been specifically considered
assuming that clustering and wetting phenomena are
only driven from the interacting forces between the
substrate and the adsorbing molecule. In the
semiconductor field, the study of surface states is
mandatory in most of the epitaxial or deposition
growth process. One could be aware of the possible
applications which could be developed with this
method in the surface state of thin deposited films,
e.g., in the case of the atomic layer deposition (ALD).
If one considers a silicon wafer substrate with its
native oxide, its surface state can be altered after
specific etching process and following various
treatments, plasma deposition sputtering or ion bias
plasma which yield various intrinsic surface
properties. Furthermore a “composite” surface can be
seen of a patchwork of regions and the control of the
active surface area (ASA) ratio certainly turns a key
parameter. The paper discuss of the level of
understanding of the information which can be
obtained through this technique. As a counterpart of
the other surfaces analysis methods, the optical
technique is non destructive, fast and easy to
implement even on line or in situ. Several parameters
have mainly to be considered, rather often, one only is
retained: i.e., the surface roughness value. It can be:
either mechanical or optical [5]). None of these
approaches fills other surface information requests
such as the Gaussian nature of a random surface or in
a hemispherical or conical quasi periodically
distribution. Here come additional correlation effects,
since the phenomenon is repetitive and self affine, it
has to be described with a fractal dimension. From
AFM data, the surface peak-peak autocorrelation
function H(r) can be seen as:
(1)](https://image.slidesharecdn.com/5c17fc65-91f5-46b7-846b-c2f31418d410-150203050901-conversion-gate02/75/Molecular-Fractal-Surfaces-Analysis-ICSE4-ffvi-1-2048.jpg)
![2
ω is the roughness and ξ , a lateral correlation
length. The fractal surface dimension D appears in α,
since α=3-D .
The XRR and small angle Neutron Scattering,
(SANS) techniques also yields the H(r) surface
correlation function. The AFM also correlates the
scanned surfaces with the Power Spectral density
(PSD) of the diffracted haze light. In none of these
methods, the ratio of ASA, (active surface area),
which is the ratio of possible partially cluster-patched
surface areas, can be given. By studying surface
states, means to observe how a specific molecular
species (the adsorbate) will probe the surface itself
(the adsorber). As a counterpart the adsorber surface
information is deduced. The weak inlet of adsorbate
molecule in the low pressure chamber is controlled
within a rate varying between zero (p ~ mTorr)) until
reaching the saturation pressure p=ps., i.e., the vapor-
liquid condensation limit The bonding characters
between adsorbate molecules or atoms with the
adsorber substrate are mainly due to dipole-dipole
interactions often modeled with van der Waals force.
Main studies with gases were performed at low
temperature since the temperature of the surface
Tsurface must yield an energy U ( kb Tsurface < +/-10 U)
less than the binding energy U of the dipole and its
image in the plane of the substrate.,(kb is the
Boltzmann constant). Adsorbate molecules can exist
in a number of different phases. Phase transition to 2-
D multi layer fluid where there are no bondings to
particular substrate site form a “registered” or
commensurate structure that could be observed. The
signature of this effect should be expected and be
seen as small “bumps” in the isotherm curve [4].
From the experimental point of view, with a gas ,
samples have to be chosen with a large adsorptive
area capacity. As a contrary, several monolayers films
of small organic molecules like methanol, ethanol,
(Eth), benzene, Iso Propyl Alcool, (IPA) and
therefore H2O, can be detected with in situ
ellipsometry. The technique is in fact one of the most
sensitive instruments to this purpose. Previous
measurements were already reported [6]. The attempt
here is to summarize them first and to show the
potential issues of this technique. This paper refers
also to new measurements since the availability of the
(EPA) Ellipsometer Porosimeter Atmospheric system
from SOPRA.SA [7], depicted in the following
scheme (fig. 1). The EPA system has been designed
in order to realize easy porosimetry measurement in
the case of water H2O in N2 diluted in an atmospheric
pressure cell at room temperature.
2The BET, FHH Surfaces Adsorption Theories.
Two former theories exists the so-called BET
(Brunauer, Emmet et Teller) equations for a flat
surface (1938). From the equilibrium between the
two rates of evaporation and condensation on the
surface of the adsorber, Brunauer, Emmet and Teller
built the following equation
(2)
Here, the V, Vm are volumes corresponding
respectively to the surface volume on the adsorber
and the monolayer volume Vm also called the
monolayer coverage capacity. The pressure p is a
partial pressure ps The BET coefficient Cm, is
related to the surface energies, (interaction between
adsorbate and adsorber and also between adsorbate
molecules themselves), is obviously thermally
activated with a monolayer capacity coefficient Cm~
exp-∆E/kBT . The BET equations were established
considering only a plane surface. Beside these
classical BET equations, other theories of surface
energy interactions emerged later in 1948, referred as
the FHH theory. The multi layers build up by water
adsorption on a clean surface at low partial pressure
comes from the interface intensity (and the nature) of
long, (London (LD) forces)), or short (Debye and
Keesom interactions) range forces between the water
molecule and the analyzed surface. The answer to
their intensity could be extracted from the isotherm
data. When the water film thickens beyond two or
three monomolecular layers, previous theories should
fail since one has to analyze the isotherm by reference
to all present surface forces including adsorbate
interactions. The physical H2O vapors adsorption on
chemically cleaned Si surfaces at constant
temperature (25°C), was studied by Archer [8] as
function of the relative humidity, by ellipsometry.
With hydration these surfaces become hydrophilic
whereas etched, polished, they turn to a more
hydrophobic behavior. Other measurements were also
reported on quartz surfaces showing the high
sensitivity of the method to very low
contaminations.[9]. More recently, H.Arwin et al, [1]
considered the Halsey general form when the t-curve
on oxidized planar silicon is measured and recognized
the London dispersion force as the main mechanism
involved in the adsorption of water on silicon.
2.1The BET Modified Multilayer Adsorption
Model on a Fractal Surface. The fractal theories
from the mathematician B. Mandelbrot [10] were then
extensively developed since the 1980 years
particularly most of the surface physical sciences
topics. The fractal theory for a self affine surface is an
extent of the basic relation where n is the
number of time the use of the metric r is
accomplished to get, (and therefore to measure), the
area of a fractal object with dimension D, but here the
metric correspond to one molecule size here.
Developments proposed and applied only with gases
adsorbate. [13-15], give a more clear view of the](https://image.slidesharecdn.com/5c17fc65-91f5-46b7-846b-c2f31418d410-150203050901-conversion-gate02/85/Molecular-Fractal-Surfaces-Analysis-ICSE4-ffvi-2-320.jpg)
![3
adsorption by considering fractals surfaces and
reviewing the previous BET formalism [16]
The FHH equations were analysed following
the surface dimensionality D introduced when
considering the surface fractal character [13]. In the
case of the two theories (BET and FHH), the number
of the molecules needed to cover entirely the surface
is correlated with the surface fractal dimension itself.
The attractive van der Waals force potential, (mostly
from long range order London (LD) interaction for a
non polar adsorbate), wants to make the film-vapor
interface to follow up and down the surface as closely
as possible whereas, the surface free potential energy
of the film (surface tension capillary forces) wants to
make the film vapour interface as flat as possible.
Early fractal analyses emphasize the fact that when a
surface is scale invariant, (self affine), the number of
molecules of same size a in the range required to
cover the surface with a monolayer is
where D is the surface fractal dimension with
(2<D<3) and C, the Hausdorf metric of the surface.
Data can then be analyzed through the fractal
generalization of the FHH isotherm. The measure of
the film thickness, probes the geometry of the surface
over this range of scales. In the FHH case, the number
of adsorbed molecules N and the monolayer coverage
Nm turns to be related to the fractal dimension through
the Minkowski dimension factor
in this equation with The ξp is a metric
according to the partial pressure . In the
second BET fractal theory, [13], the model takes into
account the multilayer filling along a Koch curve
[10]. One get the fractal dimension D from α, but also
the other corrected BET parameters, i.e., Cm (BET
constant), a function of both adsorbate and adsorber, a
function of temperature T, as well and with Vm the
monolayer coverage and the partial pressure
one has:
(3)
Finally, very recent works [16], have shown that
surface adsorption could be also described adding
several contributions of composites n aggregates with
respective density θι, i=1,.n seen as a weighting
distribution of the different active surface areas.
3.Nanotechnology materials As a test from these
theories, several preliminary measurements were
carried out with a low pressure Ellipsometer
Porosimeter (EP). These are only for demonstrative
purposes since, many recommendation, as given here
previously have not been thoroughly fulfilled. The
data have been acquired with both systems:i)the
ambient Water (H2O) adsorption technique and ii)a
low pressure analysis ellipsometric cell with inlet of
organic solvents like ethanol alcohol (Eth) and Iso-
Propyl Alcohol,(IPA). The temperature is somewhat
lower maintained at 15°C, instead of the room
temperature with the EPA experiments with a higher
temperature in the range 24-25°C. With EP,
measurements were from few milliTorr, (mTorr)
reaching to the saturation pressure Ps (10-30Torr).
The water adsorption system (EPA patented) is
commercially available. [7], it is much easier to
mount on the attachment of a spectroscopic
ellipsometer. A schematic is shown in the figure 1
Figure 1. Scheme of the experimental ellipso-porosimeter
Several examples will follow hereafter to demonstrate
the use of equation (3) and then the interest of the
technique. Let us remind as general rule for fitting in
equation (3), that the C parameter takes effect only in
the low partial pressure region (or low R.H.), whereas
the behavior is dominated by )1log( p−α as p
approaches unity (or 100%R.H.).A first comparison
can be done as shown in Figure 2.
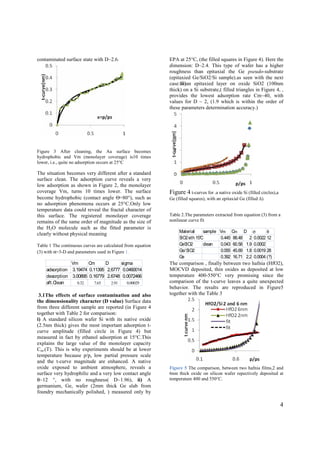
Figure 2 Comparison between adsorption and desorption
process with their respective t-curves (nm),
(adsorbed/desorbed) layer H2O thickness versus %R.H.
The Figure 2 shows the t-curve, (adsorbate multilayer
thickness t, during an adsorption and desorption
cycle, layer thickness versus x the partial pressure
x=p/ps, i.e., for H2O, R.H(% percent relative
humidity in a dry N2 ), in the case of an air-
contaminated gold surface covered a silicon wafer
(Au), film 50nm-thick film).It reveals a very](https://image.slidesharecdn.com/5c17fc65-91f5-46b7-846b-c2f31418d410-150203050901-conversion-gate02/85/Molecular-Fractal-Surfaces-Analysis-ICSE4-ffvi-3-320.jpg)
![5
Table 3 fitted parameters in the case of HfO2 high k
materials ,σ is a fit mean square error (mse) and θ is the
measured contact angle
ID Vm Cm D σ θ
HfO2 2nm 0.772 0.128 2.402 0.003 q < 20
HfO2 6nm 0.924 2.62 2.999 0.001 66
These isotherms are clearly different demonstrate that
a drastic change in the surface properties occurred. If
the thinner sample (2nm-thick), has a quite classical
behavior, the 6nm-thick HfO2 film shows a definite
tri dimensional character possibly more seen as a
volume than as a surface adsorption. This indicates
the presence of open micro porosity in the film. To
our knowledge, this assumption has not been yet
verified. Both the contact angle, the monolayer
coverage and monolayer capacity increase,( Table 3).
4Conclusions. With the high sensitivity of today’s
SE instruments, the fractal surface analysis appears as
a new potential development orientation to
characterize in a near future, a surface, modification
during a process,( etching, plasma, epitaxial films,..).
The basic system remains an adsorbate versatile, low
pressure, temperature controlled in situ SE
ellipsometer. However, to another extent, the use of
water molecule as adsorbate with an refined version
of the actual atmospheric water adsorption system
EPA is an easy method in the case of many inert
hydrophilic surfaces of the nanotechnology
References:
[1] C. Wongmanerod, S. Zangooie, H. Arwin, Appl.
Surf. Sci. 172,117(2001)
[2] M. R. Baklanov et al, JVST B.18, 3, 1385 (2000).
[3] D. Beaglehole, Physica A, 244, 40 (1997)
[4] J. G. Dash, Phys. Rev. B, 15, 3136(1977)
[5] R. M. A. Azzam and N. M. Bashara in Ellipsometry
and polarized light, edited by N.H. Elsevier,
Amsterdam, (1996).
[6] G. Simon and F. Ferrieu Poster 74, 4th Workshop
Ellipsometry Berlin,20-22 February 2006
http://www.ake.bam.de
[7] www.sopra-sa.com.
[8] ref[7] pp. 435.
[9] R. M. Ashley and J.A. Kitchener J. Colloid and
Interface Science, 71, 491 (1979).
[10] B. B. Mandelbroot in The Fractal Geometry of
Nature, edited by Freeman San Francisco,1982)
[11] P. Pfeifer and Y. J. Wu , et al, Phys. Rev. Letters
62,17, 1997-2000(1989).
[12] D. Avnir, D. Farin and Peter Pfeifer, Nature,
308,261(1984).
[13] M. Mahnke and H. J. Mögel Colloids and Surfaces
A, 216, 315(2003)
[14] J. J. Fripiat, L. Gatineau and H. Van Damme
Langmuir 2,562 (1986)](https://image.slidesharecdn.com/5c17fc65-91f5-46b7-846b-c2f31418d410-150203050901-conversion-gate02/85/Molecular-Fractal-Surfaces-Analysis-ICSE4-ffvi-5-320.jpg)


