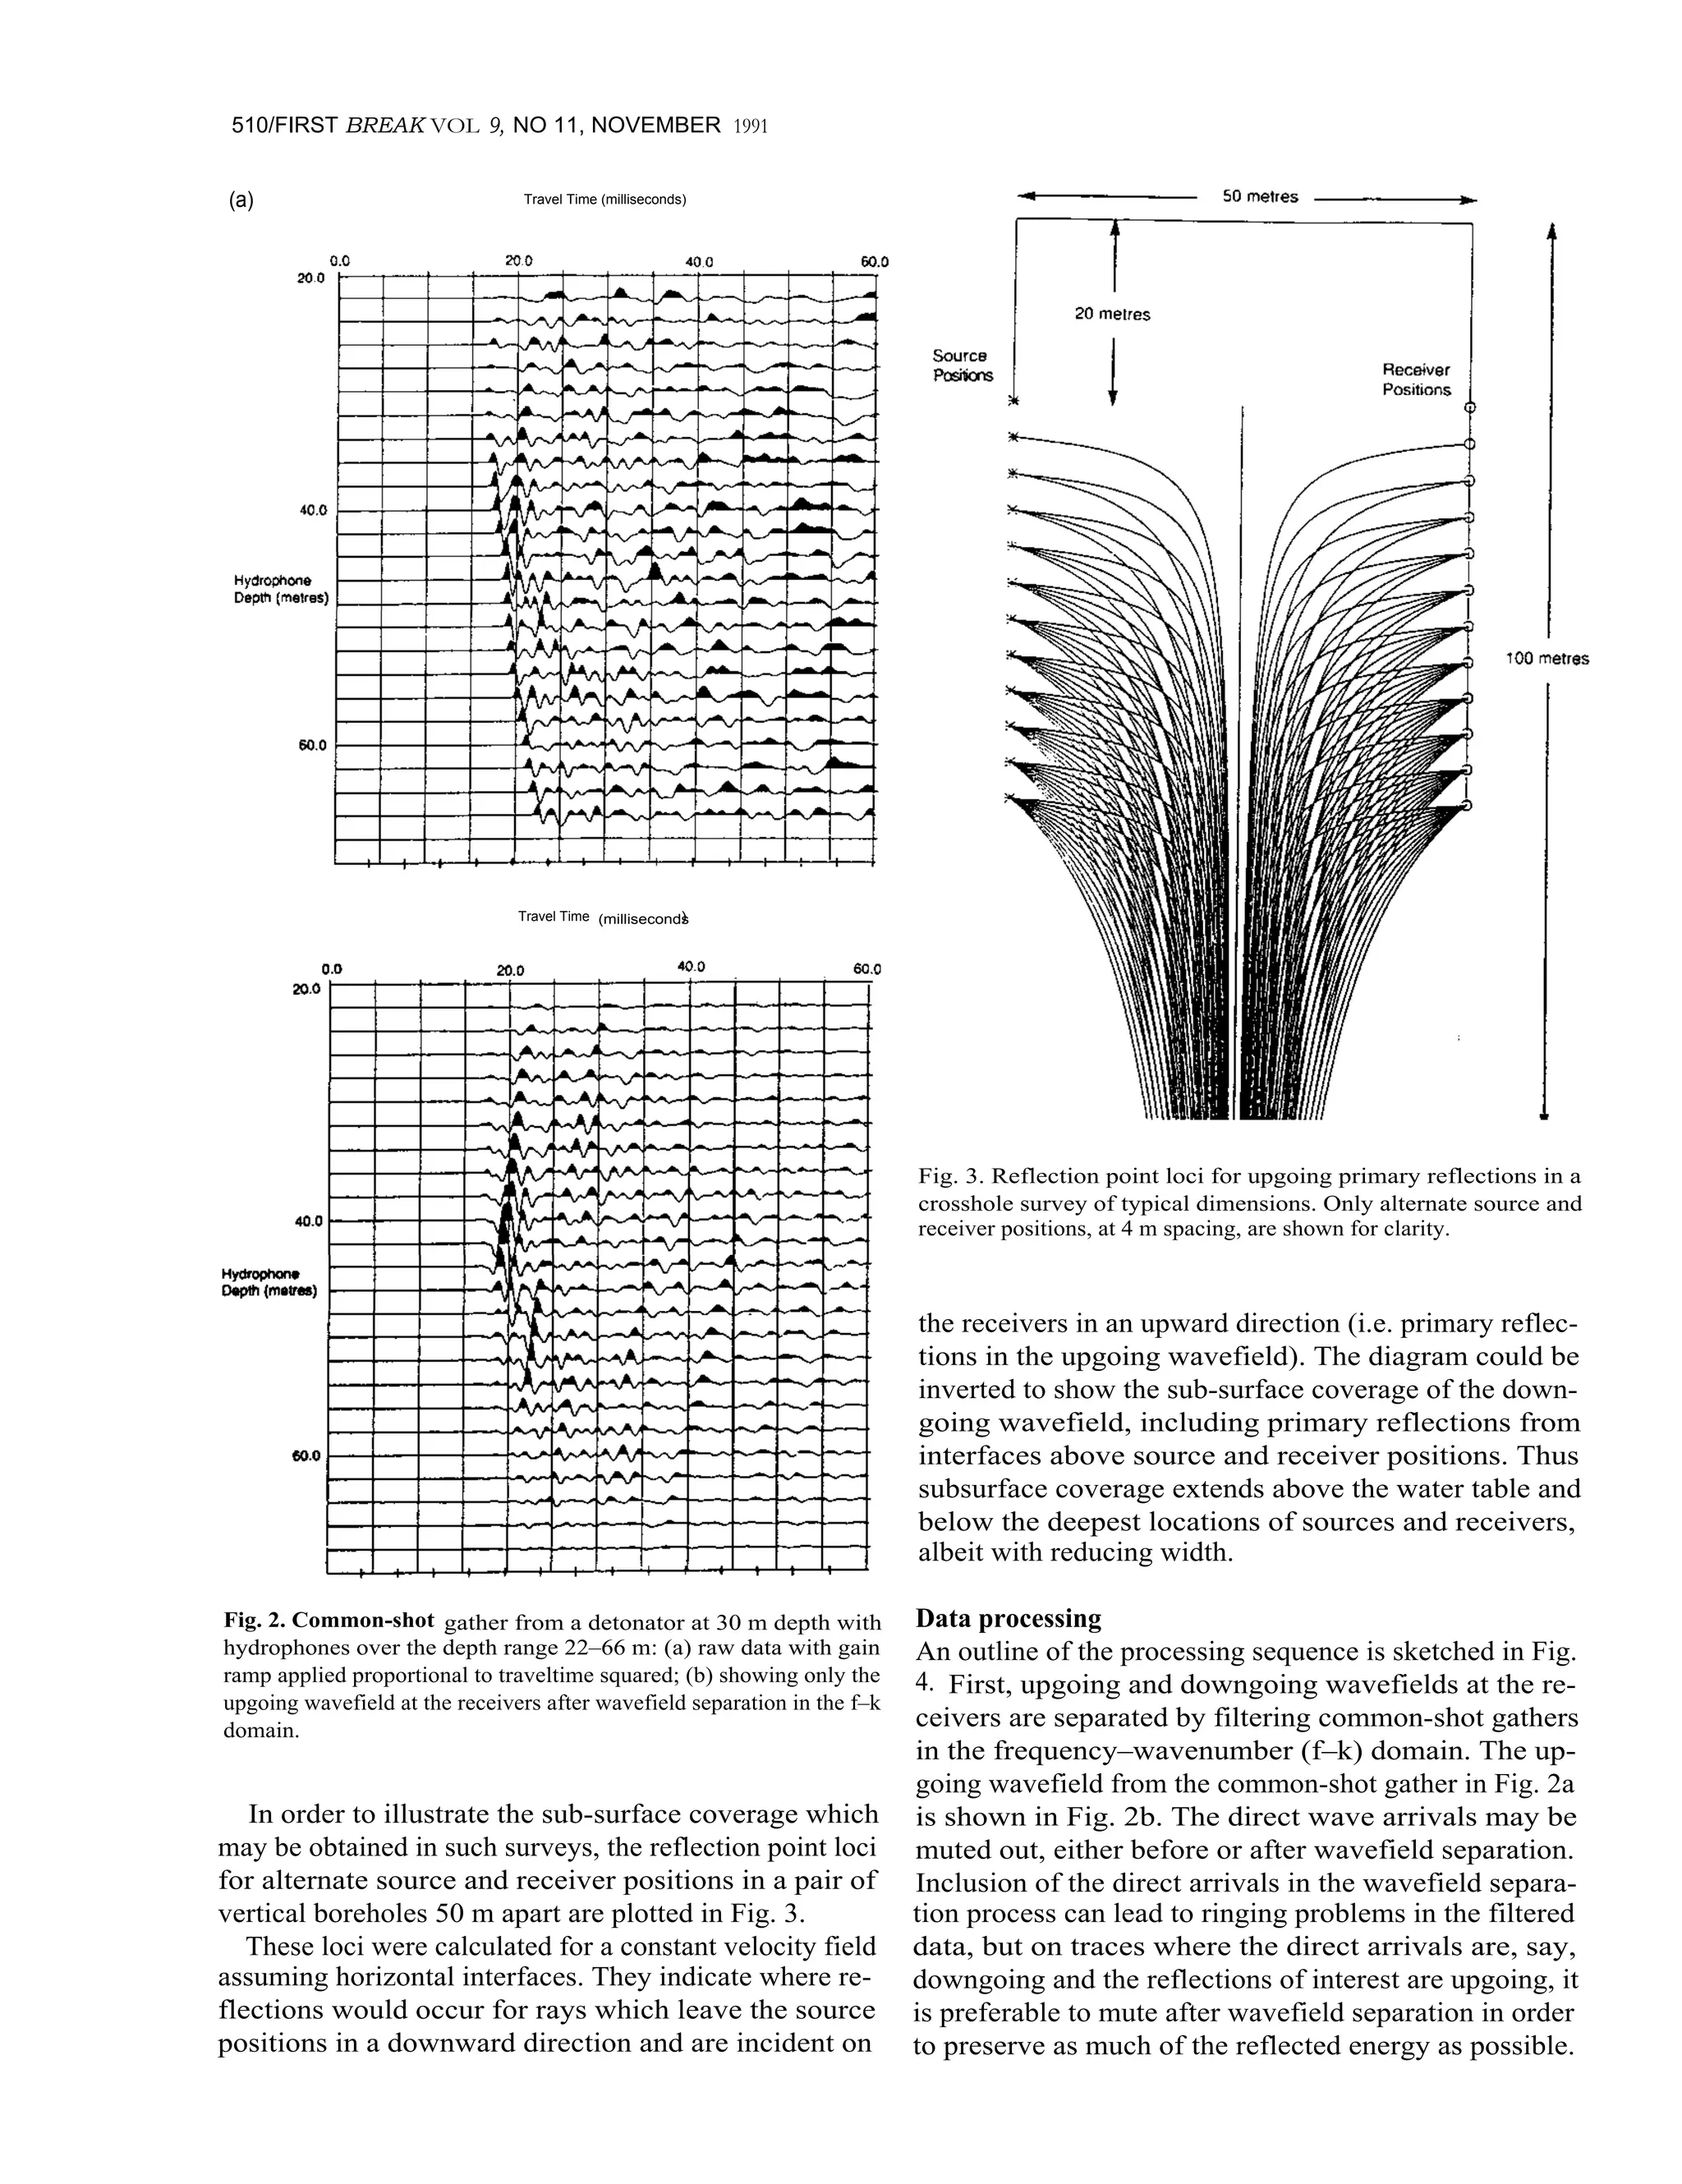
The document summarizes research on using crosshole seismic reflection methods for opencast coal exploration. Small explosive charges are used as sources in one borehole, while hydrophones in a nearby borehole record seismic reflections. This provides high-resolution seismic sections between boreholes. Results from two UK coal sites image coal seams and detect small faults not seen with sparser surface exploration methods. While velocity modeling is challenging, the method can locate hazards for excavation and improve reserve estimates compared to traditional borehole spacing.
This document provides an overview of well logging concepts and techniques. It discusses standard log presentation formats, different scale types, and log headings for common logs like SP, GR, resistivity, neutron, and density. It provides examples of using these logs to identify clean zones, determine fluid types, and detect hydrocarbons. Key electrical properties like resistivity and spontaneous potential are also explained. The document is intended to familiarize readers with reading well logs and understanding the information they provide.
The document provides an overview of well logging techniques. It discusses the history and evolution of well logging from early resistivity measurements to modern tools. It describes the key components of well logging including the sonde, wireline, and surface truck. Well logging provides continuous subsurface measurements to evaluate reservoirs and supplement data from cores and cuttings. Measurements are used to characterize porosity, fluid saturation, and other reservoir properties important for development.
SUBMERGED HORIZONTAL PLATE FOR COASTAL RETREATING CONTROL: THE CASE OF POLIGN...marmar83
Many sites along the Apulian coast (SE Italy) are composed of weathered and fractured carbonate rocks, affected by intense erosion and frequent sliding. A detailed research of the University of Bari (Andriani and Walsh, 2007) highlighted that from 1997 through 2003, the cliff retreat rate varied from 0.01 to 0.1 myr-1, mostly as a consequence of wave action. In the case of Polignano a Mare, a small town 30 km far from Bari, the erosive process seems to be seriously affecting the stability of buildings. Here, because of the bathymetry, the traditional rubble mound breakwaters are not suited. As an alternative, a rigid horizontal submerged plate on piles is here considered. Since there is no universally accepted theory nor formula to calculate the hydraulic performance of such kind of structure physical models have been constructed at HR Wallingford and subjected to random wave attacks. This paper discusses results of those tests.
Seismic data Interpretation On Dhodak field PakistanJamal Ahmad
I (Jamal Ahmad) presented this on 21 Feb, 2009 to defend my M.Phil dissertation in Geophysics at QAU, Islamabad, Pakistan. For more information about this, you may contact me directly at jamal.qau@gmail.com.
What do you means by seismic resolutionHaseeb Ahmed
Seismic resolution refers to the ability to differentiate between two seismic features. Vertical resolution is the ability to resolve two vertically stacked seismic horizons, and depends on factors like frequency and wavelength. Higher frequencies and shorter wavelengths improve vertical resolution but are attenuated at greater depths. Lateral resolution is the ability to resolve two horizontally separated features, and depends on factors like frequency, velocity, aperture, and whether pre-stack or post-stack migration is used. Both vertical and lateral resolution decrease with depth due to attenuation of higher frequencies. Increasing bandwidth, using phase rotation techniques, and migration can help enhance seismic resolution.
1. AVO inversion and processing of seismic data from the Penguin Field was challenging due to noise in the data and lack of clear AVO trends.
2. Pre-stack diagnostics identified issues like residual moveout and multiples that were addressed through additional processing steps.
3. Post-stack diagnostics on near, mid, and far stacks helped assess whether the data obeyed expected AVO behavior needed for inversion.
4. Inversion results for properties like Vshale, porosity, and net-to-gross ratio showed improved detail compared to original reservoir models.
The document discusses several types of seismic velocity models including 1D layered models, community velocity models based on direct measurements, unified community models, and 3D tomography models derived from active and passive seismic data. It provides details on numerous global and regional reference models for the crust, mantle, and specific tectonic provinces.
This document provides an introduction to seismic interpretation. It begins with an overview of seismic acquisition methods both onshore and offshore. It then discusses key concepts in seismic data such as common depth points, floating datum, two-way time, and the relationship between time and depth. The document also covers seismic resolution, reflection coefficients, and examples of calculating tuning thickness. Finally, it discusses important steps for seismic interpretation including checking the line scale and orientation and interpreting major reflectors and geometries.
The document provides an overview of spontaneous potential (SP) well logging. It discusses the origins of SP, including liquid junction potentials and membrane potentials generated by shale. SP can be used to identify permeable zones and determine formation water resistivity. Factors like shale content, oil/gas saturation, borehole conditions, and invasion can impact the SP response. Examples are given of idealized SP curves in different logging scenarios.
The oxford dictionary defines an attribute as, “a quality ascribed to any person or thing”. We have extended this definition to: “seismic attributes are all the information obtained from seismic data, either by direct measurements or by logical or experience based reasoning
In reflection seismology : aseismic attributes is a quality extracted or derived from seismic data that can be analyzed in order to enhance information that might be more subtle in a traditional seismic image , leading to a better geological or geophysical interpretation of the data
Over the past decades, we have witnessed attribute developments track breakthroughs in reflector acquisition and mapping, fault identification, bright spot identification, frequency loss, thin bed tuning, seismic stratigraphy.
Towards the identification of the primary particle nature by the radiodetecti...Ahmed Ammar Rebai PhD
This document summarizes a study using the CODALEMA experiment to analyze radio signals from air showers and identify properties of primary cosmic ray particles. It describes:
1) Analyzing time delays of radio signals compared to a plane wavefront hypothesis and finding systematic deviations, indicating the wavefront is curved.
2) Developing a model to reconstruct the emission center position based on fitting time delays to a parabolic function dependent on curvature radius and antenna distances.
3) Applying the model to 450 selected CODALEMA events and comparing reconstructed shower core positions to results from other models, finding consistency.
The document provides an overview of well logging techniques and concepts. It begins by discussing spontaneous potential logs and how they were an early application for measuring formation resistivity. It then covers the foundational work of Leverett and Archie in empirically determining relationships between resistivity, porosity, and water saturation. Their work allowed resistivity measurements to be quantitatively interpreted in terms of water saturation. The document concludes with examples of using the Archie equations and understanding factors like cementation exponent to interpret resistivity logs.
The document presents a new technique called Full Spectrum Inversion (FSI) for analyzing radio occultation signals. FSI uses a Fourier transform of the entire occultation signal to determine the arrival times and frequencies of different signal components. This provides high vertical resolution and can disentangle signals in multipath regions. The method works by assuming the Fourier transform can be evaluated using the method of stationary phase. This allows the Fourier spectrum to be interpreted as the instantaneous frequencies contained in the signal. The arrival times are then found by taking the derivative of the Fourier transform phase. FSI is demonstrated to work for idealized occultation signals, and its performance is assessed using simulated signals.
1) The document discusses which seismic attributes are most useful for quantitative seismic reservoir characterization. It analyzes attributes such as zero phase amplitude, relative impedance, and absolute impedance.
2) The conclusion is that an absolute impedance inversion provides the best attribute in theory but is difficult in practice. A relative impedance inversion, which is easier to generate, works nearly as well for characterization.
3) Key advantages of relative impedance over zero phase amplitude include relating to geology rather than just impedance contrasts, and allowing comparison between seismic datasets and well logs after appropriate scaling. However, relative impedance lacks low frequency content included in absolute impedance.
This document provides an overview of well logging concepts and techniques. It discusses key well log formats and presentations, including standard tracks used for depth, resistivity, porosity, and other measurements. Common logs like SP, gamma ray, resistivity, neutron, and density are examined. Signatures indicating lithology, fluid content, and invasion are described. Proper interpretation requires understanding scales, crossovers caused by lithology changes, and matrix effects. An example of logs in a horizontal well is also provided.
12 Week Subsurface Mapping And Interpretation Technique Buildingjoedumesnil
The document summarizes a 12-week subsurface mapping and interpretation course. It covers laying the theoretical foundations for exploring and developing oil and gas fields. The first 6 weeks were devoted to classes on structural geology, stratigraphy, seismic techniques and reservoir engineering. The second 6 weeks focused on applying these tools to a hypothetical lease, including initial exploration, assessing discoveries, field development and performance analysis. Various mapping and interpretation techniques are demonstrated, such as depth structure maps, fault surface maps, isochore maps and seismic sections. Risk factors are assessed for a proposed deviated exploration well.
Seismic interpretation involves correlating seismic data features with geological elements to understand the subsurface. The goal is to map reservoirs, including depth, thickness, and properties. This involves processing data, well calibration, horizon and fault tracking, and attribute analysis. Direct hydrocarbon indicators on seismic can help identify potential reservoirs, but require validation with amplitude versus offset analysis due to limitations and need for a geological model.
Correction of ionospheric distortions in low frequency interferometric SAR da...grssieee
This document discusses methods for correcting distortions caused by the ionosphere in low frequency synthetic aperture radar (SAR) interferometric data. The ionosphere can cause displacement and defocusing in SAR images. The authors propose estimating the total electron content (TEC) and its spatial variation to model ionospheric distortions. They develop approaches using full-band and sub-band interferograms to estimate azimuth shifts and correct for ionospheric phase screens. Simulation results demonstrate the effectiveness of their correction methods, especially when using multiple sub-bands and increasing the number of looks, though this reduces spatial resolution. The authors conclude sub-band methods provide finer structure of the ionosphere compared to full-band approaches.
Reservoir Geophysics : Brian Russell Lecture 2Ali Osman Öncel
This document discusses Amplitude Variation with Offset (AVO) techniques and impedance inversion methods. It covers the basics of AVO modeling using the Zoeppritz, Aki-Richards, and Fatti equations. The key methods are described, including intercept-gradient analysis and modeling AVO classes. Examples are provided to illustrate modeling reflections from wet versus gas sands and comparing the different AVO modeling approaches.
This document provides an overview of geophysical data analysis and seismic wave theory. It defines key terms like body waves, surface waves, reflection, refraction, and diffraction. Body waves include compressional P-waves and shear S-waves, while surface waves are Rayleigh and Love waves. Reflection, refraction, and diffraction occur when seismic waves encounter interfaces between layers with different velocities. Multiples and ghosts are examples of phenomena that can complicate seismic data analysis if not properly handled. The document aims to give theoretical background knowledge needed to understand seismic data.
This document discusses the interpretation of raw seismic records obtained on land and at sea.
On land records, direct waves, refracted waves, surface waves, and reflections can be observed and used to estimate velocities and depths. At sea, direct waves, refracted waves, reflections, and multiple reflections are typically observed.
The document analyzes sample land and marine seismic records, identifying events such as refractions, surface waves, air waves, and reflections. Simple models are presented to explain the major events observed on the raw records. Fourier transforms are mentioned as a way to separate different events.
This document provides an overview of principles of seismic data processing. It discusses key concepts like seismic generation, data processing steps, velocity analysis, noise attenuation techniques, and common processing flows. The document is divided into multiple chapters that cover topics such as wave propagation, reflection coefficients, deconvolution, F-K transforms, and factors that affect seismic amplitudes. Specific noise types like swell noise are also explained and methods to attenuate them, such as using band-pass filters or amplitude/frequency filters, are described.
Avo ppt (Amplitude Variation with Offset)Haseeb Ahmed
AVO/AVA can physically explain presence of hydrocarbon in the reservoirs and the thickness, porosity, density, velocity, lithology and fluid content of the reservoir of the rock can be estimated.
The document describes seismic interpretation workflows, including conventional and unconventional techniques. Conventional techniques involve horizon interpretations, fault picking, and tying seismic data to well logs to understand subsurface geology. Unconventional techniques analyze seismic attribute variations like amplitudes to identify hydrocarbon indicators. The workflow includes generating synthetics from well logs, interpreting horizons on seismic sections, identifying structures like faults and gas chimneys, and determining direct hydrocarbon indicators.
Multi-Resolution Analysis: MRA Based Bright Band Height Estimation with Preci...Waqas Tariq
A method for reconstruction of cross section of rainfall situations with precipitation radar data based on wavelet analysis of Multi-Resolution Analysis (MRA) which allows extract a peak of the radar reflectivity is proposed in order to detect bright band height. It is found that the bright band height can be estimated by using the MRA with the basis of Daubechies wavelet family. It is also found that the boundaries in rainfall structure can be clearly extracted with MRA.
This document provides information about well logging techniques and applications of resistivity measurements. It discusses both unfocused and focused electrode devices, as well as microelectrode devices with very small electrode spacings. Some key uses of measurement of invaded zone resistivity (Rxo) discussed include estimating formation porosity, identifying movable oil, determining residual hydrocarbon saturation, providing hydrocarbon indication, and dipmeter measurements to determine bedding orientation.
This document presents a research project on designing a microwave radio link between six cities in Peru - Lonya Grande, Ortiz Arrieta, Pion, Santa Rosa, Cococho, and Calpon. It discusses the theoretical concepts needed for microwave radio link design such as antennas, propagation effects, diffraction, and link equations. The objectives are to apply knowledge from class to efficiently connect the cities while considering Peru's rugged geography. Google Earth and Radio Mobile software will be used to configure specific connections, identify optimal routes, and solutions.
This document provides an overview of well logging techniques, beginning with early electrical logging tools like the short normal device. It discusses the shortcomings of these unfocused devices in dealing with conductive borehole mud and thin resistive beds. Later sections describe the development of focused devices like the Laterolog, which aim to force current into the formation and reduce borehole effects. These include the Laterolog-3 with guard electrodes and Laterolog-7 with additional monitoring electrodes to further improve current focusing.
Lateral resolution and lithological interpretation of surface wave profi lingAdam O'Neill
This document summarizes research on using surface wave profiling to characterize near-surface geology. It discusses issues with lateral resolution when imaging subsurface features like sinkholes. Numerical modeling of a sinkhole in buried hard rock shows that wider sinkholes are resolved better than narrow ones. Field data from Western Australia that combines surface wave and electrical resistivity data illustrates improved lithological interpretation when both methods are used. The researchers investigate ways to enhance lateral resolution, such as using non-linear geophone spacing. They also demonstrate data-driven classification of rock types based on resistivity and shear wave velocity measurements.
Induction logging is a method to measure the resistivity or conductivity of geological formations surrounding a borehole. It works by transmitting an alternating current from a coil, which induces eddy currents in the formation. These currents are then detected by a receiver coil to provide measurements of apparent conductivity. Interpretation of induction logs can help determine lithology, fluid saturation, and locate hydrocarbon-bearing zones. The key advantage is that it does not require direct contact with the borehole mud or formations, making it useful for wells drilled with oil-based muds.
Towards the identification of the primary particle nature by the radiodetecti...Ahmed Ammar Rebai PhD
To contact the author use ahmed.rebai2@gmail.com
Radio signal from extensive air showers EAS studied by the CODALEMA experiment have been detected by means of the classic short fat antennas array working in a slave trigger mode by a particle scintillator array. It is shown that the radio shower wavefront is curved with respect to the plane wavefront hypothesis. Then a new fitting model (parabolic model) is proposed to fit the radio signal time delay distributions in an event-by-event basis. This model take into account this wavefront property and several shower geometry parameters such as: the existence of an apparent localised radio-emission source located at a distance Rc from the antenna array of and the
radio shower core on the ground. Comparison of the outputs from this model and other reconstruction models used in the same experiment show: 1)- That the radio shower core is shifted from the particle shower core in a statistic analysis approach. 2)- The capability of the radiodetection method to reconstruct the curvature radius
with a statistical error less than 50 g.cm−2 . Finally a preliminary study of the primary particle nature has been performed based on a comparison between data and Xmax distribution from Aires Monte-Carlo simulations for the same set of events.
Sinkhole Seismic Reflections: Coal Mine FieldsAli Osman Öncel
This document summarizes a study using high-resolution seismic reflection to detect voids in a 0.6m thick coal seam located 7m underground. The study area had a history of room-and-pillar coal mining that left behind interconnected cavities. Seismic data was able to discern reflections from the coal seam and distinguish them from voids based on differences in frequency, amplitude, and coherence. Interpretation of the seismic data found repetitive void patterns consistent with room-and-pillar mining and showed that an active sinkhole near railroad tracks was caused by erosion rather than subsurface subsidence, allowing remediation steps to be taken to protect the rails.
The document summarizes research on using seismic methods to detect and characterize a sinkhole in Doha, Qatar. A seismic survey was conducted along the edge of the sinkhole opening. The recorded seismic data revealed a distinct resonance peak at 70 Hz above the sinkhole. Numerical modeling showed that this peak is indicative of a karst side wall separating rock, karst border, and roof. The data were inverted in the frequency domain and fit using a model with low velocity and density parameters in the sinkhole layer, representing the complex geometry of karst.
This document discusses borehole shear-wave surveys, which measure shear wave velocities in soil and rock layers. Shear wave velocities provide more information about material properties than P-wave velocities alone. The document describes conducting cross-hole and down-hole surveys using a surface hammer source to generate shear waves, which are detected by geophones in boreholes. Proper field techniques and data analysis are outlined to accurately measure shear wave velocities with depth. The velocities are used to characterize materials and calculate elastic properties important for foundation and seismic design.
This document summarizes the design of a dual-band microstrip patch antenna that operates at 1.713 GHz and 2.93 GHz using reactive slot loading. Narrow slots are etched close to the radiating edges of the rectangular patch, forcing current to take a longer path and lowering the resonant frequency. Simulation results show return losses of -14.87 dB and -11.87 dB at the two operating frequencies, with radiation patterns normal to the patch surface and VSWR values below 1.7, indicating good impedance matching performance. The design approach demonstrates a single-layer single-feed dual-frequency antenna for applications requiring operation at multiple bands.
This document discusses a new method called seabed logging (SBL) that uses marine controlled source electromagnetic techniques to detect hydrocarbon reservoirs beneath the seafloor. SBL works by transmitting low frequency electromagnetic signals into the seafloor and measuring the reflections and refractions to identify resistive zones indicative of hydrocarbons. The document outlines how SBL was tested off West Africa and Norway with promising results. It also describes how the method works, including how electromagnetic waves propagate differently in resistive hydrocarbon reservoirs compared to surrounding rock. Finally, it presents some modeling examples to illustrate the SBL method and interpretation.
Passive seismic monitoring for CO2 storage sites - Anna Stork, University of Bristol at UKCCSRC specialist meeting Geophysical modelling for CO2 storage, monitoring and appraisal, 3 November 2015
This study used ground-penetrating radar (GPR) to analyze the Quaternary stratigraphy of a sandy portion of the Marambaia Isthmus in Brazil. Five radar facies were identified in one GPR profile, representing different depositional environments: facies A and A' showed planar reflections indicating a low-energy beach or shore environment; facies B showed sigmoidal reflections indicating transport of shelf sediments during a marine transgression; facies C showed oblique reflections indicating eolian dune deposition during lower sea levels; and facies D showed well-sorted sand grains deposited by reworking. Together, the facies suggest periods of marine transgression and lower sea levels with dune formation, providing information on the
PIPELINE PLANNING WITH AIRBORNE ELECTROMAGNETICSBrett Johnson
This document summarizes the results of a helicopter electromagnetic survey conducted along a 130km pipeline corridor to map subsurface conductivity and aid in pipeline construction planning. The survey identified areas of shallow bedrock that would require blasting versus deeper overburden that could be trenched. Drill holes along the corridor were used to calibrate the electromagnetic conductivity measurements with actual subsurface conditions. A conductivity value of 6mS/m correlated well with a 2m overburden depth, the depth needed for pipeline trenching. The survey effectively mapped subsurface conditions and reduced costs associated with pipeline planning and construction.
The document discusses various propagation mechanisms that affect radio signals, including reflection, diffraction, scattering, and their effects on signal strength over distance. It also covers propagation models like free space path loss, two-ray ground reflection model, and log-distance path loss for estimating average received signal power at a given distance. Fresnel zones and knife-edge diffraction are explained as factors in signal propagation around obstructions. Log-normal shadowing is described as a statistical model to account for variations from the average path loss.
This document provides an overview of microwave communication. It discusses various topics related to microwave communication including possible media, manufacturers, advantages of microwave, characteristics, types of links and systems. It also covers topics such as line of sight requirements, wave propagation, multipath propagation, path loss, antenna types and gains. The document discusses concepts like fade margin, reliability and signal to noise ratio which are important in microwave system design. It provides examples of calculating free space loss and fresnel zone radius.
Broadband seismic to support hydrocarbon exploration on the UK Continental Sh...ssuserb20d17
1) Broadband seismic data acquired using variable-depth streamers provides a wider frequency range compared to conventional seismic, delivering higher resolution images of subsurface geology. The low frequencies improve deep penetration while the high frequencies resolve thin beds and subtle structures.
2) Examples from the UK North Sea demonstrate the advantages of broadband seismic for exploring stratigraphic traps, reservoir compartmentalization, and deep/sub-salt targets. Shallow channels and recent deposits are also more clearly imaged.
3) Interpretation of Tertiary turbidite systems benefits from broadband seismic's resolution of thin beds, facies variations, and channel features. Sub-BCU and sub-basalt imaging is also enhanced by the low frequencies,
Dense m agnetized_plasma_associated_with_afast_radio_burstSérgio Sacani
Astrônomos detectaram uma chamada rápida explosão de rádio a cerca de 6 bilhões de anos-luz de distância, uma das menos de duas dezenas desse tipo de evento descobertos nos últimos dez anos, e dessa vez eles têm pistas sobre a fonte.
As rápidas explosões de rádio, ou FRBs, são misteriosas explosões de energia que ocorrem no espaço e que aparecem como rápidos flashes de ondas de rádio nos telescópios da Terra. Essas explosões têm intrigado os astrônomos desde que elas foram reportadas pela primeira vez a uma década atrás. Embora somente 16 dessas explosões tenham sido registradas, eles acreditam que possam existir milhares delas por dia.
Vasculhando mais de 650 horas de dados obtidos pelo Telescópio Green Bank, do NRAO, um grupo internacional de astrônomos descobriu o mais detalhado registro já feito até hoje de uma FRB.
Geophysical well logging uses sensors located in boreholes to measure physical properties of surrounding rocks as a function of depth. Well logs are used to identify geological formations and fluids, correlate between holes, and evaluate reservoir formations. Common logging methods include electrical resistivity, self-potential, nuclear, acoustic, and thermal measurements. The objective is to determine in situ rock and fluid properties, though drilling disturbs the formation. Effective depth of penetration varies between tools and formations. Well logging aims to identify potential reservoirs by determining porosity, permeability, and fluid contents.
An Analysis of Dual Band bandpass Filters using with Arbitrary Band Ratiosijtsrd
This paper proposes the variable reflection angle of meta surface composed of the double layered FSS (Frequency SelectiveSurface) and the ground. The meta-surface can steer the reflection direction of the incident wave by shifting the lower FSS. It is clarified that the gradient of the reflection phase in the reflection direction steering plane (x-z plane) are changed by the shift amount of lower FSS. A miniaturized dual-band frequency selective surfaces with second-order band-pass response at each operation band is presented. The design is implemented by cascading a two-dimensional periodic array of double square loops and an array of wire grids. The proposed structure composed of three metal and two dielectric layers acts as a spatial dual band microwave filter with large band separation. The predicted FSS has the merits of broadband response, excellent stability for different incident angles, and sharp roll-off at X- and Ka-band, respectively.Key-words:- Dual Band, FSS, steering etc. Payal Jindal | Dr. Sudheer Kumar Sharma | Dr. Rashid Hussain"An Analysis of Dual Band bandpass Filters using with Arbitrary Band Ratios" Published in International Journal of Trend in Scientific Research and Development (ijtsrd), ISSN: 2456-6470, Volume-2 | Issue-1 , December 2017, URL: http://www.ijtsrd.com/papers/ijtsrd7102.pdf http://www.ijtsrd.com/engineering/electronics-and-communication-engineering/7102/an-analysis-of-dual-band-bandpass-filters-using-with-arbitrary-band-ratios/payal-jindal
A highly magnetized twin-jet base pinpoints a supermassive black holeSérgio Sacani
Supermassive black holes (SMBH) are essential for the production of jets in radio-loud active galactic nuclei (AGN). Theoretical
models based on (Blandford & Znajek 1977, MNRAS, 179, 433) extract the rotational energy from a Kerr black hole, which could
be the case for NGC1052, to launch these jets. This requires magnetic fields on the order of 103 G to 104 G. We imaged the vicinity
of the SMBH of the AGN NGC1052 with the Global Millimetre VLBI Array and found a bright and compact central feature that is
smaller than 1.9 light days (100 Schwarzschild radii) in radius. Interpreting this as a blend of the unresolved jet bases, we derive the
magnetic field at 1 Schwarzschild radius to lie between 200 G and 8:3 104 G consistent with Blandford & Znajek models.
This document provides information about microwave communication systems. It defines microwave communication as a high radio frequency link designed to provide signal connection between two points. It operates in the 2-60 GHz band and can be analog or digital. Short, medium, and long haul systems exist based on distance and frequency used. The document discusses advantages like increased gain and reliability, as well as disadvantages like limitations in circuit design at high frequencies. It provides formulas for analyzing microwave links, including free space loss, antenna gain, system gain, and more. Worked examples of link calculations are also included.
Similar to Crosshole Seismic Reflection: Coal Mine Fields (20)
Gravimetri Dersi için aşağıda ki videoları izleyebilirsiniz.
Link 01: https://www.youtube.com/watch?v=HTyjVaVGx0k
Link 02: https://www.youtube.com/watch?v=fUkfgI8XaOE
The document discusses gravity anomalies and density variations in different regions based on gravity data. It shows how gravity maps reveal details about crustal thickness, tectonic features like faults and volcanic zones, and plate boundaries. Specific examples discussed include the Tibetan Plateau, Central America subduction zone, an area in Chugoku, Japan, and the state of Florida in the US. Regional gravity data can be used to model density changes associated with plate tectonics, crustal evolution, and volcanic and tectonic activity.
The USF team reviewed a geophysical investigation of the Kar Kar region conducted by WesternGeco in 2011. They found that WesternGeco's magnetotelluric (MT) data and models were of high quality. Both the WesternGeco and USF MT models identified a low resistivity zone at 300m depth that correlates with a water-bearing zone found in Borehole 4. USF performed gravity modeling which identified a north-south trending basin reaching 1500m depth, consistent with mapped faults. A preliminary hydrothermal model suggested observed temperatures could result from deep circulation of meteoric waters in the basin without needing a localized heat source. Additional geophysical data is recommended around the Jermaghbyur hot springs to
This document summarizes a study that used gravity data to delineate underground structure in the Beppu geothermal field in Japan. Analysis of Bouguer anomaly maps revealed high anomalies in the southern and northern parts of the study area that correspond to known geological formations. Edge detection filtering of the gravity data helped identify subsurface faults, including the northern edge of the high southern anomaly corresponding to the Asamigawa Fault. Depth modeling of the gravity basement showed differences between the southern and northern hot spring areas, with steep basement slopes along faults in the south and uplifted basement in the north.
This document summarizes the development of a new ultra-high resolution model of Earth's gravity field called GGMplus. Key points:
- GGMplus combines satellite gravity data from GOCE and GRACE with terrestrial gravity data and topography to achieve unprecedented 200m spatial resolution globally.
- It provides gridded estimates of gravity, horizontal and radial field components, and quasi-geoid heights at over 3 billion points covering 80% of the Earth's land.
- GGMplus reveals new details of small-scale gravity variations and identifies locations of minimum and maximum gravity, suggesting peak-to-peak variations are 40% larger than previous estimates. The model will benefit scientific and engineering applications.
Gravity measurements were taken in a region of China covering the south-north earthquake belt in 1998, 2000, 2002, and 2005. Researchers noticed significant gravity changes in the region surrounding Wenchuan and suggested in 2006 that a major earthquake could occur there in 2007 or 2008. While gravity changes were significant at some locations, more research is needed to determine if they could be considered a precursor. Uncertainties exist from measurement errors, hydrologic effects, and crustal movements. Improved data collection and analysis could enhance using gravity monitoring for earthquake research.
The document provides guidelines for implementing the H/V spectral ratio technique using ambient vibration measurements to evaluate site effects. It recommends procedures for experimental design, data processing, and interpretation. The key recommendations include measuring for sufficient duration depending on expected frequency, using multiple measurement points, avoiding disturbances, and interpreting H/V peaks in context with geological and geophysical data. Reliable H/V peaks are defined as having a clear maximum within expected frequency ranges and uncertainties. The guidelines aim to help apply the technique while accounting for its limitations.
Geopsy yaygın olarak kullanılan profesyonel bir program. Özellikle, profesyonel program deneyimi yeni mezunlarda çok aranan bir özellik. Bir öğrencim çalışmasında kullanmayı planlıyor.
বাংলাদেশের অর্থনৈতিক সমীক্ষা ২০২৪ [Bangladesh Economic Review 2024 Bangla.pdf] কম্পিউটার , ট্যাব ও স্মার্ট ফোন ভার্সন সহ সম্পূর্ণ বাংলা ই-বুক বা pdf বই " সুচিপত্র ...বুকমার্ক মেনু 🔖 ও হাইপার লিংক মেনু 📝👆 যুক্ত ..
আমাদের সবার জন্য খুব খুব গুরুত্বপূর্ণ একটি বই ..বিসিএস, ব্যাংক, ইউনিভার্সিটি ভর্তি ও যে কোন প্রতিযোগিতা মূলক পরীক্ষার জন্য এর খুব ইম্পরট্যান্ট একটি বিষয় ...তাছাড়া বাংলাদেশের সাম্প্রতিক যে কোন ডাটা বা তথ্য এই বইতে পাবেন ...
তাই একজন নাগরিক হিসাবে এই তথ্য গুলো আপনার জানা প্রয়োজন ...।
বিসিএস ও ব্যাংক এর লিখিত পরীক্ষা ...+এছাড়া মাধ্যমিক ও উচ্চমাধ্যমিকের স্টুডেন্টদের জন্য অনেক কাজে আসবে ...
हिंदी वर्णमाला पीपीटी, hindi alphabet PPT presentation, hindi varnamala PPT, Hindi Varnamala pdf, हिंदी स्वर, हिंदी व्यंजन, sikhiye hindi varnmala, dr. mulla adam ali, hindi language and literature, hindi alphabet with drawing, hindi alphabet pdf, hindi varnamala for childrens, hindi language, hindi varnamala practice for kids, https://www.drmullaadamali.com
A review of the growth of the Israel Genealogy Research Association Database Collection for the last 12 months. Our collection is now passed the 3 million mark and still growing. See which archives have contributed the most. See the different types of records we have, and which years have had records added. You can also see what we have for the future.
How to Fix the Import Error in the Odoo 17Celine George
An import error occurs when a program fails to import a module or library, disrupting its execution. In languages like Python, this issue arises when the specified module cannot be found or accessed, hindering the program's functionality. Resolving import errors is crucial for maintaining smooth software operation and uninterrupted development processes.
Walmart Business+ and Spark Good for Nonprofits.pdfTechSoup
"Learn about all the ways Walmart supports nonprofit organizations.
You will hear from Liz Willett, the Head of Nonprofits, and hear about what Walmart is doing to help nonprofits, including Walmart Business and Spark Good. Walmart Business+ is a new offer for nonprofits that offers discounts and also streamlines nonprofits order and expense tracking, saving time and money.
The webinar may also give some examples on how nonprofits can best leverage Walmart Business+.
The event will cover the following::
Walmart Business + (https://business.walmart.com/plus) is a new shopping experience for nonprofits, schools, and local business customers that connects an exclusive online shopping experience to stores. Benefits include free delivery and shipping, a 'Spend Analytics” feature, special discounts, deals and tax-exempt shopping.
Special TechSoup offer for a free 180 days membership, and up to $150 in discounts on eligible orders.
Spark Good (walmart.com/sparkgood) is a charitable platform that enables nonprofits to receive donations directly from customers and associates.
Answers about how you can do more with Walmart!"
How to Make a Field Mandatory in Odoo 17Celine George
In Odoo, making a field required can be done through both Python code and XML views. When you set the required attribute to True in Python code, it makes the field required across all views where it's used. Conversely, when you set the required attribute in XML views, it makes the field required only in the context of that particular view.
Strategies for Effective Upskilling is a presentation by Chinwendu Peace in a Your Skill Boost Masterclass organisation by the Excellence Foundation for South Sudan on 08th and 09th June 2024 from 1 PM to 3 PM on each day.
The simplified electron and muon model, Oscillating Spacetime: The Foundation...RitikBhardwaj56
Discover the Simplified Electron and Muon Model: A New Wave-Based Approach to Understanding Particles delves into a groundbreaking theory that presents electrons and muons as rotating soliton waves within oscillating spacetime. Geared towards students, researchers, and science buffs, this book breaks down complex ideas into simple explanations. It covers topics such as electron waves, temporal dynamics, and the implications of this model on particle physics. With clear illustrations and easy-to-follow explanations, readers will gain a new outlook on the universe's fundamental nature.
ISO/IEC 27001, ISO/IEC 42001, and GDPR: Best Practices for Implementation and...PECB
Denis is a dynamic and results-driven Chief Information Officer (CIO) with a distinguished career spanning information systems analysis and technical project management. With a proven track record of spearheading the design and delivery of cutting-edge Information Management solutions, he has consistently elevated business operations, streamlined reporting functions, and maximized process efficiency.
Certified as an ISO/IEC 27001: Information Security Management Systems (ISMS) Lead Implementer, Data Protection Officer, and Cyber Risks Analyst, Denis brings a heightened focus on data security, privacy, and cyber resilience to every endeavor.
His expertise extends across a diverse spectrum of reporting, database, and web development applications, underpinned by an exceptional grasp of data storage and virtualization technologies. His proficiency in application testing, database administration, and data cleansing ensures seamless execution of complex projects.
What sets Denis apart is his comprehensive understanding of Business and Systems Analysis technologies, honed through involvement in all phases of the Software Development Lifecycle (SDLC). From meticulous requirements gathering to precise analysis, innovative design, rigorous development, thorough testing, and successful implementation, he has consistently delivered exceptional results.
Throughout his career, he has taken on multifaceted roles, from leading technical project management teams to owning solutions that drive operational excellence. His conscientious and proactive approach is unwavering, whether he is working independently or collaboratively within a team. His ability to connect with colleagues on a personal level underscores his commitment to fostering a harmonious and productive workplace environment.
Date: May 29, 2024
Tags: Information Security, ISO/IEC 27001, ISO/IEC 42001, Artificial Intelligence, GDPR
-------------------------------------------------------------------------------
Find out more about ISO training and certification services
Training: ISO/IEC 27001 Information Security Management System - EN | PECB
ISO/IEC 42001 Artificial Intelligence Management System - EN | PECB
General Data Protection Regulation (GDPR) - Training Courses - EN | PECB
Webinars: https://pecb.com/webinars
Article: https://pecb.com/article
-------------------------------------------------------------------------------
For more information about PECB:
Website: https://pecb.com/
LinkedIn: https://www.linkedin.com/company/pecb/
Facebook: https://www.facebook.com/PECBInternational/
Slideshare: http://www.slideshare.net/PECBCERTIFICATION
How to Add Chatter in the odoo 17 ERP ModuleCeline George
In Odoo, the chatter is like a chat tool that helps you work together on records. You can leave notes and track things, making it easier to talk with your team and partners. Inside chatter, all communication history, activity, and changes will be displayed.
1. The Crosshole Seismic Reflection Method in Opencast Coal Exploration
M. J. Findlay, N. R. Goulty and J. E. Kragh
First Break
EG&G Geometrics
395 Java Drive
Sunnyvale, CA 94089
408/734-4616
2. First 1 Break VOL 9, No 11, NOVEMBER 1991/509
The crosshole seismic reflection method
in opencast coal exploration1
M.J. Findlay2,3
, N.R. Goulty2
and
J.E. Kragh2,4
Introduction
In opencast coal exploration in the UK, a dense grid of
boreholes is drilled to provide the necessary information
on the quantity and quality of coal reserves and on the
geological structure. Typically, borehole spacing is 40–
60 m, but it may be reduced around faults or where there
are old room-and-pillar mineworkings. Even with this
density of boreholes, it is not possible to detect faults
with throws less than 2–3 m, and these can pose a hazard
to stability during excavation which may be particularly
critical at site boundaries. Also, estimates of the quant-
ity of coal reserves could be improved if old minework-
ings were located more accurately.
The potential of borehole seismic surveys in this ap-
plication was discussed in more detail in an earlier paper
(Kragh et al. 1991). Here we report on the development
of the crosshole reflection method, making use of open-
cast exploration boreholes, to provide seismic cross-
sections between boreholes. Small explosive charges are
used as sources with hydrophones as receivers. The use
of downhole sources and receivers leads to excellent
resolution compared with surface seismic and VSP
surveys; signal bandwidth is typically 200–500 Hz.
Readers interested in the application of cross-well sur-
veys to the definition of hydrocarbon reservoirs will note
that the environmental conditions for our surveys were
relatively undemanding: low temperatures and hydro-
static pressures in uncased boreholes at relatively close
separations. Nevertheless, the results indicate the po-
tential of the method for deeper, larger scale surveys in
sedimentary rocks, where even higher frequencies can
be successfully transmitted (e.g. Harris 1988).
Data acquisition
A string of 12 hydrophone receivers at 2 m spacing is
placed in one borehole (Fig. 1). Small explosive charges
Presented at the 52nd EA EG Meeting, Copenhagen, May/June 1990.
2
Department of Geological Sciences, University of Durham, South
Road, Durham DHI 3LE, UK.
3
Present address: The Petroleum Science and Technology Institute,c/o
Department of Petroleum Engineering, Heriot-Watt University,
Research Park, Riccarton, Edinburgh EH14 4AS, UK.
4Present address: Seismograph Service (England) Ltd, Holwood,
Westerham Road, Keston, Kent BR26HD, UK.
Fig. 1. Schematic diagram of field set-up for data acquisition. Borehole
separations are typically 30—60 m and source and receiver spacings are
2 m over a depth range of 40 m or more.
(either a single electric detonator on its own, or with
15 g of chemical explosive) are fired successively in a
neighbouring borehole at 2 m intervals. Coverage is then
extended by repositioning the hydrophone string in the
receiver borehole and repeating the shot sequence. The
triggering signal for the seismograph is obtained by
wrapping a wire around the end of the detonator. This
blows open-circuit when the shot is fired, providing an
accurate time-break. It is necessary that all shot and
receiver positions are below the water table in order to
provide good acoustic coupling to the rock. A typical
common-shot gather is displayed in Fig. 2a.
The deviation of the boreholes from the vertical is
measured using a pendulum-type inclinometer. This
tool is run in the borehole inside its own purpose-
designed casing, which has grooves so that inclinations
may be measured in two perpendicular azimuths. Devia-
tion from the vertical in these shallow boreholes has
generally been slight (no more than 3 m at the deepest
source or receiver position), and neighbouring bore-
holes tend to deviate by similar amounts in the same
direction.
3. 510/FIRST BREAK VOL 9, NO 11, NOVEMBER 1991
Fig. 3. Reflection point loci for upgoing primary reflections in a
crosshole survey of typical dimensions. Only alternate source and
receiver positions, at 4 m spacing, are shown for clarity.
the receivers in an upward direction (i.e. primary reflec-
tions in the upgoing wavefield). The diagram could be
inverted to show the sub-surface coverage of the down-
going wavefield, including primary reflections from
interfaces above source and receiver positions. Thus
subsurface coverage extends above the water table and
below the deepest locations of sources and receivers,
albeit with reducing width.
(a) Travel Time (milliseconds)
Travel Time (milliseconds)
Fig. 2. Common-shot gather from a detonator at 30 m depth with
hydrophones over the depth range 22–66 m: (a) raw data with gain
ramp applied proportional to traveltime squared; (b) showing only the
upgoing wavefield at the receivers after wavefield separation in the f–k
domain.
In order to illustrate the sub-surface coverage which
may be obtained in such surveys, the reflection point loci
for alternate source and receiver positions in a pair of
vertical boreholes 50 m apart are plotted in Fig. 3.
These loci were calculated for a constant velocity field
assuming horizontal interfaces. They indicate where re-
flections would occur for rays which leave the source
positions in a downward direction and are incident on
Data processing
An outline of the processing sequence is sketched in Fig.
4. First, upgoing and downgoing wavefields at the re-
ceivers are separated by filtering common-shot gathers
in the frequency–wavenumber (f–k) domain. The up-
going wavefield from the common-shot gather in Fig. 2a
is shown in Fig. 2b. The direct wave arrivals may be
muted out, either before or after wavefield separation.
Inclusion of the direct arrivals in the wavefield separa-
tion process can lead to ringing problems in the filtered
data, but on traces where the direct arrivals are, say,
downgoing and the reflections of interest are upgoing, it
is preferable to mute after wavefield separation in order
to preserve as much of the reflected energy as possible.
4. FIRST BREAK VOL 9, NO 11, NOVEMBER 1991/511
Fig. 4. Outline processing sequence for crosshole seismic reflection
data.
Receiver spacing needs to be less than half the apparent
vertical wavelength in order to avoid spatial aliasing.
The spacing of 2 m is small enough for the signal
bandwidth and velocity fields in these shallow surveys.
A common problem with borehole receivers is the
presence of tube waves in the data. We have observed
them in some of our crosshole datasets, where they
characteristically have lower bandwidth than the body
waves. They sometimes emanate from the top (or water
table) and bottom of the receiver borehole, and fre-
quently from the depth levels of coal seams. These
events are apparently generated by the interaction of the
direct body waves with discontinuities in the receiver
borehole. In our datasets, where tube waves have been
observed, they have readily been suppressed by f–k
filtering.
Before imaging the data, it is advantageous to shape
the effective wavelet into a zero-phase wavelet with a flat
amplitude spectrum over the useful signal bandwidth.
The effective wavelets in the upgoing and downgoing
wavefields are estimated separately because of differ-
ences in short-period multiple content. The wavelet in
each case is assumed to be minimum-phase and is calcu-
lated from the averaged autocorrelation functions of all
the traces in the (wavefield-separated) common-shot
gather.
The VSP–CDP transform (see Dillon and Thomson
1984) was used to image the data by reflection point
mapping in the first survey of this type which we pro-
cessed (Goulty a al. 1990). Subsequently, we used the
same technique to refine the velocity field prior to migra-
tion. However, more recently we have discarded it. An
initial estimate of the velocity field is obtained by meas-
uring uphole times in each borehole at 2 m intervals, and
from a traveltime tomogram obtained by inverting the
direct wave arrival times by the simultaneous iterative
reconstruction technique (SIRT).
The separated wavefields in each common-shot gather
are migrated using the generalized Kirchhoff integral of
Dillon (1990), which is valid in the far-field approxima-
tion. A gain ramp proportional to the square root of the
traveltime is applied to each trace, followed by spectral
correction factors appropriate for the assumption of
2D structure. Rays are traced from each grid point on
the section to be imaged to each source and receiver
position, and corresponding traveltimes calculated.
Amplitude values are summed for each `diffraction
point' over an aperture which includes dips of ±22.5°.
The migrated wavefields are stacked to yield one sec-
tion for upgoing reflections and another for downgoing
reflections. The polarity of the downgoing reflection sec-
tion has to be reversed as reflection coefficients change
sign when the wave is incident from the opposite side of
the interface. Any mismatch in stacking indicates errors
in the velocity field, which has to be modified and the
migration step repeated. The migrated up- and down-
going wavefields are then combined in a final section.
Results
The results from two surveys at an exploration site in
Yorkshire, England are presented here. One is across
undisturbed ground and the other across a normal fault
zone with approximately 25 m of vertical throw.
In the first survey, the boreholes were 41 m apart. Det-
onators and hydrophones were positioned at 2 m inter-
vals in the respective boreholes over the approximate
depth range 10–60 m. The stacked, migrated down- and
upgoing wavefields are shown in Figs 5a and b. Normal
SEG polarity is adopted, so the reflection from the top of
a coal seam is black.
It is very difficult to adjust the velocity field for migra-
tion such that the overlapping part of the up- and down-
going sections matches. Consequently, it is expedient to
combine the two sections using complementary cosine
tapers over a zone of low reflectivity to produce the
complete section of Fig. 5c.
The coal seams give rise to the strongest reflections in
the section, although there is also a strong reflection at
the water table. Slight mis-matches in depth between
black peaks and the tops of coal seams indicate that the
velocity field was not estimated perfectly.
The presence of a small fault between 70 and 80 m
depth in the borehole on the left is readily apparent from
the missing section between the sandstone bed and the
next coal seam below it. Unfortunately, the fault cannot
5. Distance m
Distance m
10 20
Distance m
(c)
Fig. 5. Stacked sections with prestack depth migration from an example survey: (a) downgoing wavefield; (b) upgoing wavefield; (c) combined up- and downgoing wavefields. The velocity field
used for migration is displayed to the side.
6. FIRST BREAK VOL 9 , NO 11, NOVEMBER 1991/513
Distance m
Fig. 6. Final section with prestack depth migration from a survey across a normal fault zone. The velocity field used for migration is displayed
to the side.
be picked on the seismic section, either because it is too
close to the borehole, or because of lack of penetration
of signal through the worked seam at 50 m depth. The
use of larger charges might have overcome the latter
problem.
In the second survey, the boreholes were just over
30 m apart. Detonators and hydrophones were spaced at
2 m intervals over the approximate depth range 10–50
m. The migrated depth section, with up- and downgoing
reflections combined, images the fault zone quite clearly
(Fig. 6). The reflection from coal seam Z is continuous
across the section from the borehole on the right, so
there must be a fault with 7 m vertical throw at this hori-
zon very close to the borehole on the left. A larger fault,
of some 15 m vertical throw, cuts the borehole on the left
between coal seams Z and Y. The truncations of reflec-
tions from coal seam Y to the right, and from coal seam
X to the left at the fault zone are clearly imaged in the
body of the data.
Discussion and conclusions
The most demanding step in processing has been to es-
timate the velocity field correctly for the prestack depth
migration. Adjustment of the velocity in one interval to
reposition one reflector generally requires adjustment of
the rest of the velocity field too. The velocity field in coal
measures is anisotropic, and no doubt it would be neces-
sary to introduce anisotropy to achieve the best possible
7. 514/FIRST BREAK VOL 9, NO 11, NOVEMBER 1991
result. We have experimented with an overall aniso-
tropy of 15%, velocities being faster in the horizontal
direction than in the vertical, as this was indicated by the
uphole and crosshole direct-wave traveltime data. How-
ever, the results were no better.
We have been able to suppress any tube waves in our
datasets quite readily by filtering in the f–k domain, but
they may be much more dominant, and therefore much
more of a problem, in other crosshole datasets. For
example, Albright and Johnson (1990) observed tube
waves in the receiver borehole generated by tube waves
in the source borehole and transmitted between bore-
holes as a channel wave in a coal seam. However, our ex-
perience in northern England shows that it is not usually
possible to generate channel waves in coal seams shal-
lower than 100 m depth (Goulty et at. 1990), even when
one wishes to do so to check for cross-hole continuity of
the coal seam!
The results show that high-resolution images of coal
measures strata can be obtained using the crosshole seis-
mic reflection method. Strong reflections are visible
from coal seams only a few tens of centimetres thick, and
the wavelengths present in the section suggest that iso-
lated small faults with throws as small as 1 m might be de-
tectable. The lack of coverage very close to, and directly
below, the boreholes is a restriction in the method; how-
ever, this zone may be filled in using the hole-to-surface
seismic reflection method (Kragh et al. 1991).
In conjunction with hole-to-surface seismic profiles,
the crosshole reflection method should be useful in
opencast coal exploration for locating small faults at site
boundaries which can pose a hazard during excavation.
It could also be used to detect the boundaries of old
mineworkings between boreholes. This would help to
improve estimates of site reserves in an exploration
context, but might be more useful in site investigation
for civil engineering construction. Crosshole seismic
profiles might also be acquired beneath obstacles such as
buildings or water courses where drilling and planting
surface geophones are impractical.
Acknowledgements
This work has been supported by British Coal, DENI ,
NERC and SERC. We thank the geological staff of
British Coal Opencast, especially Mel Jones, for pro-
fessional assistance. However, the views, observations
and conclusions stated in this article are those of the
authors, and are not necessarily endorsed by the British
Coal Corporation.
Received 16 July 1991; accepted 27 August 1991.
References
ALBRIGHT , J.N. and JOHNSON, P.A. 1990. Cross-borehole observation
of mode conversion from borehole Stoneley waves to channel
waves at a coal layer. Geophysical Prospecting 38, 607-620.
DILLON, P.B. 1990. A comparison between Kirchhoff and GRT migra-
tion on VSP data. Geophysical Prospecting38, 757-777.
DILLON, P.B. and THOMSON, R.C. 1984. Offset source VSP surveys
and their image reconstruction. Geophysical Prospecting 32,
790-811.
GGULTY, N.R., THATCHER, J.S., FINDLAY, M.J., KRAGH, J.E. and
JACKSON, P.D. 1990. Experimental investigation of crosshole seis-
mic techniques for shallow coal exploration. Quarterly Journal of
Engineering Geology23, 217-228.
HARRIS, J.M. 1988. Cross-well seismic measurements in sedimentary
rocks. 58th Meeting. Society of Exploration Geophysicists,
Expanded Abstracts, 147-150.
KRAGH, J.E., GOULTY, N.R. and FINDLAY, M.J., 1991. Hole-to-surface
seismicreflection surveys forshallow coal exploration. First Break
9,335–344.