This document provides information on formation evaluation from well logs, including determining porosity, permeability, water saturation, and identifying depleted gas reservoirs. It discusses:
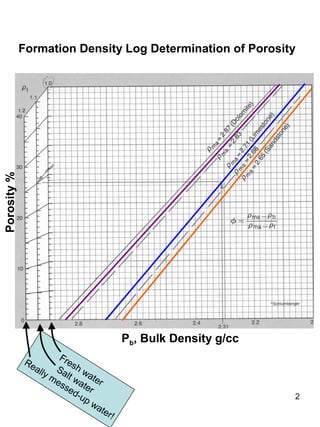
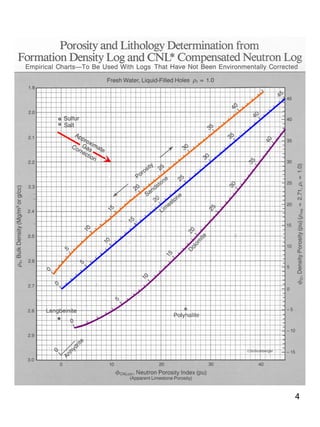
1. Using density and neutron logs to determine porosity in gas-filled reservoirs, and relying on density logs for porosity in oil reservoirs due to clay effects.
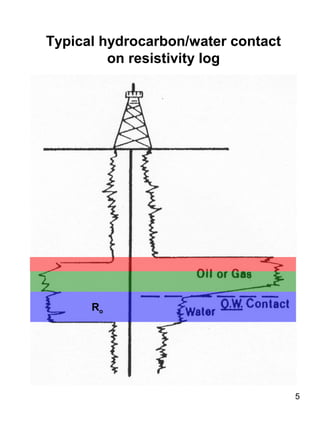
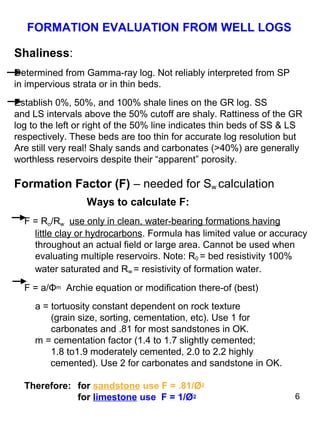
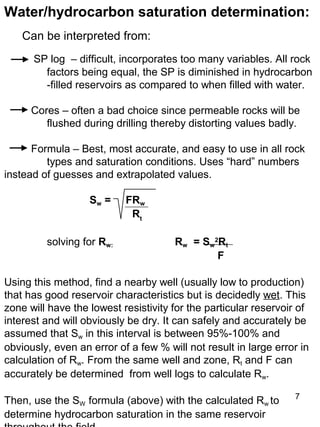
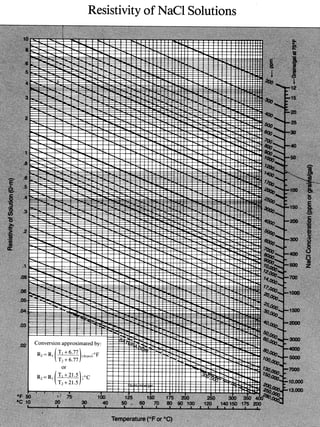
2. Calculating water saturation using resistivity logs and accounting for formation water resistivity based on known water saturated zones.
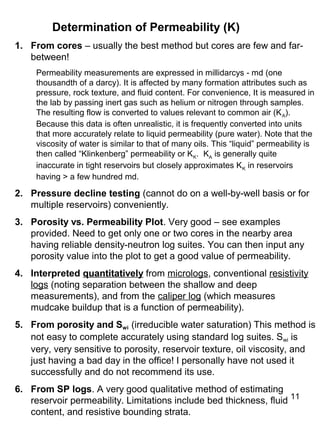
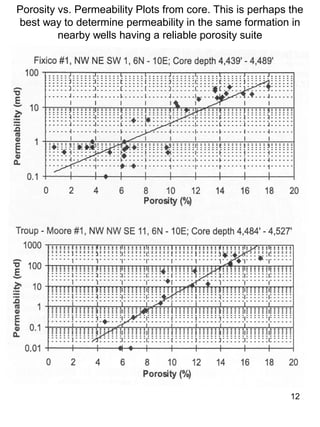
3. Methods for estimating permeability, including using core data, pressure decline testing, porosity-permeability plots, and resistivity and SP logs.
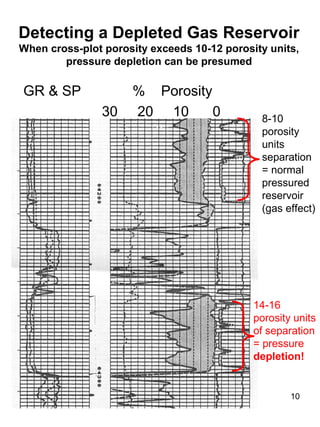
4. Identifying depleted gas reservoirs by looking for large separation between density and neutron porosity logs,


![Well Log Interpretation and Petrophysical Analisis in [Autosaved]](https://cdn.slidesharecdn.com/ss_thumbnails/a24a638f-02ab-4332-9396-89ba2cdd02b4-161128031018-thumbnail.jpg?width=640&height=640&fit=bounds)


