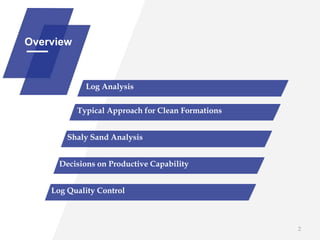
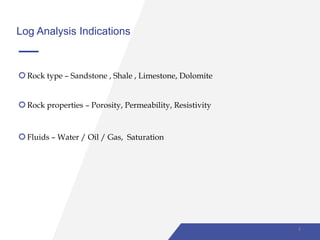
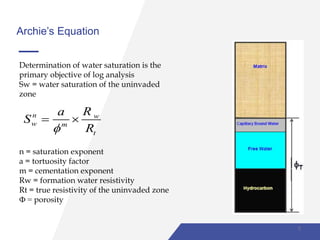
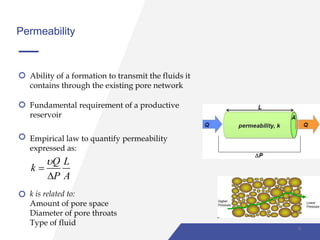
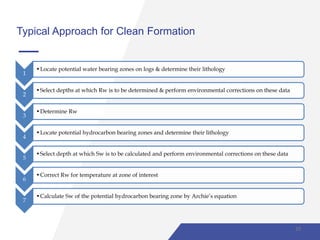
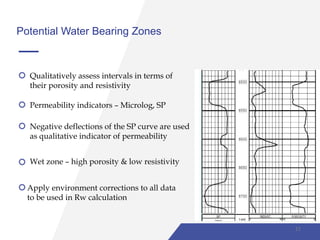
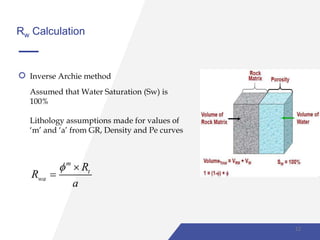
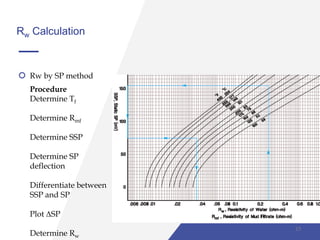
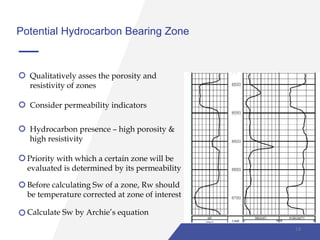
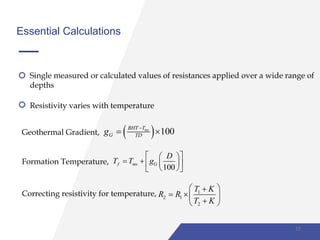
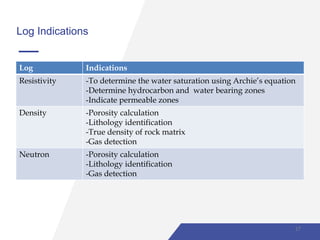
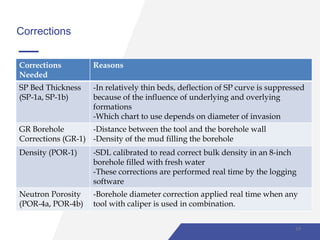
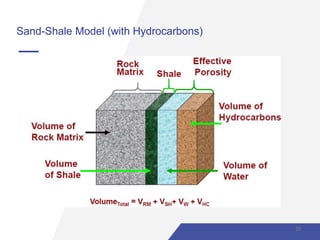
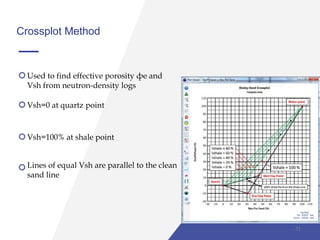
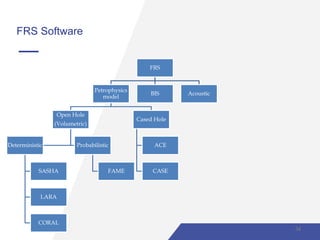
Well Log Analysis
Sanjan Das
Overview
Log Analysis
Typical Approach for Clean Formations
2
Shaly Sand Analysis
Decisions on Productive Capability
Log Quality Control
Formation Evaluation & Log Analysis
Formation Evaluation – Practice of determining both the physical & chemical
properties of rocks & fluids they contain
Wireline logging is one of the evaluation methods
Decision to plug or complete a well is based upon the log response. Hence,
proper analysis of log data is a must
3
Log Analysis Indications
Rock type – Sandstone , Shale , Limestone, Dolomite
Rock properties – Porosity, Permeability, Resistivity
Fluids – Water / Oil / Gas, Saturation
4
Archie’s Equation
Determination of water saturation is the
primary objective of log analysis
Sw = water saturation of the uninvaded
zone
n = saturation exponent
a = tortuosity factor
m = cementation exponent
Rw = formation water resistivity
Rt = true resistivity of the uninvaded zone
Ф = porosity
n w
w m
t
Ra
S
R
 
5
Archie Water Saturation Variables
a : tortuosity factor.
m: cementation exponent.
n: saturation exponent. usually 2.
6
Resistivity
Fundamental of all measurements in logging
Resistivity is the physical measurement of resistance
Water bearing zones have lower resistivity than hydrocarbon bearing zones
If for a given porosity, the measured resistivity is significantly greater than the
wet resistivity, then the presence of hydrocarbon is indicated
7
Porosity
Porosity represents fluid storage capacity of a reservoir. Its defined as ratio of
pore space volume to the total bulk volume of the rock
Porosity (%) = (pore space volume/bulk space volume)X100
Two kinds of porosity –
a) Absolute or Total porosity
b) Effective porosity
8
Permeability
Ability of a formation to transmit the fluids it
contains through the existing pore network
Fundamental requirement of a productive
reservoir
Empirical law to quantify permeability
expressed as:
Q L
k
P A



k is related to:
Amount of pore space
Diameter of pore throats
Type of fluid
9
Typical Approach for Clean Formation
1
•Locate potential water bearing zones on logs & determine their lithology
2
•Select depths at which Rw is to be determined & perform environmental corrections on these data
3
•Determine Rw
4
•Locate potential hydrocarbon bearing zones and determine their lithology
5
•Select depth at which Sw is to be calculated and perform environmental corrections on these data
6
•Correct Rw for temperature at zone of interest
7
•Calculate Sw of the potential hydrocarbon bearing zone by Archie’s equation
10
Potential Water Bearing Zones
Qualitatively assess intervals in terms of
their porosity and resistivity
Permeability indicators – Microlog, SP
Negative deflections of the SP curve are used
as qualitative indicator of permeability
Wet zone – high porosity & low resistivity
11
Apply environment corrections to all data
to be used in Rw calculation
Rw Calculation
Inverse Archie method
Assumed that Water Saturation (Sw) is
100%
Lithology assumptions made for values of
‘m’ and ‘a’ from GR, Density and Pe curves
m
t
wa
R
R
a
 

12
Rw Calculation
Rw by SP method
Procedure
Determine Tf
Determine Rmf
Determine SSP
Determine SP
deflection
Differentiate between
SSP and SP
Plot ΔSP
Determine Rw
13
Potential Hydrocarbon Bearing Zone
Qualitatively asses the porosity and
resistivity of zones
Consider permeability indicators
Hydrocarbon presence – high porosity &
high resistivity
Priority with which a certain zone will be
evaluated is determined by its permeability
Before calculating Sw of a zone, Rw should
be temperature corrected at zone of interest
Calculate Sw by Archie’s equation
14
Essential Calculations
Single measured or calculated values of resistances applied over a wide range of
depths
Resistivity varies with temperature
Geothermal Gradient,   100msBHT T
G TDg 
 
Formation Temperature,
100
f ms G
D
T T g
  
    
  
Correcting resistivity for temperature, 1
2 1
2
T K
R R
T K
 
  
 
15
Log Indications
Log Indications
Caliper -Mudcake presence indicates permeable formation
-Caliper log is a permeability indicator
SP -Negative deflections of SP indicates permeability
-However, absence of deflection doesn’t indicate absence of
permeability
-Rw determination
-Shale volume calculation
-Well to well correlation
GR -Helps finding permeable layers
-Indicates degree of shaliness of a formation.
-Lithology identification
-Shale volume calculation
-Determine bed boundaries
-Well to well correlation
16
Log Indications
Log Indications
Resistivity -To determine the water saturation using Archie’s equation
-Determine hydrocarbon and water bearing zones
-Indicate permeable zones
Density -Porosity calculation
-Lithology identification
-True density of rock matrix
-Gas detection
Neutron -Porosity calculation
-Lithology identification
-Gas detection
17
Environmental Corrections
Logging tools are calibrated to operate in specific conditions
Factors affecting tool responses – hole size, mud weight, bed thickness, depth of
invasion, and other properties of logging environment
Depending on tool type & environmental conditions, appropriate charts are
used for corrections
18
Corrections
Corrections
Needed
Reasons
SP Bed Thickness
(SP-1a, SP-1b)
-In relatively thin beds, deflection of SP curve is suppressed
because of the influence of underlying and overlying
formations
-Which chart to use depends on diameter of invasion
GR Borehole
Corrections (GR-1)
-Distance between the tool and the borehole wall
-Density of the mud filling the borehole
Density (POR-1) -SDL calibrated to read correct bulk density in an 8-inch
borehole filled with fresh water
-These corrections are performed real time by the logging
software
Neutron Porosity
(POR-4a, POR-4b)
-Borehole diameter correction applied real time when any
tool with caliper is used in combination.
19
Sand-Shale Model (with Hydrocarbons)
20
Complete Model
21
Modes of Occurrence of Clay
Type Occurrence Impact on reservoir
Laminated shale -Thin layers of clay minerals
-Interbedded with thin layers of
sandstone
- Tends to reduce
porosity & permeability
of reservoir
Structural clay - Exists as individual grains along
with framework grains of a
reservoir
-Little impact
-Doesn’t restrict or block
pore throats
Dispersed clay -Exists within the pore space of a
reservoir
-Replaces fluid volume
-Blocks pore throats
-Reduces effective
porosity and
permeability
22
Shale/Clay effects on log responses
Log Type Effects
Sonic
Porosity
-Porosity too high, because TT (shale) > TT (matrix of clean
formation)
Density -Actual density of formation is volumetric combination of density of
clay and sand grains
-When p (clay)> p (sand) – overestimated
-When p (clay)< p (sand) – underestimated
Neutron
porosity
-Clay minerals are hydrated & contain structurally bound OH-
-Reflects additional hydrogen even though not part of pore space
-Porosity increases
Resistivity -Adds conductance
-Clay contain saline water & other ions that decreases resistivity
23
Combined effect of Shale/Clay
Decreased resistivity & typically increased porosity
Results in erroneously high values of Sw by Archie Equation
Shaly sand analysis corrects these effects & reduce Sw
24
Procedure of Shaly Sand Analysis
1
• Determining volume of shale (Vsh) in the zone of
interest
2
• Correcting porosity for the presence of clays
(determining effective porosity of the zone of interest)
3
• Determining effective water saturation of the zone of
interest (water saturation of the effective pore network)
25
Volume of Shale (Vsh)
Determine the amount of clay minerals present in the formation.
Estimates of the volume of clay minerals.
Do not consider type or distribution.
Vsh < 15% of bulk rock volume – assumed clay minerals not having effect on log
response – Archie equation
Vsh > 15% of bulk rock volume – shaly shale analysis should be performed
Many types of logs used either alone or in combination.
26
Vsh from Gamma Ray
First, calculate GR Index (Igr)
log min
max min
GR
GR GR
I
GR GR



Second, select an equation based on type of distribution
Linear, Vsh = Igr
Clavier, Vsh = 1.7 – [3.38 – (Igr + 0.7)^2]^0.5
Steiber, Vsh = 0.5x[Igr/(1.5 – Igr)]
Choice of equation mainly depends on local knowledge
27
Vsh from Spontaneous Potential
In water bearing sandstones of low to medium resistivity
PSP is the amount of SP deflection in the zone of interest
SSP is the maximum SP deflection in a clean formation
1.0
PSP
Vsh
SSP
 
28
Vsh from Neutron-Density Logs
Combination of porosity measurements from neutron and density logs is used
( )
( )
n d
sh
nsh dsh
V
 
 



Comparison of Vsh results
Vsh should be determined from as many methods as possible
Lowest resulting value should be used in determining effective porosity
29
Determining Effective Porosity
Correcting porosity measurements for the presence of clay minerals
Фe=ф(1-Vsh)
From Sonic logs,
From Density logs,
From Neutron-Density combinations,
log 100ma sh ma
e sh
fl ma sh fl ma
t t t t
V
t t t t t

      
               
logma ma sh
e sh
ma fl ma fl
V
   

   
    
           
 
 
   
0.52 2
2
2
n corrected n cl nsh
d corrected d cl dsh
n corrected d corrected
e
n corrected d corrected
e
V
V
  
  
 

 



 
 
  
  
 
  
 
 
  
 
 
30
Crossplot Method
Used to find effective porosity фe and
Vsh from neutron-density logs
Vsh=0 at quartz point
Vsh=100% at shale point
Lines of equal Vsh are parallel to the clean
sand line
31
Crossplot Method
Shale line is фe = 0
Lines with equal фe are parallel to the
shale line
Effective porosity lines originate at the
фe=фn=фd points on sand line
32
Effective Water Saturation
It’s the percentage of effective porosity occupied by water
33
/2
(1 ( /2))
1
cl
tn
we mV
ecl
cl w
R
S
V
R a R




FRS Software
FRS
Petrophysics
model
Open Hole
(Volumetric)
Deterministic
SASHA
LARA
CORAL
Probabilistic
FAME
Cased Hole
ACE
CASE
BIS Acoustic
34
FRS Software
35
FRS Software
36
Decisions on Productive Capability
Moveable Hydrocarbon Index (MVI)
Bulk Volume Water (BVW)
Irreducible Water Saturation
Calculation of Reserves
37
Moveable Hydrocarbon Index (MVI)
Ratio of Water Saturation of uninvaded zone to Flushed Zone Water Saturation
w
xo
S
MHI
S

If MHI<1, then hydrocarbons were likely moved during invasion and the
reservoir will produce
If MHI≥1, then hydrocarbons were not moved during invasion
38
Irreducible Water Saturation
Value of Sw at which water in reservoir is either adsorbed onto grain surface or
bound within pore network by capillary pressure.
If a reservoir is at Swirr, water present will be immovable and production will be
water free hydrocarbons
39
Bulk Volume Water
Fraction of rock volume occupied by water
wBVW S  
If values of BVW remain constant throughout a reservoir, it indicates reservoir
is at Swirr
40
Calculation of Reserves
Barrels of oil in place,
Recoverable oil,
Cubic Feet of
gas in place,
Recoverable
gas,
 7758 1 wN S h A    
  7758 1 wRF S h A
N
SF
    

 43560 1 wG S h A    
   
 
6
1.54 10 1
460
w
f
RF S h A Pf
G
GD T
      


41
Log Quality Control
Log header
Calibration
Logging speed
Repeat section
Correlation with near by well
Depth control
Log quality control must be performed to ensure that data is suitable for analysis
42
Thank you
43

Well Log Analysis

  • 1.
  • 2.
    Overview Log Analysis Typical Approachfor Clean Formations 2 Shaly Sand Analysis Decisions on Productive Capability Log Quality Control
  • 3.
    Formation Evaluation &Log Analysis Formation Evaluation – Practice of determining both the physical & chemical properties of rocks & fluids they contain Wireline logging is one of the evaluation methods Decision to plug or complete a well is based upon the log response. Hence, proper analysis of log data is a must 3
  • 4.
    Log Analysis Indications Rocktype – Sandstone , Shale , Limestone, Dolomite Rock properties – Porosity, Permeability, Resistivity Fluids – Water / Oil / Gas, Saturation 4
  • 5.
    Archie’s Equation Determination ofwater saturation is the primary objective of log analysis Sw = water saturation of the uninvaded zone n = saturation exponent a = tortuosity factor m = cementation exponent Rw = formation water resistivity Rt = true resistivity of the uninvaded zone Ф = porosity n w w m t Ra S R   5
  • 6.
    Archie Water SaturationVariables a : tortuosity factor. m: cementation exponent. n: saturation exponent. usually 2. 6
  • 7.
    Resistivity Fundamental of allmeasurements in logging Resistivity is the physical measurement of resistance Water bearing zones have lower resistivity than hydrocarbon bearing zones If for a given porosity, the measured resistivity is significantly greater than the wet resistivity, then the presence of hydrocarbon is indicated 7
  • 8.
    Porosity Porosity represents fluidstorage capacity of a reservoir. Its defined as ratio of pore space volume to the total bulk volume of the rock Porosity (%) = (pore space volume/bulk space volume)X100 Two kinds of porosity – a) Absolute or Total porosity b) Effective porosity 8
  • 9.
    Permeability Ability of aformation to transmit the fluids it contains through the existing pore network Fundamental requirement of a productive reservoir Empirical law to quantify permeability expressed as: Q L k P A    k is related to: Amount of pore space Diameter of pore throats Type of fluid 9
  • 10.
    Typical Approach forClean Formation 1 •Locate potential water bearing zones on logs & determine their lithology 2 •Select depths at which Rw is to be determined & perform environmental corrections on these data 3 •Determine Rw 4 •Locate potential hydrocarbon bearing zones and determine their lithology 5 •Select depth at which Sw is to be calculated and perform environmental corrections on these data 6 •Correct Rw for temperature at zone of interest 7 •Calculate Sw of the potential hydrocarbon bearing zone by Archie’s equation 10
  • 11.
    Potential Water BearingZones Qualitatively assess intervals in terms of their porosity and resistivity Permeability indicators – Microlog, SP Negative deflections of the SP curve are used as qualitative indicator of permeability Wet zone – high porosity & low resistivity 11 Apply environment corrections to all data to be used in Rw calculation
  • 12.
    Rw Calculation Inverse Archiemethod Assumed that Water Saturation (Sw) is 100% Lithology assumptions made for values of ‘m’ and ‘a’ from GR, Density and Pe curves m t wa R R a    12
  • 13.
    Rw Calculation Rw bySP method Procedure Determine Tf Determine Rmf Determine SSP Determine SP deflection Differentiate between SSP and SP Plot ΔSP Determine Rw 13
  • 14.
    Potential Hydrocarbon BearingZone Qualitatively asses the porosity and resistivity of zones Consider permeability indicators Hydrocarbon presence – high porosity & high resistivity Priority with which a certain zone will be evaluated is determined by its permeability Before calculating Sw of a zone, Rw should be temperature corrected at zone of interest Calculate Sw by Archie’s equation 14
  • 15.
    Essential Calculations Single measuredor calculated values of resistances applied over a wide range of depths Resistivity varies with temperature Geothermal Gradient,   100msBHT T G TDg    Formation Temperature, 100 f ms G D T T g            Correcting resistivity for temperature, 1 2 1 2 T K R R T K        15
  • 16.
    Log Indications Log Indications Caliper-Mudcake presence indicates permeable formation -Caliper log is a permeability indicator SP -Negative deflections of SP indicates permeability -However, absence of deflection doesn’t indicate absence of permeability -Rw determination -Shale volume calculation -Well to well correlation GR -Helps finding permeable layers -Indicates degree of shaliness of a formation. -Lithology identification -Shale volume calculation -Determine bed boundaries -Well to well correlation 16
  • 17.
    Log Indications Log Indications Resistivity-To determine the water saturation using Archie’s equation -Determine hydrocarbon and water bearing zones -Indicate permeable zones Density -Porosity calculation -Lithology identification -True density of rock matrix -Gas detection Neutron -Porosity calculation -Lithology identification -Gas detection 17
  • 18.
    Environmental Corrections Logging toolsare calibrated to operate in specific conditions Factors affecting tool responses – hole size, mud weight, bed thickness, depth of invasion, and other properties of logging environment Depending on tool type & environmental conditions, appropriate charts are used for corrections 18
  • 19.
    Corrections Corrections Needed Reasons SP Bed Thickness (SP-1a,SP-1b) -In relatively thin beds, deflection of SP curve is suppressed because of the influence of underlying and overlying formations -Which chart to use depends on diameter of invasion GR Borehole Corrections (GR-1) -Distance between the tool and the borehole wall -Density of the mud filling the borehole Density (POR-1) -SDL calibrated to read correct bulk density in an 8-inch borehole filled with fresh water -These corrections are performed real time by the logging software Neutron Porosity (POR-4a, POR-4b) -Borehole diameter correction applied real time when any tool with caliper is used in combination. 19
  • 20.
    Sand-Shale Model (withHydrocarbons) 20
  • 21.
  • 22.
    Modes of Occurrenceof Clay Type Occurrence Impact on reservoir Laminated shale -Thin layers of clay minerals -Interbedded with thin layers of sandstone - Tends to reduce porosity & permeability of reservoir Structural clay - Exists as individual grains along with framework grains of a reservoir -Little impact -Doesn’t restrict or block pore throats Dispersed clay -Exists within the pore space of a reservoir -Replaces fluid volume -Blocks pore throats -Reduces effective porosity and permeability 22
  • 23.
    Shale/Clay effects onlog responses Log Type Effects Sonic Porosity -Porosity too high, because TT (shale) > TT (matrix of clean formation) Density -Actual density of formation is volumetric combination of density of clay and sand grains -When p (clay)> p (sand) – overestimated -When p (clay)< p (sand) – underestimated Neutron porosity -Clay minerals are hydrated & contain structurally bound OH- -Reflects additional hydrogen even though not part of pore space -Porosity increases Resistivity -Adds conductance -Clay contain saline water & other ions that decreases resistivity 23
  • 24.
    Combined effect ofShale/Clay Decreased resistivity & typically increased porosity Results in erroneously high values of Sw by Archie Equation Shaly sand analysis corrects these effects & reduce Sw 24
  • 25.
    Procedure of ShalySand Analysis 1 • Determining volume of shale (Vsh) in the zone of interest 2 • Correcting porosity for the presence of clays (determining effective porosity of the zone of interest) 3 • Determining effective water saturation of the zone of interest (water saturation of the effective pore network) 25
  • 26.
    Volume of Shale(Vsh) Determine the amount of clay minerals present in the formation. Estimates of the volume of clay minerals. Do not consider type or distribution. Vsh < 15% of bulk rock volume – assumed clay minerals not having effect on log response – Archie equation Vsh > 15% of bulk rock volume – shaly shale analysis should be performed Many types of logs used either alone or in combination. 26
  • 27.
    Vsh from GammaRay First, calculate GR Index (Igr) log min max min GR GR GR I GR GR    Second, select an equation based on type of distribution Linear, Vsh = Igr Clavier, Vsh = 1.7 – [3.38 – (Igr + 0.7)^2]^0.5 Steiber, Vsh = 0.5x[Igr/(1.5 – Igr)] Choice of equation mainly depends on local knowledge 27
  • 28.
    Vsh from SpontaneousPotential In water bearing sandstones of low to medium resistivity PSP is the amount of SP deflection in the zone of interest SSP is the maximum SP deflection in a clean formation 1.0 PSP Vsh SSP   28
  • 29.
    Vsh from Neutron-DensityLogs Combination of porosity measurements from neutron and density logs is used ( ) ( ) n d sh nsh dsh V        Comparison of Vsh results Vsh should be determined from as many methods as possible Lowest resulting value should be used in determining effective porosity 29
  • 30.
    Determining Effective Porosity Correctingporosity measurements for the presence of clay minerals Фe=ф(1-Vsh) From Sonic logs, From Density logs, From Neutron-Density combinations, log 100ma sh ma e sh fl ma sh fl ma t t t t V t t t t t                         logma ma sh e sh ma fl ma fl V                                   0.52 2 2 2 n corrected n cl nsh d corrected d cl dsh n corrected d corrected e n corrected d corrected e V V                                         30
  • 31.
    Crossplot Method Used tofind effective porosity фe and Vsh from neutron-density logs Vsh=0 at quartz point Vsh=100% at shale point Lines of equal Vsh are parallel to the clean sand line 31
  • 32.
    Crossplot Method Shale lineis фe = 0 Lines with equal фe are parallel to the shale line Effective porosity lines originate at the фe=фn=фd points on sand line 32
  • 33.
    Effective Water Saturation It’sthe percentage of effective porosity occupied by water 33 /2 (1 ( /2)) 1 cl tn we mV ecl cl w R S V R a R    
  • 34.
  • 35.
  • 36.
  • 37.
    Decisions on ProductiveCapability Moveable Hydrocarbon Index (MVI) Bulk Volume Water (BVW) Irreducible Water Saturation Calculation of Reserves 37
  • 38.
    Moveable Hydrocarbon Index(MVI) Ratio of Water Saturation of uninvaded zone to Flushed Zone Water Saturation w xo S MHI S  If MHI<1, then hydrocarbons were likely moved during invasion and the reservoir will produce If MHI≥1, then hydrocarbons were not moved during invasion 38
  • 39.
    Irreducible Water Saturation Valueof Sw at which water in reservoir is either adsorbed onto grain surface or bound within pore network by capillary pressure. If a reservoir is at Swirr, water present will be immovable and production will be water free hydrocarbons 39
  • 40.
    Bulk Volume Water Fractionof rock volume occupied by water wBVW S   If values of BVW remain constant throughout a reservoir, it indicates reservoir is at Swirr 40
  • 41.
    Calculation of Reserves Barrelsof oil in place, Recoverable oil, Cubic Feet of gas in place, Recoverable gas,  7758 1 wN S h A       7758 1 wRF S h A N SF        43560 1 wG S h A           6 1.54 10 1 460 w f RF S h A Pf G GD T          41
  • 42.
    Log Quality Control Logheader Calibration Logging speed Repeat section Correlation with near by well Depth control Log quality control must be performed to ensure that data is suitable for analysis 42
  • 43.