Downloaded 216 times


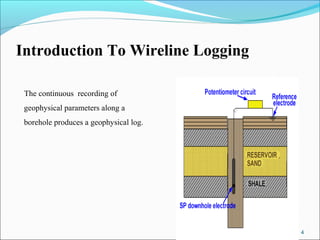
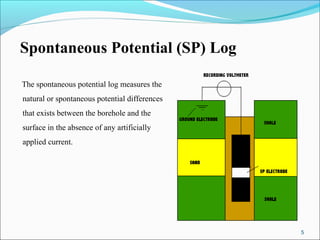
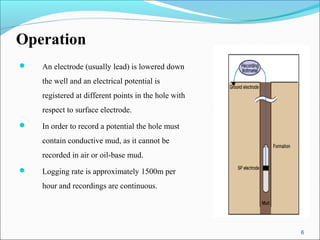
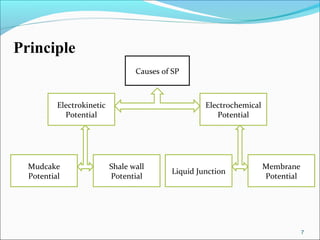
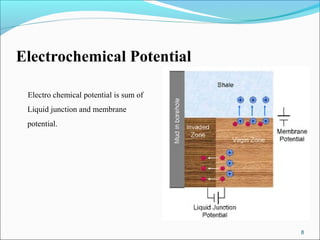
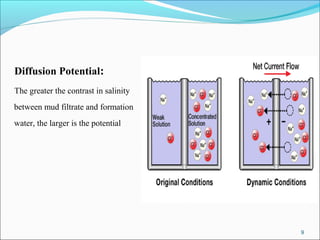
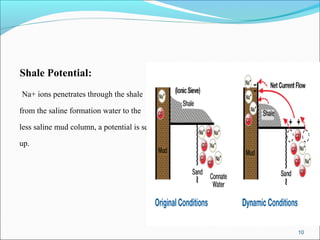
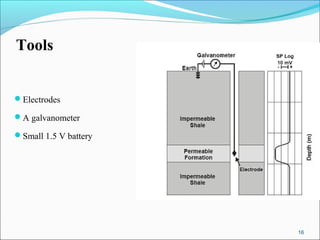
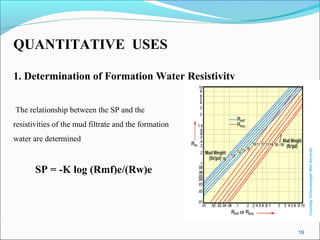
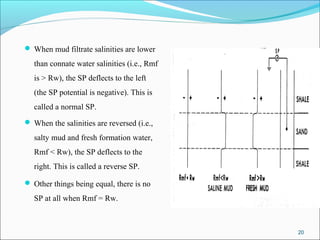


The document explains the concept and operation of the spontaneous potential (SP) log in wireline logging, which measures natural potential differences in boreholes. It details how SP is formed through various electrochemical and diffusion processes and discusses its presentation and applications in determining formation water resistivity and shale volume. Additionally, the document outlines the qualitative uses of SP logs for detecting permeability and correlating geological formations.


![Well logging in_7_ [ SP-log]_052629.pptx](https://cdn.slidesharecdn.com/ss_thumbnails/welllogging7sp-log052629-241002191233-0cab3bab-thumbnail.jpg?width=640&height=640&fit=bounds)


