Downloaded 469 times


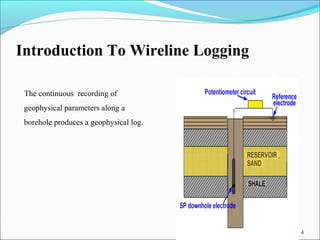
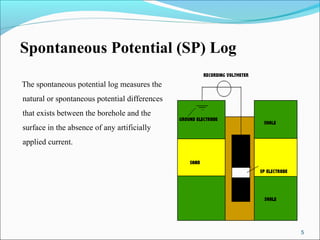
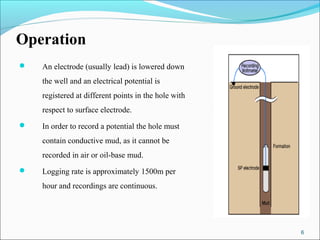
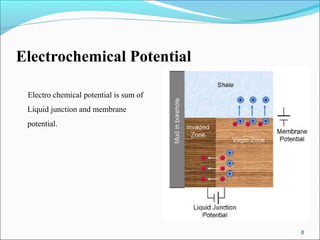
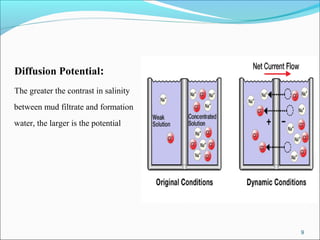
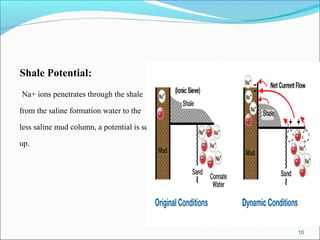
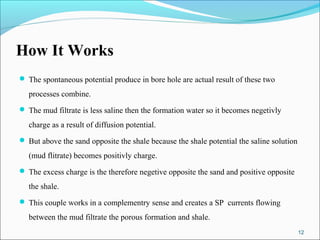
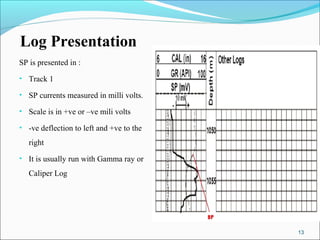
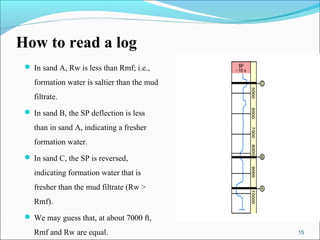
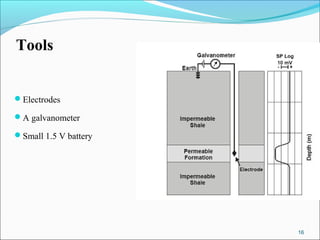
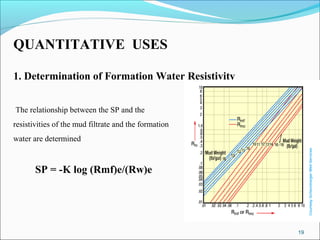
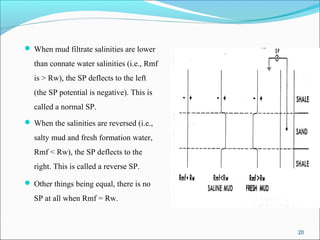
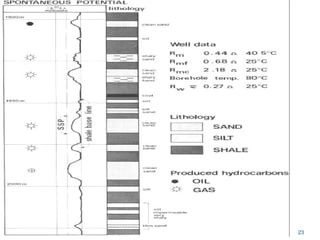
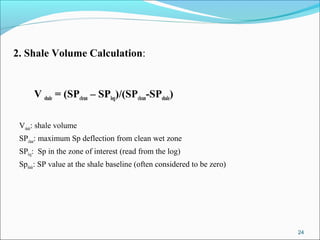
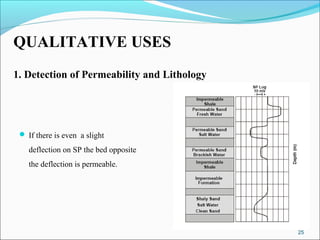
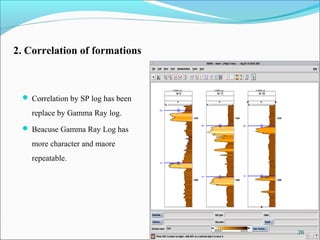
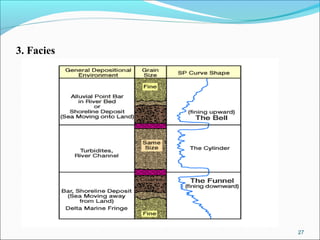


The document provides an overview of spontaneous potential (SP) logging. It discusses that SP logging measures natural electrical potentials between the borehole and surface. Positive deflections indicate fresher formation water than mud filtrate, while negative deflections mean saltier formation water. SP can be used to determine formation water resistivity and estimate shale volume. Key applications include detecting permeable zones, correlating formations, and determining facies.


![Well logging in_7_ [ SP-log]_052629.pptx](https://cdn.slidesharecdn.com/ss_thumbnails/welllogging7sp-log052629-241002191233-0cab3bab-thumbnail.jpg?width=640&height=640&fit=bounds)


