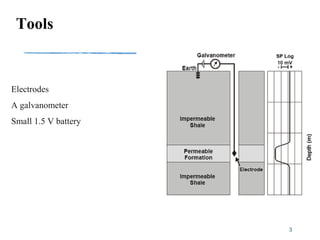
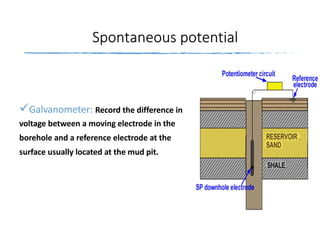
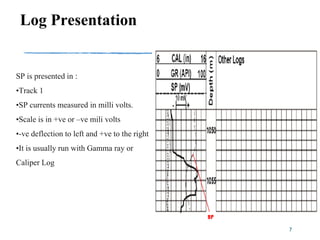
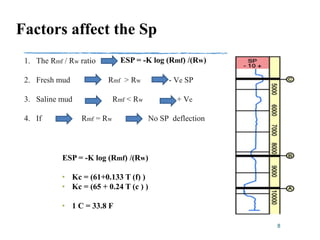
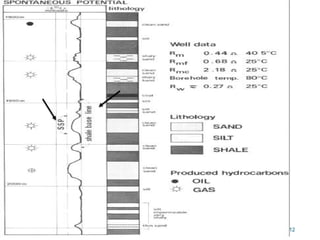
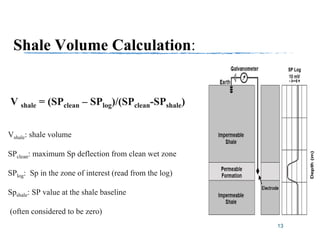
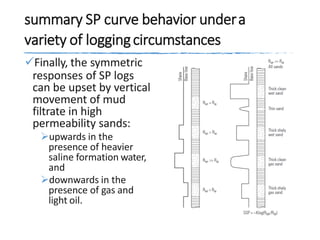
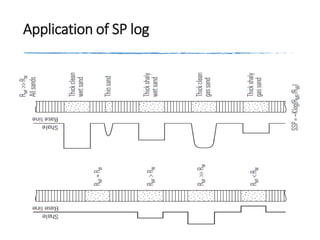
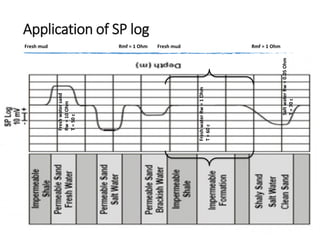
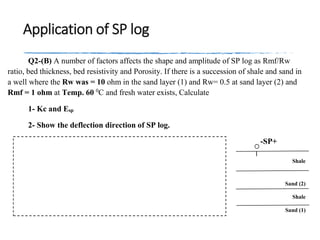
1. The document discusses spontaneous potential (SP) logging, which measures the electrical potential difference between a downhole electrode and a surface reference electrode. SP logs can be used both qualitatively to detect permeable beds and quantitatively to determine formation water resistivity and shale volume.
2. The key factors that affect the SP response are the ratio between mud filtrate resistivity (Rmf) and formation water resistivity (Rw), as well as bed thickness, resistivity, and porosity. Positive deflections occur when Rmf > Rw and negative deflections when Rmf < Rw. No deflection occurs when Rmf = Rw.
3. Examples are given of how to calculate shale
WELL LOG : Types of Logs, The Bore Hole Image, Interpreting Geophysical Well Logs, applications, Production logs, Well Log Classification and Cataloging
The spontaneous potential log, commonly called the self potential log or SP log, is a passive measurement taken by oil industry well loggers to characterise rock
Introduction
Petrophysic of the rocks
It is the study of the physical and chemical properties of the rocks related to the pores and fluid distribution
Porosity, is ratio between volume of void to the total voids of the rock.
Permeability, is ability of a porous material to allow fluids to pass through it.
Electric, most of the sedimentary rocks don’t have conductivity.
Radiation, clay rocks have 40K, radiate alpha ray.
Hardness, it depends on the cementing material and thickness of the sediments.
WELL LOGGING
The systematic recording of rock properties and it’s fluid contents in wells being drilled or produced to obtain various petrophysical parameters and characteristics of down hole sequences (G.E Archie 1950).
The measurement versus depth or time, or both, of one or more physical properties in a well.
These methods are particularly good when surface outcrops are not available, but a direct sample of the rock is needed to be sure of the lithology.
A wide range of physical parameters can be measured.
In some cases, the measurements are not direct, it require interpretation by analogy or by correlating values between two or more logs run in the same hole.
Provide information on lithology, boundaries of formations and stratigraphic correlation.
Determine Porosity, Permeability, water, oil and gas saturation.
Reservoir modeling and Structural studies… etc.
Types of Well Logging
Logs can be classified into several types under different category
Permeability and lithology Logs
Gamma Ray log
Self Potential [SP] log
Caliber log
Porosity Logs
Density log
Sonic log
Neutron log
Electrical Logs
Resistivity Log
For contact : omerupto3@gmail.com
A small presentation about wireline logs, showing their function or the technology that they use.
Ruhr-Universität Bochum, Petroleum Geology II, Winter Semester 2013/2014.
Glover P.W.J, Petrophysics Msc Courses Notes. The Potential Spontaneous. The spontaneous potential log (SP) measures the natural or spontaneous potential difference
(sometimes called self-potential) that exists between the borehole and the surface in the absence of any
artificially applied current
The increased availability of biomedical data, particularly in the public domain, offers the opportunity to better understand human health and to develop effective therapeutics for a wide range of unmet medical needs. However, data scientists remain stymied by the fact that data remain hard to find and to productively reuse because data and their metadata i) are wholly inaccessible, ii) are in non-standard or incompatible representations, iii) do not conform to community standards, and iv) have unclear or highly restricted terms and conditions that preclude legitimate reuse. These limitations require a rethink on data can be made machine and AI-ready - the key motivation behind the FAIR Guiding Principles. Concurrently, while recent efforts have explored the use of deep learning to fuse disparate data into predictive models for a wide range of biomedical applications, these models often fail even when the correct answer is already known, and fail to explain individual predictions in terms that data scientists can appreciate. These limitations suggest that new methods to produce practical artificial intelligence are still needed.
In this talk, I will discuss our work in (1) building an integrative knowledge infrastructure to prepare FAIR and "AI-ready" data and services along with (2) neurosymbolic AI methods to improve the quality of predictions and to generate plausible explanations. Attention is given to standards, platforms, and methods to wrangle knowledge into simple, but effective semantic and latent representations, and to make these available into standards-compliant and discoverable interfaces that can be used in model building, validation, and explanation. Our work, and those of others in the field, creates a baseline for building trustworthy and easy to deploy AI models in biomedicine.
Bio
Dr. Michel Dumontier is the Distinguished Professor of Data Science at Maastricht University, founder and executive director of the Institute of Data Science, and co-founder of the FAIR (Findable, Accessible, Interoperable and Reusable) data principles. His research explores socio-technological approaches for responsible discovery science, which includes collaborative multi-modal knowledge graphs, privacy-preserving distributed data mining, and AI methods for drug discovery and personalized medicine. His work is supported through the Dutch National Research Agenda, the Netherlands Organisation for Scientific Research, Horizon Europe, the European Open Science Cloud, the US National Institutes of Health, and a Marie-Curie Innovative Training Network. He is the editor-in-chief for the journal Data Science and is internationally recognized for his contributions in bioinformatics, biomedical informatics, and semantic technologies including ontologies and linked data.
Multi-source connectivity as the driver of solar wind variability in the heli...Sérgio Sacani
The ambient solar wind that flls the heliosphere originates from multiple
sources in the solar corona and is highly structured. It is often described
as high-speed, relatively homogeneous, plasma streams from coronal
holes and slow-speed, highly variable, streams whose source regions are
under debate. A key goal of ESA/NASA’s Solar Orbiter mission is to identify
solar wind sources and understand what drives the complexity seen in the
heliosphere. By combining magnetic feld modelling and spectroscopic
techniques with high-resolution observations and measurements, we show
that the solar wind variability detected in situ by Solar Orbiter in March
2022 is driven by spatio-temporal changes in the magnetic connectivity to
multiple sources in the solar atmosphere. The magnetic feld footpoints
connected to the spacecraft moved from the boundaries of a coronal hole
to one active region (12961) and then across to another region (12957). This
is refected in the in situ measurements, which show the transition from fast
to highly Alfvénic then to slow solar wind that is disrupted by the arrival of
a coronal mass ejection. Our results describe solar wind variability at 0.5 au
but are applicable to near-Earth observatories.
Earliest Galaxies in the JADES Origins Field: Luminosity Function and Cosmic ...Sérgio Sacani
We characterize the earliest galaxy population in the JADES Origins Field (JOF), the deepest
imaging field observed with JWST. We make use of the ancillary Hubble optical images (5 filters
spanning 0.4−0.9µm) and novel JWST images with 14 filters spanning 0.8−5µm, including 7 mediumband filters, and reaching total exposure times of up to 46 hours per filter. We combine all our data
at > 2.3µm to construct an ultradeep image, reaching as deep as ≈ 31.4 AB mag in the stack and
30.3-31.0 AB mag (5σ, r = 0.1” circular aperture) in individual filters. We measure photometric
redshifts and use robust selection criteria to identify a sample of eight galaxy candidates at redshifts
z = 11.5 − 15. These objects show compact half-light radii of R1/2 ∼ 50 − 200pc, stellar masses of
M⋆ ∼ 107−108M⊙, and star-formation rates of SFR ∼ 0.1−1 M⊙ yr−1
. Our search finds no candidates
at 15 < z < 20, placing upper limits at these redshifts. We develop a forward modeling approach to
infer the properties of the evolving luminosity function without binning in redshift or luminosity that
marginalizes over the photometric redshift uncertainty of our candidate galaxies and incorporates the
impact of non-detections. We find a z = 12 luminosity function in good agreement with prior results,
and that the luminosity function normalization and UV luminosity density decline by a factor of ∼ 2.5
from z = 12 to z = 14. We discuss the possible implications of our results in the context of theoretical
models for evolution of the dark matter halo mass function.
Observation of Io’s Resurfacing via Plume Deposition Using Ground-based Adapt...Sérgio Sacani
Since volcanic activity was first discovered on Io from Voyager images in 1979, changes
on Io’s surface have been monitored from both spacecraft and ground-based telescopes.
Here, we present the highest spatial resolution images of Io ever obtained from a groundbased telescope. These images, acquired by the SHARK-VIS instrument on the Large
Binocular Telescope, show evidence of a major resurfacing event on Io’s trailing hemisphere. When compared to the most recent spacecraft images, the SHARK-VIS images
show that a plume deposit from a powerful eruption at Pillan Patera has covered part
of the long-lived Pele plume deposit. Although this type of resurfacing event may be common on Io, few have been detected due to the rarity of spacecraft visits and the previously low spatial resolution available from Earth-based telescopes. The SHARK-VIS instrument ushers in a new era of high resolution imaging of Io’s surface using adaptive
optics at visible wavelengths.
Slide 1: Title Slide
Extrachromosomal Inheritance
Slide 2: Introduction to Extrachromosomal Inheritance
Definition: Extrachromosomal inheritance refers to the transmission of genetic material that is not found within the nucleus.
Key Components: Involves genes located in mitochondria, chloroplasts, and plasmids.
Slide 3: Mitochondrial Inheritance
Mitochondria: Organelles responsible for energy production.
Mitochondrial DNA (mtDNA): Circular DNA molecule found in mitochondria.
Inheritance Pattern: Maternally inherited, meaning it is passed from mothers to all their offspring.
Diseases: Examples include Leber’s hereditary optic neuropathy (LHON) and mitochondrial myopathy.
Slide 4: Chloroplast Inheritance
Chloroplasts: Organelles responsible for photosynthesis in plants.
Chloroplast DNA (cpDNA): Circular DNA molecule found in chloroplasts.
Inheritance Pattern: Often maternally inherited in most plants, but can vary in some species.
Examples: Variegation in plants, where leaf color patterns are determined by chloroplast DNA.
Slide 5: Plasmid Inheritance
Plasmids: Small, circular DNA molecules found in bacteria and some eukaryotes.
Features: Can carry antibiotic resistance genes and can be transferred between cells through processes like conjugation.
Significance: Important in biotechnology for gene cloning and genetic engineering.
Slide 6: Mechanisms of Extrachromosomal Inheritance
Non-Mendelian Patterns: Do not follow Mendel’s laws of inheritance.
Cytoplasmic Segregation: During cell division, organelles like mitochondria and chloroplasts are randomly distributed to daughter cells.
Heteroplasmy: Presence of more than one type of organellar genome within a cell, leading to variation in expression.
Slide 7: Examples of Extrachromosomal Inheritance
Four O’clock Plant (Mirabilis jalapa): Shows variegated leaves due to different cpDNA in leaf cells.
Petite Mutants in Yeast: Result from mutations in mitochondrial DNA affecting respiration.
Slide 8: Importance of Extrachromosomal Inheritance
Evolution: Provides insight into the evolution of eukaryotic cells.
Medicine: Understanding mitochondrial inheritance helps in diagnosing and treating mitochondrial diseases.
Agriculture: Chloroplast inheritance can be used in plant breeding and genetic modification.
Slide 9: Recent Research and Advances
Gene Editing: Techniques like CRISPR-Cas9 are being used to edit mitochondrial and chloroplast DNA.
Therapies: Development of mitochondrial replacement therapy (MRT) for preventing mitochondrial diseases.
Slide 10: Conclusion
Summary: Extrachromosomal inheritance involves the transmission of genetic material outside the nucleus and plays a crucial role in genetics, medicine, and biotechnology.
Future Directions: Continued research and technological advancements hold promise for new treatments and applications.
Slide 11: Questions and Discussion
Invite Audience: Open the floor for any questions or further discussion on the topic.
THE IMPORTANCE OF MARTIAN ATMOSPHERE SAMPLE RETURN.Sérgio Sacani
The return of a sample of near-surface atmosphere from Mars would facilitate answers to several first-order science questions surrounding the formation and evolution of the planet. One of the important aspects of terrestrial planet formation in general is the role that primary atmospheres played in influencing the chemistry and structure of the planets and their antecedents. Studies of the martian atmosphere can be used to investigate the role of a primary atmosphere in its history. Atmosphere samples would also inform our understanding of the near-surface chemistry of the planet, and ultimately the prospects for life. High-precision isotopic analyses of constituent gases are needed to address these questions, requiring that the analyses are made on returned samples rather than in situ.
Cancer cell metabolism: special Reference to Lactate PathwayAADYARAJPANDEY1
Normal Cell Metabolism:
Cellular respiration describes the series of steps that cells use to break down sugar and other chemicals to get the energy we need to function.
Energy is stored in the bonds of glucose and when glucose is broken down, much of that energy is released.
Cell utilize energy in the form of ATP.
The first step of respiration is called glycolysis. In a series of steps, glycolysis breaks glucose into two smaller molecules - a chemical called pyruvate. A small amount of ATP is formed during this process.
Most healthy cells continue the breakdown in a second process, called the Kreb's cycle. The Kreb's cycle allows cells to “burn” the pyruvates made in glycolysis to get more ATP.
The last step in the breakdown of glucose is called oxidative phosphorylation (Ox-Phos).
It takes place in specialized cell structures called mitochondria. This process produces a large amount of ATP. Importantly, cells need oxygen to complete oxidative phosphorylation.
If a cell completes only glycolysis, only 2 molecules of ATP are made per glucose. However, if the cell completes the entire respiration process (glycolysis - Kreb's - oxidative phosphorylation), about 36 molecules of ATP are created, giving it much more energy to use.
IN CANCER CELL:
Unlike healthy cells that "burn" the entire molecule of sugar to capture a large amount of energy as ATP, cancer cells are wasteful.
Cancer cells only partially break down sugar molecules. They overuse the first step of respiration, glycolysis. They frequently do not complete the second step, oxidative phosphorylation.
This results in only 2 molecules of ATP per each glucose molecule instead of the 36 or so ATPs healthy cells gain. As a result, cancer cells need to use a lot more sugar molecules to get enough energy to survive.
introduction to WARBERG PHENOMENA:
WARBURG EFFECT Usually, cancer cells are highly glycolytic (glucose addiction) and take up more glucose than do normal cells from outside.
Otto Heinrich Warburg (; 8 October 1883 – 1 August 1970) In 1931 was awarded the Nobel Prize in Physiology for his "discovery of the nature and mode of action of the respiratory enzyme.
WARNBURG EFFECT : cancer cells under aerobic (well-oxygenated) conditions to metabolize glucose to lactate (aerobic glycolysis) is known as the Warburg effect. Warburg made the observation that tumor slices consume glucose and secrete lactate at a higher rate than normal tissues.
4. Spontaneous potential
Galvanometer: Record the difference in
voltage between a moving electrode in the
borehole and a reference electrode at the
surface usually located at the mud pit.
5. Application
Two principal uses of Sp Logs :
QUANTITATIVE USES
Formation Water Resistivity (Rw)determination
Shale Volume Indicator
QUALITATIVE USES
Detecting permeable beds
Correlation from well to well
Facies 5
6. Operation
An electrode (usually lead) is lowered down the
well and an electrical potential is registered at
different points in the hole with respect to surface
electrode.
In order to record a potential the hole must contain
conductive mud, as it cannot be recorded in air or
oil-base mud.
Logging rate is approximately 1500m per hour and
recordings are continuous.
6
7. Log Presentation
SP is presented in :
•Track 1
•SP currents measured in milli volts.
•Scale is in +ve or –ve mili volts
•-ve deflection to left and +ve to the right
•It is usually run with Gamma ray or
Caliper Log
7
8. Factors affect the Sp
1. The Rmf / Rw ratio
2. Fresh mud Rmf < Rw - Ve SP
3. Saline mud Rmf > Rw + Ve
4. If Rmf = Rw No SP deflection
8
ESP = -K log (Rmf) /(Rw)
• Kc = (61+0.133 T (f) )
• Kc = (65 + 0.24 T (c ) )
• 1 C = 33.8 F
9. How to read a log
In sand A, Rw is less than Rmf; i.e.,
formation water is saltier than the mud
filtrate.
In sand B, the SP deflection is less than in
sand A, indicating a fresher formation
water.
In sand C, the SP is reversed, indicating
formation water that is fresher than the mud
filtrate (Rw > Rmf).
We may guess that, at about 7000 ft, Rmf
and Rw are equal.
9
10. shale and clean sand beds alongwith
the idealized response of SPlogging
deflections to the left correspond to
increasingly negative values.
In the first sand zone,
there is no SP deflection
since this case represents equal salinity
in the formation water and in the mud
filtrate.
The next two zones
show a development of the SP which is
largest for the largest contrast in mud
filtrate and formation water resistivity.
In the last zone,
the deflection is seen to be to the right
of the shale baseline and corresponds
to the case of a mud filtrate which is
saltier than the original formation fluid.
10
11. Shale Volume Calculation
Shale Base Line
Th definition of s.p zero is made on thick shale intervals where s.p does not move to the
left or right is called shale base line.
Static sp: (ssp)
The theoretical maximum deflection of s.p opposite permeable beds is called static s.p or
ssp. It is maximum possible s.p opposite a permeable water bearing formation with
no shale.
Pseudo SP: (PSP)
Any deflection less than (SSP)
11
13. Shale Volume Calculation:
V shale = (SPclean – SPlog)/(SPclean-SPshale)
Vshale: shale volume
SPclean: maximum Sp deflection from clean wet zone
SPlog: Sp in the zone of interest (read from the log)
Spshale: SP value at the shale baseline
(often considered to be zero)
13
14. summary SP curve behavior undera
variety of loggingcircumstances
Finally, the symmetric
responses of SP logs
can be upset by vertical
movement of mud
filtrate in high
permeability sands:
upwards in the
presence of heavier
saline formation water,
and
downwards in the
presence of gas and
light oil.
17. Q2-(B) A number of factors affects the shape and amplitude of SP log as Rmf/Rw
ratio, bed thickness, bed resistivity and Porosity. If there is a succession of shale and sand in
a well where the Rw was = 10 ohm in the sand layer (1) and Rw= 0.5 at sand layer (2) and
Rmf = 1 ohm at Temp. 60 0
C and fresh water exists, Calculate
1- Kc and Esp
2- Show the deflection direction of SP log.
-SP+
Shale
Sand (2)
Shale
Sand (1)
Application of SP log