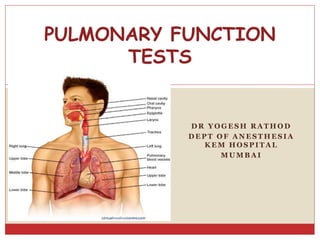
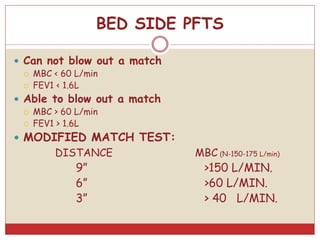
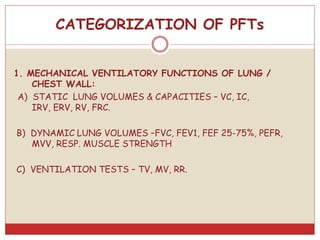
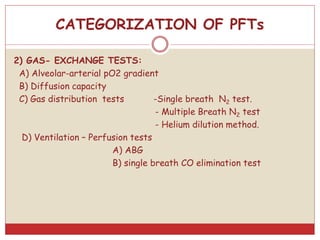
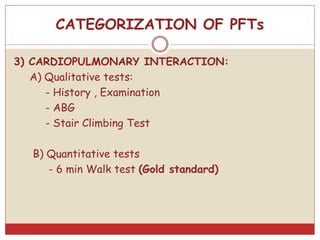
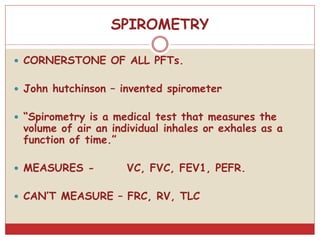
D R Y O G E S H R A T H O D
D E P T O F A N E S T H E S I A
K E M H O S P I T A L
M U M B A I
PULMONARY FUNCTION
TESTS
PULMONARY FUNCTION TESTS
 Includes a wide variety of Objective tests to assess
lung function.
 Provides Standardized measurements for assessing
the presence and severity of Respiratory
dysfunction.
GOALS
 To predict the presence of pulmonary dysfunction
 To know the functional nature of disease
(Obstructive or Restrictive)
 To assess the severity and progression of disease
 To identify patients at Perioperative risk of
Pulmonary complications
INDICATIONS OF PFT IN PAC
TISI GUIDELINES FOR PREOPERATIVE SPIROMETRY
 Age > 70 yrs.
 Morbid obesity
 Thoracic surgery
 Upper abdominal surgery
 Smoking history and cough
 Any pulmonary disease
INDICATIONS FOR PREOPERATIVE
SPIROMETRY
 ACP GUIDELINES FOR PREOPERATIVE
SPIROMETRY
 Lung resection
 H/o smoking, dyspnoea
 Cardiac surgery
 Upper abdominal surgery
 Lower abdominal surgery
 Uncharacterized pulmonary disease
(defined as history of pulmonary Disease or symptoms
and no PFT in last 60 days)
Lung Volumes and Capacities
 Four Lung volumes:
Tidal volume
Inspiratory reserve volume
Expiratory reserve volume
Residual volume
 Five capacities:
Inspiratory capacity
Expiratory capacity
Vital capacity
Functional residual capacity
Total lung capacity
Addition of 2 or more Volumes comprises a Capacity.
TIDAL VOLUME (TV)
 Volume of air inhaled/
exhaled in each breath
during quite respiration.
 N – ~6-8 ml/kg.
 TV FALLS WITH-
1. Decrease in compliance
2. Decreased ventilatory
muscle strength
INSPIRATORY RESERVE VOLUME (IRV)
 Maximum volume of air
which can be Inspired
after a Normal Tidal
inspiration i.e. from end
inspiration point.
 N- 1900 ml- 3300 ml.
EXPIRATORY RESERVE VOLUME (ERV)
 Maximum Volume of air
which can be expired
after a normal tidal
expiration i.e.
from end expiration
point
 N- 700 ml – 1000 ml
RESIDUAL VOLUME (RV)
 Volume of air remaining in
the lungs after a maximum
expiration.
 N- 20-25ml/kg
(1700- 2100 ml)
 Indirectly measured-
FRC-ERV
 Cannot be measured by
Spirometry
INSPIRATORY CAPACITY (IC)
 Maximum volume of air
which can be inspired
after a normal tidal
expiration.
 IC = TV + IRV
 N-2400 ml – 3800 ml
 Detects extrathoracic
airway obstruction
 Changes parallel changes in
VC
VITAL CAPACITY (VC)
 Maximum volume of air
expired after a maximum
Inspiration
 VC= TV+ERV+IRV
 N- 3100ml-4800ml
(60-70 ml/kg)
VITAL CAPACITY- CONTD
 Coined by John Hutchinson
 VC is considered abnormal if ≤ 80% of predicted value
 Factors Influencing VC
 PHYSIOLOGICAL :
 Physical dimensions- directly proportional to height
 SEX – More in males : large chest size, more muscle
power.
 AGE – decreases with increasing age
 STRENGTH OF RESPIRATORY MUSCLES
 POSTURE – decreases in supine position
 PREGNANCY- unchanged or increases by 10%
( increase in AP diameter in pregnancy)
FACTORS DECREASING VC
1. Alteration in muscle power- d/t drugs, n-m
diseases.
2. Pulmonary diseases – pneumonia, chronic
bronchitis, asthma, fibrosis, emphysema,
pulmonary edema,.
3. Space occupying lesions in chest- tumours,
pleural/pericardial effusion, kyphoscoliosis
4. Abdominal tumours, ascites.
5. Depression of respiration : Opioids/ Volatile
agents
6. Abdominal Splinting – Abdominal binders,
tight bandages, hip spica.
7.Abdominal pain – decreases by 50% & 75% in
lower & upper abdominal Surgeries respectively.
8. Posture
DIFFERENT POSTURES AFFECTING VC
POSITION DECREASE IN VC
TREDELENBERG 14.5%
LITHOTOMY 18%
PRONE 10%
RT LATERAL 12%
LT LATERAL 10%
CLINICAL SIGNIFICANCE OF VC
VC correlates with capability for deep
breathing and effective cough.
So in Post Operative period if VC falls below 3
times TV– Artificial Respiration is needed to
maintain airway clear of secretions.
FUNCTIONAL RESIDUAL CAPACITY (FRC)
 Volume of air remaining in the lungs after normal
tidal expiration.
 N- 2300ml -3300ml or 30-35 ml/kg
 FRC = RV + ERV
 Decreases under anaesthesia-
-With Spontaneous Respiration – decreases by 20%
-With paralysis – decreases by 16%
FACTORS AFFECTING FRC
 FRC increases with-
Increased height
Erect position (30% more than in supine)
Decreased lung recoil (e.G. Emphysema)- Gas Trapping
 FRC decreases with-
Obesity
Muscle paralysis (especially in supine)
Supine position
Pleural Effusion
Restrictive lung disease (e.G. Fibrosis, pregnancy)
Anaesthesia
FRC does NOT change with age.
FUNCTIONS OF FRC
Oxygen store
Buffer for maintaining a steady arterial po2
Partial inflation helps prevent atelectasis
Minimise the work of breathing
Minimise pulmonary vascular resistance
Minimised V/Q mismatch
Keep airway resistance low
TOTAL LUNG CAPACITY (TLC)
Maximum volume of air attained in lungs after
maximal inspiration.
N- 4000ml-6000ml or 80-100 ml/kg
TLC= VC + RV
DEFINITIONS
1. Forced Vital Capacity(FVC)-
Max vol. of air which can be expired out as forcefully and rapidly
as possible, following a maximal inspiration.
 Normal healthy subjects have VC = FVC.
2. FORCED VITAL CAPACITY IN 1 SEC. (FEV1)-
Forced expired volume in 1 sec during FVC maneuver.
 Expressed as an absolute value or % of FVC
 N- FEV1 (1 SEC)- 75-85% OF FVC
 FEV2 (2 SEC)- 94% OF FVC
 FEV3 (3 SEC)- 97% OF FVC
CLINICAL RANGE(FEV1) PATIENT GROUP
 3 - 4.5 L
 1.5 – 2.5 L
 <1 L
 0.8 L
 0.5 L
 NORMAL ADULT
 MILD.OBSTRUCTION
 MOD.OBSTRUCTION
 HANDICAPPED
 DISABILITY
 SEVERE EMPHYSEMA
 FEV1 – Decreased in both obstructive & restrictive lung
disorders.
 FEV1/FVC – Reduced in obstructive disorders.
 NORMAL VALUE (FEV1/FVC) 75 – 85 %
 < 70% of predicted value – Mild obstruction
 < 60% of predicted value – Moderate obstruction
 < 50% of predicted value – Severe obstruction
DISEASE
STATES
FVC FEV1 FEV1/FVC
1) OBSTRUCTIVE NORMAL ↓ ↓
2) STIFF LUNGS ↓ ↓ NORMAL
3 ) RESP.
MUSCLE
WEAKNESS
↓ ↓ NORMAL
PEAK EXPIRATORY FLOW RATE (PEFR)
 It is the maximum flow rate during FVC maneuver in
the initial 0.1 sec.
 Normal value in young adults (<40 yrs)= 500l/min
 Clinical significance - values of <200l/min- impaired
coughing & hence likelihood of post-op complication
FORCED MID-EXPIRATORY FLOW RATE
(FEF25%-75%):
 Maximum flow rate during the mid-expiratory part of
FVC maneuver.
 value – 4.5-5 l/sec. Or 300 l/min.
 CLINICAL SIGNIFICANCE: SENSITIVE & IST
INDICATOR OF OBSTRUCTION OF SMALL
DISTAL AIRWAYS
MAXIMUM BREATHING CAPACITY:
(MBC/MVV)
 Largest volume that can be breathed per minute by
voluntary effort , as hard & as fast as possible.
 N – 150-175 l/min.
 Measured for 12 secs – extrapolated for 1 min.
MVV(max voluntary ventilation) = FEV1 X 35
 Discrepancy b/w FEV1 and MVV means inconsistent /
submaximal inspiratory effort
 MBC/MVV altered by- airway resistance
- Elastic property
-Muscle strength
- Learning
- Coordination
- Motivation
BED SIDE PFTS
1) Sabrasez breath holding test:
• Ask the patient to take a full but not too deep breath & hold it as
long as possible.
- >25 SEC.- NORMAL Cardiopulmonary Reserve (CPR)
- 15-25 SEC- LIMITED CPR
- <15 SEC- VERY POOR CPR (Contraindication for elective surgery)
25- 30 SEC - 3500 ml VC (normal-3100-4800ml)
20 – 25 SEC - 3000 ml VC
15 - 20 SEC - 2500 ml VC
10 - 15 SEC - 2000 ml VC
5 - 10 SEC - 1500 ml VC
2) Single breath count:
After deep breath, hold it and start counting
till the next breath.
Indicates vital capacity
N- 30-40 COUNT
BED SIDE PFTS
3) SCHNEIDER’S MATCH BLOWING TEST:
(MEASURES Maximum Breathing Capacity)
Ask the patient to blow a match stick from a
distance of 6” (15 cms) with-
 Mouth wide open
 Chin rested/supported
 No purse lipping
 No head movement
 No air movement in the room
 Mouth and match at the same level
BED SIDE PFTS
 Can not blow out a match
 MBC < 60 L/min
 FEV1 < 1.6L
 Able to blow out a match
 MBC > 60 L/min
 FEV1 > 1.6L
 MODIFIED MATCH TEST:
DISTANCE MBC (N-150-175 L/min)
9” >150 L/MIN.
6” >60 L/MIN.
3” > 40 L/MIN.
BED SIDE PFTS
4) COUGH TEST: DEEP BREATH F/BY COUGH
 ABILITY TO COUGH
 STRENGTH
 EFFECTIVENESS
-VC ~ 3 TIMES TV FOR EFFECTIVE COUGH.
A wet productive cough / self propagated paroxysms of coughing –
patient susceptible for pulmonary Complication.
5) WHEEZE TEST :
 Patient asked to take 5 deep breaths, then auscultated between
shoulder blades to check presence or absence of wheeze.
BED SIDE PFTS
6) FORCED EXPIRATORY TIME:
After deep breath, exhale maximally and forcefully & keep
stethoscope over trachea & listen.
N FET – 3-5 SECS.
OBS.LUNG DIS. - > 6 SEC
RES. LUNG DIS.- < 3 SEC
7) DEBONOs WHISTLE BLOWING TEST: MEASURES PEFR.
Patient blows down a wide bore tube at the end of which is a
whistle, on the side is a hole with adjustable knob.
As subject blows → whistle blows, leak hole is gradually increased
till the intensity of whistle disappears.
At the last position at which the whistle can be blown , the PEFR
can be read off the scale.
BED SIDE PFTS
DEBONO’S WHISTLE
8) Wright Respirometer : measures TV, MV
 Simple and rapid
 Can be connected to endotracheal tube
or face mask
 Prior explanation to patients needed.
 Ideally done in sitting position
 MV- instrument records for 1 min and reads directly.
 TV-calculated by dividing MV by counting Respiratory Rate.
9) BED SIDE PULSE OXIMETRY
10) ABG.
CATEGORIZATION OF PFTs
1. MECHANICAL VENTILATORY FUNCTIONS OF LUNG /
CHEST WALL:
A) STATIC LUNG VOLUMES & CAPACITIES – VC, IC,
IRV, ERV, RV, FRC.
B) DYNAMIC LUNG VOLUMES –FVC, FEV1, FEF 25-75%, PEFR,
MVV, RESP. MUSCLE STRENGTH
C) VENTILATION TESTS – TV, MV, RR.
2) GAS- EXCHANGE TESTS:
A) Alveolar-arterial pO2 gradient
B) Diffusion capacity
C) Gas distribution tests -Single breath N2 test.
- Multiple Breath N2 test
- Helium dilution method.
D) Ventilation – Perfusion tests
A) ABG
B) single breath CO elimination test
CATEGORIZATION OF PFTs
3) CARDIOPULMONARY INTERACTION:
A) Qualitative tests:
- History , Examination
- ABG
- Stair Climbing Test
B) Quantitative tests
- 6 min Walk test (Gold standard)
CATEGORIZATION OF PFTs
SPIROMETRY
 CORNERSTONE OF ALL PFTs.
 John hutchinson – invented spirometer
 “Spirometry is a medical test that measures the
volume of air an individual inhales or exhales as a
function of time.”
 MEASURES - VC, FVC, FEV1, PEFR.
 CAN’T MEASURE – FRC, RV, TLC
Flow-Volume Curves and Spirograms
 Two ways to record results of FVC maneuver:
 Flow-volume curve--- Flow meter measures flow rate in
L/s upon exhalation; Flow plotted as Function of Volume
 Classic Spirogram---Volume as a Function of Time
Measurements Obtained from the FVC Curve
 FEV1---the volume exhaled during the first second of the FVC
maneuver
 FEF 25-75%---the mean expiratory flow during the middle half
of the FVC maneuver; reflects flow through the small (<2 mm in
diameter) airways
 FEV1/FVC---the ratio of FEV1 to FVC X 100 (expressed as a
percent); an important value because a reduction of this ratio
from expected values is specific for obstructive rather than
restrictive diseases
OBSTRUCTIVE DISORDERS RESTRICTIVE DISORDERS
 Limitation of expiratory
airflow as airways cannot
empty as rapidly compared
to normal (e.g. narrowed
airways from bronchospasm,
inflammation, etc.)
Examples:
 Asthma
 Emphysema
 Cystic Fibrosis
 Characterized by reduced
lung volumes/decreased lung
compliance
Examples:
 Interstitial Fibrosis
 Scoliosis
 Obesity
 Lung Resection
 Neuromuscular diseases
 Cystic Fibrosis
Spirometry Interpretation:
Obstructive vs. Restrictive Defect
 Obstructive Disorders
 FVC normal or ↓
 FEV1 ↓
 FEF25-75% ↓
 FEV1/FVC ↓
 TLC normal or ↑
 Restrictive Disorders
 FVC ↓
 FEV1 ↓
 FEF 25-75% normal to ↓
 FEV1/FVC normal to ↑
 TLC ↓
Normal vs. Obstructive vs. Restrictive
Spirometry Interpretation:
What do the numbers mean?
FVC
 Interpretation of %
predicted:
 80-120% Normal
 70-79% Mild reduction
 50%-69% Moderate
reduction
 <50% Severe reduction
FEV1
 Interpretation of %
predicted:
 >75% Normal
 60%-75% Mild obstruction
 50-59% Moderate
obstruction
 <49% Severe obstruction
FEF 25-75%
 Interpretation of %
predicted:
 >79% Normal
 60-79% Mild obstruction
 40-59% Moderate
obstruction
 <40% Severe obstruction
FEV1/FVC
 Interpretation of absolute
value:
 80 or Higher
Normal
 79 or Lower
Abnormal
Spirometry Interpretation:
What do the numbers mean?
Lung Volumes and Obstructive and Restrictive Disease?
MEASUREMENTS OF VOLUMES
 TLC, RV, FRC – MEASURED USING
Nitrogen washout method
Inert gas (helium) dilution method
Total body plethysmography
1) N2 WASH OUT METHOD
 Patient breathes in 100% oxygen and on expiration all nitrogen
is washed out.
 The exhaled volume and nitrogen conc. in it is measured.
 The difference in nitrogen volume at the initial concentration
and at the final exhaled concentration allows a calcul;ation of
the intrathoracic volume, usually the FRC
2) HELIUM DILUTION METHOD:
Patient breathes in and out of a spirometer filled with 10% helium
and 90% O2, till conc. in spirometer and lung becomes same
(equilibirium) as no helium is lost; (as He is insoluble in blood)
C1 X V1 = C2 ( V1 + V2)
V2 = V1 ( C1 – C2)
C2
V1= VOL. OF SPIROMETER
V2= FRC
C1= Conc.of He in the spirometer before equilibrium
C2 = Conc, of He in the spirometer after equilibrium
3) TOTAL BODY PLETHYSMOGRAPHY
Subject sits in an air tight box. At the end of normal exhalation –
shuttle of mouthpiece closed and pt. is asked to make resp.
efforts. As subject inhales – expands gas volume in the lung so
lung vol. increases and box pressure rises and box vol.
decreases.
BOYLE’S LAW:
PV = CONSTANT (at constant temp.)
For Box – p1v1 = p2 (v1- ∆v)
For Subject – p3 x v2 =p4 (v2 - ∆v)
P1- initial box pr. P2- final box pr.
V1- initial box vol. ∆ v- change in box vol.
P3- initial mouth pr., p4- final mouth pr.
V2- FRC
MEASUREMENT OF AIRWAY RESISTANCE
1) Body Plethysmography
2) Forced expiratory maneuvers:
 Peak expiratory flow (PEFR)
FEV1
3) Response to bronchodilators (FEV1)
 Patients with small airway obstruction tested twice-
before and after administration of bronchodilators to
evaluate responsiveness.
 If 2 out of 3 measurements improve, patient has a
reversible airway obstruction that is responsive to
medication.
1) FVC- increase of 10% or more
2) FEV1- increase of 200ml or 15% of baseline
3) FEF25%-75%- increase of 20% or more
Spirometry Pre and Post Bronchodilator
FLOW VOLUME LOOPS
 Do FVC maneuver and then inhale as rapidly and as
much as possible
 This makes an Inspiratory curve.
 The Expiratory and Inspiratory Flow Volume Curves
put together make a Flow Volume Loop.
TESTS FOR GAS EXCHANGE FUNCTION
1) ALVEOLAR-ARTERIAL O2 TENSION GRADIENT:
 Sensitive indicator of detecting regional V/Q inequality
 Normal value in young adult at room air = 8-25 mm Hg.
 Abnormal high values at room air is seen in
asymptomatic smokers & chr. Bronchitis.
2)DIFFUSING CAPACITY OF LUNG:
- defined as the rate at which gas enters into blood.
 DL IS MEASURED BY USING CO:
A) High affinity for Hb which is approx. 200 times
that of O2 , so does not rapidly build up in plasma
B) Under N condition it has low blood conc ≈ 0
C) Therefore, pulm conc.≈0
 Pt inspires a dilute mixture of CO and hold the
breath for 10 secs.
 CO taken up is determined by infrared analysis:
DLCO = CO ml/min/mmHg
PACO – PaCO
 N range 20- 30 ml/min./mmhg
SINGLE BREATH TEST USING CO
DLCO decreases in-
 Emphysema, lung resection, Pul. Embolism, Anaemia
 Pulmonary fibrosis, sarcoidosis- increased thickness
DLCO increases in:
(Cond. Which increase pulmonary blood flow)
 Supine position
 Exercise
 Obesity
 L-R shunt
TESTS FOR CARDIOPLULMONARY INTERACTIONS
 Reflect gas exchange, ventilation, tissue O2, CO2.
 QUALITATIVE-
History, examination, ABG, Stair climbing test
 QUANTITATIVE- 6 minute walk test
 1) STAIR CLIMBING TEST:
 If able to climb 3 flights of stairs without stopping/dyspnoea - ↓ed
morbidity & mortality
 If not able to climb 2 flights – high risk
 2) 6 MINUTE WALK TEST:
- Gold standard
- C.P. reserve is measured by estimating max. O2 uptake during
exercise
- Modified if pt. can’t walk – bicycle/ arm exercises
- If pt. is able to walk for >2000 feet during 6 min
- VO2 max > 15 ml/kg/min
- If 1080 feet in 6 mins : VO2 of 12ml/kg/min
- Simultaneously oximetry is done & if Spo2 falls >4%- high risk
PREDICTION OF POSTOPERATIVE PULMONARY
COMPLICATIONS
 1) Nunn and Miledge criteria:
a. FEV1<1L, N PaO2, PaCO2- Low risk of POPC
b. FEV1<1L, Low PaO2, N PaCO2- patient will need prolonged
O2 supplementation
c. FEV1<1L, Low PaO2, High PaCO2- patient may need postop
ventilation
 2) Based on Spirometry:
a. Predicted FVC< 50%
b. Predicted FEV1 < 50% or <2 L
c. Predicted MVV <50% or < 50L/min
PATIENT WITHOUT CHEST OPTIMIZATION FOR
GENERAL ANESTHESIA IS AN EXTRA BURDON
ON ANESTHETIST…….!
Thanks! Any Questions?

Pulmonary function test

  • 1.
    D R YO G E S H R A T H O D D E P T O F A N E S T H E S I A K E M H O S P I T A L M U M B A I PULMONARY FUNCTION TESTS
  • 2.
    PULMONARY FUNCTION TESTS Includes a wide variety of Objective tests to assess lung function.  Provides Standardized measurements for assessing the presence and severity of Respiratory dysfunction.
  • 3.
    GOALS  To predictthe presence of pulmonary dysfunction  To know the functional nature of disease (Obstructive or Restrictive)  To assess the severity and progression of disease  To identify patients at Perioperative risk of Pulmonary complications
  • 4.
    INDICATIONS OF PFTIN PAC TISI GUIDELINES FOR PREOPERATIVE SPIROMETRY  Age > 70 yrs.  Morbid obesity  Thoracic surgery  Upper abdominal surgery  Smoking history and cough  Any pulmonary disease
  • 5.
    INDICATIONS FOR PREOPERATIVE SPIROMETRY ACP GUIDELINES FOR PREOPERATIVE SPIROMETRY  Lung resection  H/o smoking, dyspnoea  Cardiac surgery  Upper abdominal surgery  Lower abdominal surgery  Uncharacterized pulmonary disease (defined as history of pulmonary Disease or symptoms and no PFT in last 60 days)
  • 6.
    Lung Volumes andCapacities  Four Lung volumes: Tidal volume Inspiratory reserve volume Expiratory reserve volume Residual volume  Five capacities: Inspiratory capacity Expiratory capacity Vital capacity Functional residual capacity Total lung capacity Addition of 2 or more Volumes comprises a Capacity.
  • 8.
    TIDAL VOLUME (TV) Volume of air inhaled/ exhaled in each breath during quite respiration.  N – ~6-8 ml/kg.  TV FALLS WITH- 1. Decrease in compliance 2. Decreased ventilatory muscle strength
  • 9.
    INSPIRATORY RESERVE VOLUME(IRV)  Maximum volume of air which can be Inspired after a Normal Tidal inspiration i.e. from end inspiration point.  N- 1900 ml- 3300 ml.
  • 10.
    EXPIRATORY RESERVE VOLUME(ERV)  Maximum Volume of air which can be expired after a normal tidal expiration i.e. from end expiration point  N- 700 ml – 1000 ml
  • 11.
    RESIDUAL VOLUME (RV) Volume of air remaining in the lungs after a maximum expiration.  N- 20-25ml/kg (1700- 2100 ml)  Indirectly measured- FRC-ERV  Cannot be measured by Spirometry
  • 12.
    INSPIRATORY CAPACITY (IC) Maximum volume of air which can be inspired after a normal tidal expiration.  IC = TV + IRV  N-2400 ml – 3800 ml  Detects extrathoracic airway obstruction  Changes parallel changes in VC
  • 13.
    VITAL CAPACITY (VC) Maximum volume of air expired after a maximum Inspiration  VC= TV+ERV+IRV  N- 3100ml-4800ml (60-70 ml/kg)
  • 14.
    VITAL CAPACITY- CONTD Coined by John Hutchinson  VC is considered abnormal if ≤ 80% of predicted value  Factors Influencing VC  PHYSIOLOGICAL :  Physical dimensions- directly proportional to height  SEX – More in males : large chest size, more muscle power.  AGE – decreases with increasing age  STRENGTH OF RESPIRATORY MUSCLES  POSTURE – decreases in supine position  PREGNANCY- unchanged or increases by 10% ( increase in AP diameter in pregnancy)
  • 15.
    FACTORS DECREASING VC 1.Alteration in muscle power- d/t drugs, n-m diseases. 2. Pulmonary diseases – pneumonia, chronic bronchitis, asthma, fibrosis, emphysema, pulmonary edema,. 3. Space occupying lesions in chest- tumours, pleural/pericardial effusion, kyphoscoliosis 4. Abdominal tumours, ascites.
  • 16.
    5. Depression ofrespiration : Opioids/ Volatile agents 6. Abdominal Splinting – Abdominal binders, tight bandages, hip spica. 7.Abdominal pain – decreases by 50% & 75% in lower & upper abdominal Surgeries respectively. 8. Posture
  • 17.
    DIFFERENT POSTURES AFFECTINGVC POSITION DECREASE IN VC TREDELENBERG 14.5% LITHOTOMY 18% PRONE 10% RT LATERAL 12% LT LATERAL 10%
  • 18.
    CLINICAL SIGNIFICANCE OFVC VC correlates with capability for deep breathing and effective cough. So in Post Operative period if VC falls below 3 times TV– Artificial Respiration is needed to maintain airway clear of secretions.
  • 19.
    FUNCTIONAL RESIDUAL CAPACITY(FRC)  Volume of air remaining in the lungs after normal tidal expiration.  N- 2300ml -3300ml or 30-35 ml/kg  FRC = RV + ERV  Decreases under anaesthesia- -With Spontaneous Respiration – decreases by 20% -With paralysis – decreases by 16%
  • 20.
    FACTORS AFFECTING FRC FRC increases with- Increased height Erect position (30% more than in supine) Decreased lung recoil (e.G. Emphysema)- Gas Trapping  FRC decreases with- Obesity Muscle paralysis (especially in supine) Supine position Pleural Effusion Restrictive lung disease (e.G. Fibrosis, pregnancy) Anaesthesia FRC does NOT change with age.
  • 21.
    FUNCTIONS OF FRC Oxygenstore Buffer for maintaining a steady arterial po2 Partial inflation helps prevent atelectasis Minimise the work of breathing Minimise pulmonary vascular resistance Minimised V/Q mismatch Keep airway resistance low
  • 22.
    TOTAL LUNG CAPACITY(TLC) Maximum volume of air attained in lungs after maximal inspiration. N- 4000ml-6000ml or 80-100 ml/kg TLC= VC + RV
  • 23.
    DEFINITIONS 1. Forced VitalCapacity(FVC)- Max vol. of air which can be expired out as forcefully and rapidly as possible, following a maximal inspiration.  Normal healthy subjects have VC = FVC. 2. FORCED VITAL CAPACITY IN 1 SEC. (FEV1)- Forced expired volume in 1 sec during FVC maneuver.  Expressed as an absolute value or % of FVC  N- FEV1 (1 SEC)- 75-85% OF FVC  FEV2 (2 SEC)- 94% OF FVC  FEV3 (3 SEC)- 97% OF FVC
  • 24.
    CLINICAL RANGE(FEV1) PATIENTGROUP  3 - 4.5 L  1.5 – 2.5 L  <1 L  0.8 L  0.5 L  NORMAL ADULT  MILD.OBSTRUCTION  MOD.OBSTRUCTION  HANDICAPPED  DISABILITY  SEVERE EMPHYSEMA
  • 25.
     FEV1 –Decreased in both obstructive & restrictive lung disorders.  FEV1/FVC – Reduced in obstructive disorders.  NORMAL VALUE (FEV1/FVC) 75 – 85 %  < 70% of predicted value – Mild obstruction  < 60% of predicted value – Moderate obstruction  < 50% of predicted value – Severe obstruction
  • 26.
    DISEASE STATES FVC FEV1 FEV1/FVC 1)OBSTRUCTIVE NORMAL ↓ ↓ 2) STIFF LUNGS ↓ ↓ NORMAL 3 ) RESP. MUSCLE WEAKNESS ↓ ↓ NORMAL
  • 27.
    PEAK EXPIRATORY FLOWRATE (PEFR)  It is the maximum flow rate during FVC maneuver in the initial 0.1 sec.  Normal value in young adults (<40 yrs)= 500l/min  Clinical significance - values of <200l/min- impaired coughing & hence likelihood of post-op complication
  • 28.
    FORCED MID-EXPIRATORY FLOWRATE (FEF25%-75%):  Maximum flow rate during the mid-expiratory part of FVC maneuver.  value – 4.5-5 l/sec. Or 300 l/min.  CLINICAL SIGNIFICANCE: SENSITIVE & IST INDICATOR OF OBSTRUCTION OF SMALL DISTAL AIRWAYS
  • 29.
    MAXIMUM BREATHING CAPACITY: (MBC/MVV) Largest volume that can be breathed per minute by voluntary effort , as hard & as fast as possible.  N – 150-175 l/min.  Measured for 12 secs – extrapolated for 1 min. MVV(max voluntary ventilation) = FEV1 X 35  Discrepancy b/w FEV1 and MVV means inconsistent / submaximal inspiratory effort  MBC/MVV altered by- airway resistance - Elastic property -Muscle strength - Learning - Coordination - Motivation
  • 30.
    BED SIDE PFTS 1)Sabrasez breath holding test: • Ask the patient to take a full but not too deep breath & hold it as long as possible. - >25 SEC.- NORMAL Cardiopulmonary Reserve (CPR) - 15-25 SEC- LIMITED CPR - <15 SEC- VERY POOR CPR (Contraindication for elective surgery) 25- 30 SEC - 3500 ml VC (normal-3100-4800ml) 20 – 25 SEC - 3000 ml VC 15 - 20 SEC - 2500 ml VC 10 - 15 SEC - 2000 ml VC 5 - 10 SEC - 1500 ml VC
  • 31.
    2) Single breathcount: After deep breath, hold it and start counting till the next breath. Indicates vital capacity N- 30-40 COUNT BED SIDE PFTS
  • 32.
    3) SCHNEIDER’S MATCHBLOWING TEST: (MEASURES Maximum Breathing Capacity) Ask the patient to blow a match stick from a distance of 6” (15 cms) with-  Mouth wide open  Chin rested/supported  No purse lipping  No head movement  No air movement in the room  Mouth and match at the same level BED SIDE PFTS
  • 33.
     Can notblow out a match  MBC < 60 L/min  FEV1 < 1.6L  Able to blow out a match  MBC > 60 L/min  FEV1 > 1.6L  MODIFIED MATCH TEST: DISTANCE MBC (N-150-175 L/min) 9” >150 L/MIN. 6” >60 L/MIN. 3” > 40 L/MIN. BED SIDE PFTS
  • 34.
    4) COUGH TEST:DEEP BREATH F/BY COUGH  ABILITY TO COUGH  STRENGTH  EFFECTIVENESS -VC ~ 3 TIMES TV FOR EFFECTIVE COUGH. A wet productive cough / self propagated paroxysms of coughing – patient susceptible for pulmonary Complication. 5) WHEEZE TEST :  Patient asked to take 5 deep breaths, then auscultated between shoulder blades to check presence or absence of wheeze. BED SIDE PFTS
  • 35.
    6) FORCED EXPIRATORYTIME: After deep breath, exhale maximally and forcefully & keep stethoscope over trachea & listen. N FET – 3-5 SECS. OBS.LUNG DIS. - > 6 SEC RES. LUNG DIS.- < 3 SEC 7) DEBONOs WHISTLE BLOWING TEST: MEASURES PEFR. Patient blows down a wide bore tube at the end of which is a whistle, on the side is a hole with adjustable knob. As subject blows → whistle blows, leak hole is gradually increased till the intensity of whistle disappears. At the last position at which the whistle can be blown , the PEFR can be read off the scale. BED SIDE PFTS
  • 36.
  • 37.
    8) Wright Respirometer: measures TV, MV  Simple and rapid  Can be connected to endotracheal tube or face mask  Prior explanation to patients needed.  Ideally done in sitting position  MV- instrument records for 1 min and reads directly.  TV-calculated by dividing MV by counting Respiratory Rate. 9) BED SIDE PULSE OXIMETRY 10) ABG.
  • 38.
    CATEGORIZATION OF PFTs 1.MECHANICAL VENTILATORY FUNCTIONS OF LUNG / CHEST WALL: A) STATIC LUNG VOLUMES & CAPACITIES – VC, IC, IRV, ERV, RV, FRC. B) DYNAMIC LUNG VOLUMES –FVC, FEV1, FEF 25-75%, PEFR, MVV, RESP. MUSCLE STRENGTH C) VENTILATION TESTS – TV, MV, RR.
  • 39.
    2) GAS- EXCHANGETESTS: A) Alveolar-arterial pO2 gradient B) Diffusion capacity C) Gas distribution tests -Single breath N2 test. - Multiple Breath N2 test - Helium dilution method. D) Ventilation – Perfusion tests A) ABG B) single breath CO elimination test CATEGORIZATION OF PFTs
  • 40.
    3) CARDIOPULMONARY INTERACTION: A)Qualitative tests: - History , Examination - ABG - Stair Climbing Test B) Quantitative tests - 6 min Walk test (Gold standard) CATEGORIZATION OF PFTs
  • 41.
    SPIROMETRY  CORNERSTONE OFALL PFTs.  John hutchinson – invented spirometer  “Spirometry is a medical test that measures the volume of air an individual inhales or exhales as a function of time.”  MEASURES - VC, FVC, FEV1, PEFR.  CAN’T MEASURE – FRC, RV, TLC
  • 42.
    Flow-Volume Curves andSpirograms  Two ways to record results of FVC maneuver:  Flow-volume curve--- Flow meter measures flow rate in L/s upon exhalation; Flow plotted as Function of Volume  Classic Spirogram---Volume as a Function of Time
  • 44.
    Measurements Obtained fromthe FVC Curve  FEV1---the volume exhaled during the first second of the FVC maneuver  FEF 25-75%---the mean expiratory flow during the middle half of the FVC maneuver; reflects flow through the small (<2 mm in diameter) airways  FEV1/FVC---the ratio of FEV1 to FVC X 100 (expressed as a percent); an important value because a reduction of this ratio from expected values is specific for obstructive rather than restrictive diseases
  • 45.
    OBSTRUCTIVE DISORDERS RESTRICTIVEDISORDERS  Limitation of expiratory airflow as airways cannot empty as rapidly compared to normal (e.g. narrowed airways from bronchospasm, inflammation, etc.) Examples:  Asthma  Emphysema  Cystic Fibrosis  Characterized by reduced lung volumes/decreased lung compliance Examples:  Interstitial Fibrosis  Scoliosis  Obesity  Lung Resection  Neuromuscular diseases  Cystic Fibrosis Spirometry Interpretation: Obstructive vs. Restrictive Defect
  • 46.
     Obstructive Disorders FVC normal or ↓  FEV1 ↓  FEF25-75% ↓  FEV1/FVC ↓  TLC normal or ↑  Restrictive Disorders  FVC ↓  FEV1 ↓  FEF 25-75% normal to ↓  FEV1/FVC normal to ↑  TLC ↓
  • 47.
    Normal vs. Obstructivevs. Restrictive
  • 48.
    Spirometry Interpretation: What dothe numbers mean? FVC  Interpretation of % predicted:  80-120% Normal  70-79% Mild reduction  50%-69% Moderate reduction  <50% Severe reduction FEV1  Interpretation of % predicted:  >75% Normal  60%-75% Mild obstruction  50-59% Moderate obstruction  <49% Severe obstruction
  • 49.
    FEF 25-75%  Interpretationof % predicted:  >79% Normal  60-79% Mild obstruction  40-59% Moderate obstruction  <40% Severe obstruction FEV1/FVC  Interpretation of absolute value:  80 or Higher Normal  79 or Lower Abnormal Spirometry Interpretation: What do the numbers mean?
  • 50.
    Lung Volumes andObstructive and Restrictive Disease?
  • 51.
    MEASUREMENTS OF VOLUMES TLC, RV, FRC – MEASURED USING Nitrogen washout method Inert gas (helium) dilution method Total body plethysmography
  • 52.
    1) N2 WASHOUT METHOD  Patient breathes in 100% oxygen and on expiration all nitrogen is washed out.  The exhaled volume and nitrogen conc. in it is measured.  The difference in nitrogen volume at the initial concentration and at the final exhaled concentration allows a calcul;ation of the intrathoracic volume, usually the FRC
  • 53.
    2) HELIUM DILUTIONMETHOD: Patient breathes in and out of a spirometer filled with 10% helium and 90% O2, till conc. in spirometer and lung becomes same (equilibirium) as no helium is lost; (as He is insoluble in blood) C1 X V1 = C2 ( V1 + V2) V2 = V1 ( C1 – C2) C2 V1= VOL. OF SPIROMETER V2= FRC C1= Conc.of He in the spirometer before equilibrium C2 = Conc, of He in the spirometer after equilibrium
  • 54.
    3) TOTAL BODYPLETHYSMOGRAPHY Subject sits in an air tight box. At the end of normal exhalation – shuttle of mouthpiece closed and pt. is asked to make resp. efforts. As subject inhales – expands gas volume in the lung so lung vol. increases and box pressure rises and box vol. decreases. BOYLE’S LAW: PV = CONSTANT (at constant temp.) For Box – p1v1 = p2 (v1- ∆v) For Subject – p3 x v2 =p4 (v2 - ∆v) P1- initial box pr. P2- final box pr. V1- initial box vol. ∆ v- change in box vol. P3- initial mouth pr., p4- final mouth pr. V2- FRC
  • 55.
    MEASUREMENT OF AIRWAYRESISTANCE 1) Body Plethysmography 2) Forced expiratory maneuvers:  Peak expiratory flow (PEFR) FEV1 3) Response to bronchodilators (FEV1)
  • 56.
     Patients withsmall airway obstruction tested twice- before and after administration of bronchodilators to evaluate responsiveness.  If 2 out of 3 measurements improve, patient has a reversible airway obstruction that is responsive to medication. 1) FVC- increase of 10% or more 2) FEV1- increase of 200ml or 15% of baseline 3) FEF25%-75%- increase of 20% or more Spirometry Pre and Post Bronchodilator
  • 57.
    FLOW VOLUME LOOPS Do FVC maneuver and then inhale as rapidly and as much as possible  This makes an Inspiratory curve.  The Expiratory and Inspiratory Flow Volume Curves put together make a Flow Volume Loop.
  • 59.
    TESTS FOR GASEXCHANGE FUNCTION 1) ALVEOLAR-ARTERIAL O2 TENSION GRADIENT:  Sensitive indicator of detecting regional V/Q inequality  Normal value in young adult at room air = 8-25 mm Hg.  Abnormal high values at room air is seen in asymptomatic smokers & chr. Bronchitis.
  • 60.
    2)DIFFUSING CAPACITY OFLUNG: - defined as the rate at which gas enters into blood.  DL IS MEASURED BY USING CO: A) High affinity for Hb which is approx. 200 times that of O2 , so does not rapidly build up in plasma B) Under N condition it has low blood conc ≈ 0 C) Therefore, pulm conc.≈0
  • 61.
     Pt inspiresa dilute mixture of CO and hold the breath for 10 secs.  CO taken up is determined by infrared analysis: DLCO = CO ml/min/mmHg PACO – PaCO  N range 20- 30 ml/min./mmhg SINGLE BREATH TEST USING CO
  • 62.
    DLCO decreases in- Emphysema, lung resection, Pul. Embolism, Anaemia  Pulmonary fibrosis, sarcoidosis- increased thickness DLCO increases in: (Cond. Which increase pulmonary blood flow)  Supine position  Exercise  Obesity  L-R shunt
  • 63.
    TESTS FOR CARDIOPLULMONARYINTERACTIONS  Reflect gas exchange, ventilation, tissue O2, CO2.  QUALITATIVE- History, examination, ABG, Stair climbing test  QUANTITATIVE- 6 minute walk test
  • 64.
     1) STAIRCLIMBING TEST:  If able to climb 3 flights of stairs without stopping/dyspnoea - ↓ed morbidity & mortality  If not able to climb 2 flights – high risk  2) 6 MINUTE WALK TEST: - Gold standard - C.P. reserve is measured by estimating max. O2 uptake during exercise - Modified if pt. can’t walk – bicycle/ arm exercises - If pt. is able to walk for >2000 feet during 6 min - VO2 max > 15 ml/kg/min - If 1080 feet in 6 mins : VO2 of 12ml/kg/min - Simultaneously oximetry is done & if Spo2 falls >4%- high risk
  • 65.
    PREDICTION OF POSTOPERATIVEPULMONARY COMPLICATIONS  1) Nunn and Miledge criteria: a. FEV1<1L, N PaO2, PaCO2- Low risk of POPC b. FEV1<1L, Low PaO2, N PaCO2- patient will need prolonged O2 supplementation c. FEV1<1L, Low PaO2, High PaCO2- patient may need postop ventilation  2) Based on Spirometry: a. Predicted FVC< 50% b. Predicted FEV1 < 50% or <2 L c. Predicted MVV <50% or < 50L/min
  • 66.
    PATIENT WITHOUT CHESTOPTIMIZATION FOR GENERAL ANESTHESIA IS AN EXTRA BURDON ON ANESTHETIST…….!
  • 67.