Downloaded 153 times
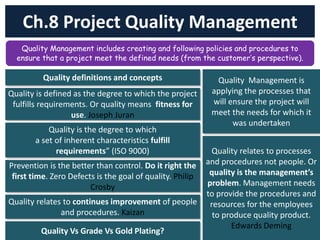
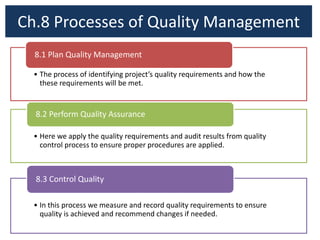
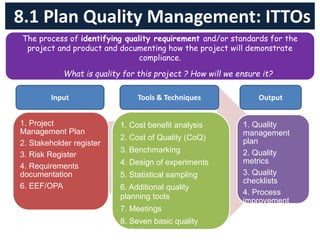
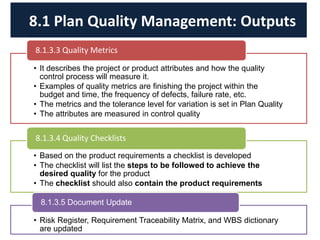
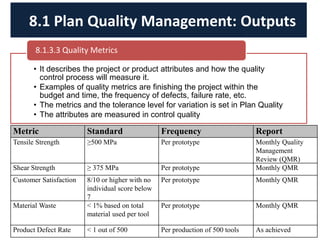
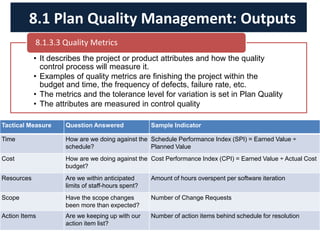
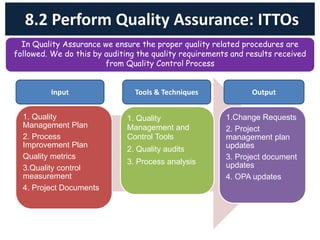
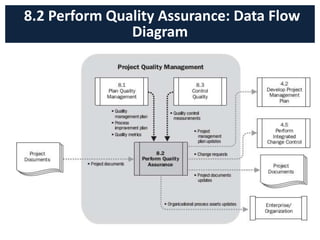
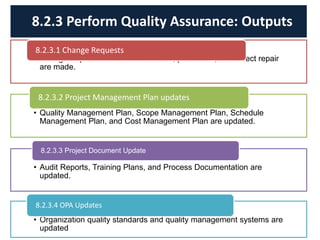
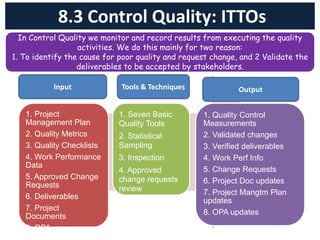
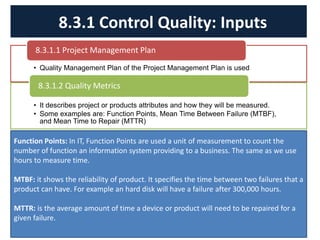

The document discusses quality management processes from Chapter 8 of the PMBOK Guide 5th Edition. It provides details on the three main quality management processes: plan quality management, perform quality assurance, and control quality. For plan quality management, the key inputs, tools and techniques, and outputs are described. This includes developing a quality management plan, quality metrics, and checklists. Perform quality assurance focuses on auditing quality requirements and results from quality control. Control quality involves measuring and recording quality against requirements.


