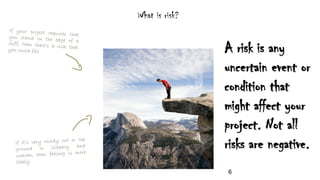
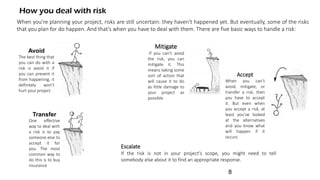
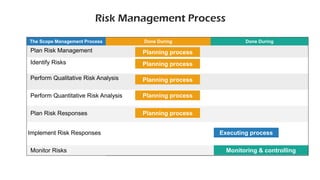
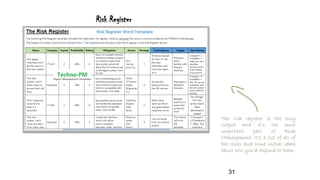
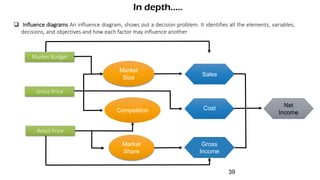
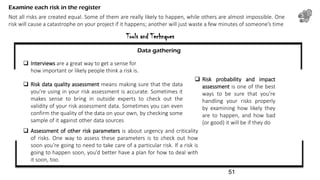
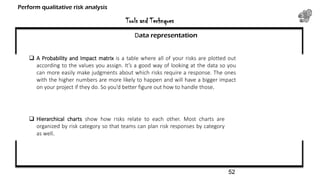
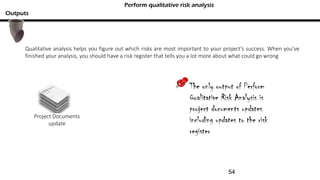
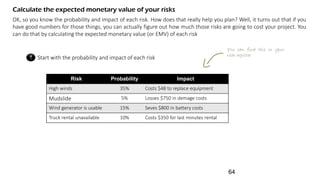
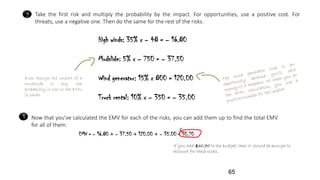
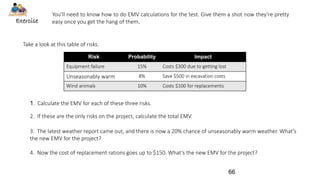
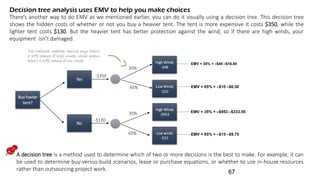
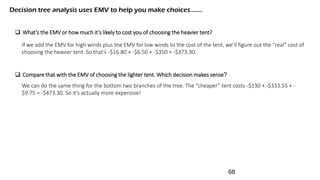
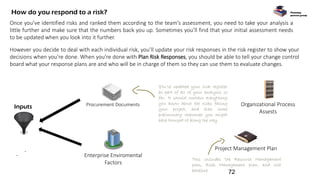
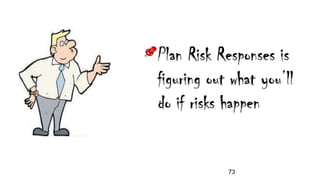
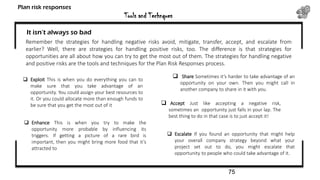
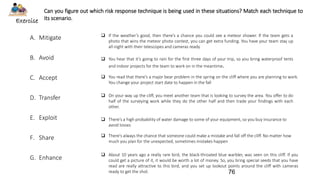
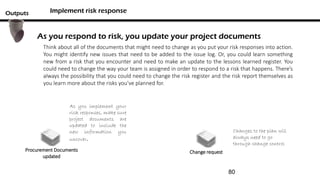
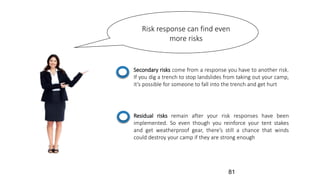
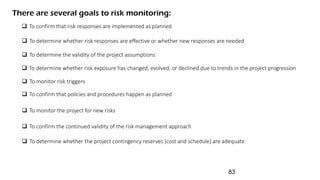
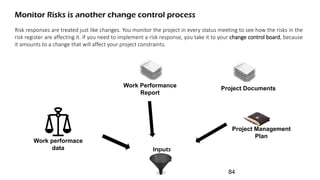
Risk Management
Chapter 11
11 Project Risk Management
Planning for the Unknown
Gwamaka, What if these
ropes break
Don’t worry, Flora! I took
care of it with risk planning.
We can swing away
without a care in the world
Prepared by
Kelvin Fredson2
What is Risk?
RISK MANAGEMENT
What is risk?
A risk can be an event (like a fire), or it can be a condition (like an important part being unavailable). Either way,
it’s something that may or may not happen…but if it does, you will be forced to change the way you and your
team work on the project.
There are no guarantees on any project! Even the simplest activity can run into unexpected problems.
Any time there’s anything that might occur on your project and change the outcome of a project
activity, we call that a risk.
Within a project, risks are unplanned events or conditions that can have positive or negative effects on a project’s
success. Not all risks are bad, but almost all are seen as a threat.
Even launching a project represents risk, because the project could succeed or fail there’s uncertainty in the
endeavor
4
No matter how well you plan, your project can always run into unexpected problems. Team members get
sick or quit, resources that you were depending on turn out to be unavailable even the weather can
throw you for a loop.
So does that mean that you’re helpless against unknown problems? No! You can use risk planning to
identify potential problems that could cause trouble for your project, analyze how likely they’ll be to
occur, take action to prevent the risks you can avoid, and minimize the ones that you can’t
Even the most carefully planned project can run into trouble.
A project manger’s work should not focus on dealing with problems; it should focus on preventing them
Through risk management, the project manager can stay in control of the project, rather nthan being
controlled by it.
5
What is risk?
A risk is any
uncertain event or
condition that
might affect your
project. Not all
risks are negative.
6
Some events (like finding an easier way to do an activity) or
conditions (like lower prices for certain materials) can help
your project! When this happens, we call it an
opportunity…but it’s still handled just like a risk.
Not all risks are negative
7
How you deal with risk
When you’re planning your project, risks are still uncertain: they haven’t happened yet. But eventually, some of the risks
that you plan for do happen. And that’s when you have to deal with them. There are five basic ways to handle a risk:
Avoid
The best thing that
you can do with a
risk is avoid it if
you can prevent it
from happening, it
definitely won’t
hurt your project
Mitigate
If you can’t avoid
the risk, you can
mitigate it. This
means taking some
sort of action that
will cause it to do
as little damage to
your project as
possible
Transfer
One effective
way to deal with
a risk is to pay
someone else to
accept it for
you. The most
common way to
do this is to buy
insurance
Accept
When you can’t
avoid, mitigate, or
transfer a risk, then
you have to accept
it. But even when
you accept a risk, at
least you’ve looked
at the alternatives
and you know what
will happen if it
occurs
Escalate
If the risk is not in your project’s scope, you might need to tell
somebody else about it to find an appropriate response.
8
Risk Management
Is the process of identifying, evaluatiing, and planing responses to events, both positive and negative, that might occur
throughout the course of a project.
Through risk management, you increase the probability and impact of opportunities on the project (positive events)
while decreasing the probability and impact of threats to the project (negative events)
Risk management is the process by which the project manager and project team identify project risks, analyze and
rank them, and determine what actions, if any, need to be taken to avert these threats. Associated with this process
are the costs, schedule, and quality concerns of the project brought about by the solutions to those risks.
Risks are identified and managed starting in initiating and are kept up to date while the project is underway.
The project manager and the team look at what has happened on the project, the current status of the project, and
what is yet to come and reasssess the potential threats and opportunities.
9
In this chapter, we’ll discuss risk management planning, risk
identification and analysis, response planning and
implementation, and monitoring the identified risks
10
Building A Strong Risk Understanding
Risks in project management are either threats, which are negative risk events, or opportunities, which
are positive risk events.
Negative risk events are easy to see: loss of data, potential for injury, late resource delivery from a
vendor
Positive risk events are sometimes cloudier to see, but they do exist. Consider investing in a faster piece
of equipment, hiring a vendor to do a portion of the project work, or saving costs by paying in advance
for a service the project needs.
Positive risks are opportunities to save time, money, or effort, or to increase productivity. Some risks,
positive or negative, are negligible and are documented and accepted, while other risk events need to
be quantified, planned for, and closely monitored throughout the project
11
There are two levels of risks in a
project to consider:
Individual project risks The risk events that can hinder or help the
project reach its objectives
Overall project risk The combination of all risk events that will reveal
the project’s risk exposure and determine just how risky the project
is for the organization
Generally, the higher the project priority, the more willing the organization is to spend time or money to
address risk events. You’ll also consider business risks and pure risks in a project.
12
Integrated risk management is part of the organization’s approach to risk. It’s the distribution of risk events and how the
risks are managed. Some risks may be assigned to the project manager to manage, and some risks may need to be
escalated to management to address and manage
Integrated risk management
The integrated nature of risk management is beyond the boundaries of project management; the risk should be given to
the party who’s most appropriate to manage the risk event for the organization, not just the project or even the
program.
For agile projects, uncertainty is part of the approach. Because of the nature of uncertainty and the expectation of
change in an agile project, there are iteration reviews, knowledge sharing, and risk management involved at each
iteration. The project team, the product manager, and the project manager all work together at the beginning of an
iteration to address potential risks and at the end of the iteration to review what did, or didn’t, work in the iteration
While the iteration is in motion, the project team and project manager work to monitor and address risks as they may be
pending or have happened. The team is empowered to address the risk events to achieve the project’s objectives in the
current iteration
13
Tailoring Risk Management In Projects
Like all knowledge areas, you can also tailor risk management to fit your organization and processes. Risk management
should always be adjusted to fit the project you’re managing—there is no blanket approach to risk management that will fit
every project.
For risk management in your projects you’ll have to consider the following:
 Size of the project Larger projects generally require a more formal risk management approach than smaller, low-
priority projects.
 Complexity of the project Simple is always better when it comes to project management, but that’s not always
feasible. A complex project, based on the technology involved, the endeavor’s work, and external dependencies, can
include many uncertainties that have to be addressed in risk management.
 Importance of the project A high-profile project that the organization considers important for opportunities,
investment, reputation, and other considerations will warrant a well-thought-out project management risk
approach.
 Development of the project A waterfall or predictive project calls for risk planning upfront, as opposed to an agile
project, where risks are addressed at the start of each iteration. Both project types call for risk management, but the
approach is different with each type.
14
Risk Factors
When assessing risk, it’s necessary to determine the following:
The probability that a risk event will occur (how likely)
The range of possible outcomes (impact or amount at stake)
Expected timing for it to occur in the project life cycle (when)
The anticipated frequency of risk events from that source (how often)
15
Defiining the Concepts
As we continue discusing this Knowledge area, remember the basic, yet very important cocepts
Uncertainty: Is a lack of knowledge about an event that reduce confidence in conclusions drawwn from
data. The work that needs to be done, the cost, the time, the quality needs, the communications
needs,etc. can be uncertainty
Risk Appetites: (which is also referred to risk tolerence) is a general, high level description of the level
of risk acceptable to an individual or an organization. For example a sponsor is willing to accept a little
risk to the schedule on this project..
Risk threshold: refers to the specific point at which risk becomes unacceptable . For example, the
sponso will not accept a risk of the schedule being delayed 15 days or longer.
Risk Averse: Someone whomdoes not want to be negatively impacted by threats is risk averse.
16
Risk Management Process
The Scope Management Process Done During Done During
Planning process
Planning process
Planning process
Planning process
Monitoring & controlling
Implement Risk Responses
Plan Risk Responses
Perform Quantitative Risk Analysis
Perform Qualitative Risk Analysis
Identify Risks
Plan Risk Management
Planning process
Executing process
Monitor Risks
Plan Risk Management
Is the process of defining how to conduct risk management activities for project.
Key benefit of this process is that it ensures that the degree, tyoe, and visibilty of risk management are proportionate
to both isk and the importance of the project to the organization and other stakeholders.
By now, you should have a pretty good feel for how each of the planning processes works. The past few knowledge areas
started out with their own planning process, and Risk Management is no different. You start with the Plan Risk
Management process, which should look very familiar to you.
Planning
process group
Up to 90 percent of the threats identified and investigated in
the risk management process can be eliminated by changing
how the project work is planned and performed
18
Plan Risk Management
Inputs
Organizatonal Process
Assets
Project
Documents
Project Management Plan
Project Charter
Enterprise
Enviromental Factors
19
Watch it! You may get a question on the exam that asks which processes use
organizational process assets! Think about why you need them for Plan
Risk Management and the other planning processes. That should help you
remember which processes need them.
Are you starting to see a pattern here?
20
You’ll keep meeting with them throughout your project to stay on top of risks.
Data analysis
Meetings
Expert Judgment
Plan Risk Management – Tools & Techniques
21
Plan Risk Management - Outputs
The Risk Management plan is the only output
It tells you how you’re going to handle risk on your project which you probably guessed, since that’s what
management plans do. It says how you’ll assess risk on the project, who’s responsible for doing it, and how
often you’ll do risk planning (since you’ll have to meet about risk planning with your team throughout the
project
Risk Management Plan
Output
It tells you who identifies and
analyzes the risks, how they do
it, and how often it happen
22
The plan has parts that are really useful for managing risk:
Risk Management Plan.........
 It has a bunch of risk categories that you’ll use to classify your risks. Some risks are technical, like a component
that might turn out to be difficult to use. Others are external, like changes in the market or even problems with
the weather. Risk categories help you to build a risk breakdown structure (RBS).
 You’ll need to describe the methods and approach you’ll use for identifying and classifying risks on your
project. This section of the document is called the methodology
 It’s important to come up with a plan to help you figure out how big a risk’s impact is and how likely a risk is
to happen. The impact tells you how much damage the risk will cause to your project. A lot of projects
classify impact on a scale from minimal to severe, or from very low to very high. This section of the
document is called the definitions of probability and impact
 Roles and Responsibilities, who will do what risk maanagement work, Stakeholders outside the project team
may have roles and responsibilities regarding risk management
 Funding, Plan for utilizing reserves in response to risks on the project
 Timing, When to do risk management for the project. Risk management should start as soon as you have the
appropriate inputs and should be repeated throughout the life of the project, since new risks can be
identified as the project progress and degree of risk can change over course of a project.
23
Use a risk breakdown structure to categorize risk
You should build guidelines for risk categories into your Risk Management plan, and the easiest way to do that is to use a
risk breakdown structure (RBS).
Project
risks
Technical
risks
External
risks
Organizational
risks
Quality
Issues
Part
compatibility
New
government
regualtions
Customer
Issues
Weather
problems
Project
priority
changes
Staff
attrition
Fundind
cuts
When you sit down with the team to come up with a
list of risks, the RBS will be really useful. The
categories are a great reminder when you’re
brainstorming
24
Exercise
Take a look at how each of these project risks is handled and figure out if the risk is being avoided, mitigated,
transferred, or accepted.
1. Stormy weather and high winds could cause very slippery
conditions, so you put up a tent and wear slip-resistant
footwear to keep from losing your footing
2. You buy a surge protector to make sure a lightning strike
won’t blow out all of your equipment
3. Flooding could cause serious damage to your
equipment, so you buy an insurance policy that covers
flood damage.
4. The manufacturer issues a warning that the safety
equipment you are using has a small but nonzero
probability of failure under the conditions that you’ll be
facing. You replace it with more appropriate equipment
5. A mud slide would be very damaging to your project, but
there’s nothing you can do about it.
6. A team member discovers that the location you planned
on using is in a county that is considering regulations that
could be expensive to comply with. You work with a
surveying team to find a new location
7. Surrounding geological features could interfere with your
communications equipment, so you bring a flare gun and
rescue beacon in case it fails.
25
Anatomy of a risk
Once you’re done with Plan Risk Management, there are four more Risk Management processes that will help you and
your team come up with the list of risks for your project, analyze how they could affect it, and plan how you and your
team will respond if any of the risks materialize when you’re executing it
Identify risk
Perform Qualitative risk Analysis
Perform Quantitatice risk Analysis
Plan risk response
The first thing you need to do when
planning for risks is to gather the
team together and come up with a list
of every possible risk you can think
of
Once you’ve got a list of risks, you’ll
need to get a good idea of the
probability and impact of each risk
You can make better decisions with more precise data.
That’s what this process is about—assigning
numerical values for the probability and impact of
each risk
All that’s left now is to plan responses to each
risk! This is where you decide whether to
avoid, mitigate, transfer, or accept…and how
you’ll do it!
Prepared by
Kelvin Fredson26
All four of these Risk
Management processes are in
the Planning process group you
need to plan for your project’s
risks before you start executing
the project
27
What could happen to your project?
You can’t plan for risks until you’ve figured out which ones you’re likely to run into. That’s why the next Risk
Management process is Identify Risks. The idea is that you want to figure out every possible risk that might affect
your project
Planning
process group
Identifying Risks
After completing the risk management plan, you’ll need to get to work identifying risks that can hinder the project’s
success. Risk identification is the process of identifying the risks and then documenting how their presence can affect
the project.
Risk identification is an iterative process and can be completed by the project manager, the project team, a risk
management team, and even SMEs.
In some instances, stakeholders and even people outside of the project can complete additional waves of risk
identification. Risk identification addresses both individual risks and the overall project risks.
28
Watch it!
The best answer is “everyone” Each stakeholder has a different
perspective of the project and can provide thoughts on opportunities and
threats.
When you get a question about who should be involved in
risk identification?
29
Project managers should begin looking for risks as soon as a project is first discussed. In fact, an assessment of overall
project risk is included in the project charter. However, the major risk identification effort occurs during planning. The
project manager will need to have skills to faciliate the identification of all risks ( or as may risk as reasonably possible)
But keep in mind that smaller numbers of risks may also be identified later in the project. Risk should continually
readdedded. But for PMP exam risk identification is done during integrate changr control, when working with
contracts, when working with resources, and when dealing with project issues
Inputs
Enterprise Enviromental
Factors
Project Management Plan
Organizational Process
Assests
Project Documents
Procurement Documents
Agreements30
Risk Register
The risk register is the only
output and it’s the most
important part of Risk
Management. It’s a list of all of
the risks and some initial ideas
about how you’d respond to them
31
The goal of all of the risk
planning processes is to
produce the risk register.
That’s your main weapon
against risk.
32
Data gathering techniques for Identify Risks Tools & Techniques
The most important way to identify those risks is to gather data from the team. That’s why the first and most
important technique in Identify Risks is called data-gathering techniques. These are time-tested and effective
ways to get data from your team, stakeholders, and anyone else who might have data on risks.
Useful data gathering techniques
There are a lot of different ways that you can find risks on your
project. But there are only a few that you’re most likely to use
and those are the ones that you will run across on the exam.
 Brainstorming is the first thing you should do with your team.
Get them all together in a room, and start pumping out
ideas. Brainstorming sessions always have a facilitator to lead
the team and help turn their ideas into a list of risks
 Interviews are a really important part of identifying risk. Try to find everyone who
might have an opinion and ask them about what could cause trouble on the
project. The sponsor or client will think about the project in a very different way
than the project team.
33
 Checklist analysis means using checklists that you developed specifically to help you find
risks. Your checklist might remind you to check certain assumptions, talk to certain
people, or review documents you might have overlooked.
Tools & Techniques
Useful data gathering techniques…….
What’s the big difference between
brainstorming and the interviews? Can you think
of a situation where one would be more useful
than the other?
34
More Identify Risks technique Tools & Techniques
Even though gathering data is the biggest part of Identify Risks, it’s not the only part of it. There are other tools
and techniques that you’ll use to make sure that the risk register you put together lists as many risks as possible.
The more you know about risk going into the project, the better you’ll handle surprises when they happen. And
that’s what these tools and techniques are for looking far and wide to get every risk possible.
Data analysis tools and techniques
 Document analysis is when you look at plans, requirements, documents from your organizational process assets,
and any other relevant documents that you can find to squeeze every possible risk out of them
 SWOT analysis lets you analyze strengths, weaknesses, opportunities, and threats. You’ll start by brainstorming
strengths and weaknesses, and then examine the strengths to find opportunities, and the weaknesses to identify
threats to the project
 Root-cause identification is analyzing each risk and figuring out what’s actually behind it. Even though falling off of
the cliff and having your tent blow away are two separate risks, when you take a closer look you might find that
they’re both caused by the same thing: high winds, which is the root cause for both of them. So you know that if
you get high winds, you need to be on the lookout for both risks
35
 Assumptions and constraint analysis is what you’re doing when you look over your project’s assumptions.
Remember how important assumptions were when you were estimating the project? Well, now it’s time to look
back at the assumptions you made and make sure that they really are things you can assume about the project.
Wrong assumptions are definitely a risk.
 Interpersonal and team skills help the team to get broad participation in risk identification. Specifically, the
facilitation skill is important to this process
 Prompt lists are lists of risk categories that you and the team use to jog your memory when you’re identifying risks.
You might use the risk categories from the lowest level of the risk breakdown structure to get the team started
thinking about risks that could occur on your project as an example
 Expert judgment lets you rely on past experience to identify risks
 Meetings are where your team gets together to identify risks as a group.
Data analysis tools and techniques……..
36
SWOT stands for strengths, weaknesses, opportunities, and threats. SWOT analysis is the process of examining the project
from the perspective of each characteristic. For example, a technology project may identify SWOT as follows:
In depth:
SWOT
Strenghts Threats
Oportunities Weakness
 Strengths The technology to be installed in the project has been installed by other large companies in our industry.
 Weaknesses We have never installed this technology before.
 Opportunities The new technology will allow us to reduce our cycle time for time to-market on new products.
 Threats The time to complete the training and simulation may overlap with product updates, new versions, and
external changes to our technology portfolio.
37
Diagramming Technique
In depth....
The project team can utilize several diagramming techniques to identify risks:
 Ishikawa These cause-and-effect diagrams, as shown, are also called fishbone diagrams. They are great for the root-
cause analysis of factors that are causing risks within the project. The goal is to identify and treat the root of the
problem, not the symptom.
Schedule MaterialsEquipments
Labor AvailabilityAbility
Major Defects
 Flowcharts System or process flowcharts show the relationship between components and how the overall
process works. These are useful for identifying risks between system components.
38
 Influence diagrams An influence diagram, shows out a decision problem. It identifies all the elements, variables,
decisions, and objectives and how each factor may influence another
In depth.....
Market Budget
Gross Price
Retail Price
Competition
Market
Share
Sales
Gross
Income
Cost Net
Income
Market
Size
39
Using Prompt Lists
In depth......:
If you’re doing the same types of projects over and over, such as IT projects or construction projects, you might
use a prompt list to help the project team better identify project risks. Prompt lists are risk categories that were
identified in the risk management plan. For example, your prompt list might ask, “What type of risks are lurking in
hardware for this project?” or “Are there any new materials that could have risks we should consider?” The
prompt list prompt risk identification participants to think about individual risks based on the prompts you
include.
Overall project risks subscribe to one of three common types of prompt lists:
 VUCA volatility, uncertainty, complexity, and ambiguity
 TECOP technical, environmental, commercial, operational, and political
 PESTLE political, economic, social, technological, legal, and environmental
40
Read each of these scenarios and identify which tool or technique is being used. If a scenario uses a data-
gathering technique, specify which one.Exercise
1. Your project requires that you set up a campsite on the edge of a cliff. You gather your team members including a
geologist, a meteorologist, a tracker, and three campsite workers and lead them in a directed discussion where they
identify as many risks as possible
2. You look through your company’s asset library and discover that two previous projects involved setting up camp in
this area. You look through the lessons learned to figure out what went wrong, and what could have been avoided
through better planning.
3. You meet individually with many different people: the sponsor, stakeholders, team members, and experts. You ask
each of them detailed questions about what they think could go wrong on the project
4. You’ve identified a risk that is very complex, so you try to find out what made it happen. You use an Ishikawa
diagram to gain insight into it.
5. You’ve reviewed your estimates and find that you had assumed that seasonal weather patterns would hold. If they
change, then it could cause serious problems with the project.
41
Where to look for risks
A good way to understand risks is to know where they come from. If you start thinking about how you find risks on your
project, it will help you figure out how to handle them.
Here are a few things to keep in mind when you’re looking for risks:
1 Resources are a good place to start. Have you ever been promised a person, equipment, conference room, or some
other resource, only to be told at the last minute that the resource you were depending on wasn’t available? What
about having a critical team member get sick or leave the company at the worst possible time? Check your list of
resources. If a resource might not be available to you when you need it, then that’s a risk.
2 The critical path is full of risks. Remember the critical path method from Chapter 6? Well, an activity on the critical
path is a lot riskier than an activity with plenty of float, because any delay in that activity will delay the project.
3 ”When you assume...” Have you ever heard that old saying about what happens when you assume? At the
beginning of the project, your team had to make a bunch of assumptions in order to do your estimates. But some
of those assumptions may not actually be true, even though you needed to make them for the sake of the
estimate. It’s a good thing you wrote them down now it’s time to go back and look at that list. If you find some of
them that are likely to be false, then you’ve found a risk.
4 Look outside your project. Is there a new rule, regulation, or law being passed that might affect your project? A
new union contract being negotiated? Could the price of a critical component suddenly jump? There are plenty of
things outside of your project that are risks and if you identify them now, you can plan for them and not be
caught off guard
42
If an activity that’s not on the critical path has a really small
float, that means a small problem could easily cause it to
become critical which could lead to big delays in your project.
Finding risks means talking to your team and being
creative. Risks can be anywhere
Remember:
43
Now put it in the risk register
The point of the Identify Risks process is to identify risks. But what does that really give you? You need to know
enough about each risk to analyze it and make good decisions about how to handle it. So when you’re doing
interviews, leading brainstorming sessions, analyzing assumptions, gathering expert opinions, and using the other
Identify Risks tools and techniques, you’re gathering exactly the things you need to add to the risk register.
Outputs
The other major output of the Identify Risks process is the risk report and Project
documents updates.
As you work through all of the Risk Management process, you’ll
be compiling a report of the sources of risk to your project and
summary-level information
Risk report
Project document
update
While you identify risks, you might find changes
to your assumption log, issue log, or lessons
learned register
44
Rank your risks
Planning
process group
It’s not enough to know that risks are out there. You can identify risks all day long, and there’s really no limit to
the number of risks you can think of. But some of them are likely to occur, while others are very improbable.
It’s the ones that have much better odds of happening that you really want to plan for
Besides, some risks will cause a whole lot of damage to your project if they happen, while others will barely make a
scratch and you care much more about the risks that will have a big impact.
That’s why you need the next Risk Management process, Perform Qualitative Risk Analysis so you can look at each risk
and figure out how likely it is and how big its impact will be on your project.
Perform Qualitative
Risk Analysis
Once you’ve got a list of risks,
you’ll need to get a good idea of the
probability and impact of each risk
45
When you think of “qualitative,” think of qualifying. You are qualifying, or
justifying, the seriousness of the risk for further analysis. All the different
risks’ impact on the project should be considered and ultimately
quantified: schedule impact, health and safety, even reputational risks.
When you think of quantitative, think of quantifying the risk’s financial
effect on the project.
Watch it!
46
Qualitative risk analysis “qualifies” the risks that have been identified in the project. Specifically, qualitative risk
analysis examines and prioritizes the risks based on their probability of their occurrence and the impact on the
project if they did occur. Qualitative risk analysis is a broad approach to ranking risks by priority, which then guides the
risk reaction process. The facilitator of the qualitative risk analysis process, whether an expert or the project manager,
must be aware of perception and bias of how and why risks are rated by the participants
Qualitative is subjective, because it’s really a fast human judgment based on experience, a gut feeling, or a best
guess about the risk’s impact and probability.
Remember
Qualitative risk analysis is a subjective analysis of the risk
identified in the risk register
Keep in mind that this process is repeated as new risks are
uncovered throughout the project
47
To perform this analysis, the
following must be determined
The probability of each risk occuring, using a standard scale (common
subjective analysis scales include low,Medium,High and 1 to 10)
The impact (the amount at stake or the positive or negative
consequences) of each risk occurin, using a standard scale, such as
low,Medium,High or 1 to 10
48
What we need
Inputs
Enterprise enviromental
factors
Organizational process
assests
Project documents
Project Management Plan
A good way to figure out whether a risk is
likely is to look at lessons learned and see if
it happened before
You need to know what risks you’ve
identified in order to analyze them, so the
risk register is an important project
document to include
49
 Expert judgment definitely comes in
handy when you’re assessing risks. Who
better to help you come up with things
that might go wrong than experts who
have been through similar projects
before?
 Risk categorization is all about grouping your risks so that you can
come up with a better strategy for dealing with them. You might
group them by the phase of the project where you’ll see them, or
by the source of the risk. Or you could come up with a bunch of
additional categories that would help you to organize your
responses better and be ready for the risk if it should happen
 Interpersonal and team skills facilitation
 Meetings
Tools and Technques
Perform qualitative risk analysis
50
Tools and Technques
Examine each risk in the register
Not all risks are created equal. Some of them are really likely to happen, while others are almost impossible. One
risk will cause a catastrophe on your project if it happens; another will just waste a few minutes of someone’s time
 Interviews are a great way to get a sense for
how important or likely people think a risk is.
 Risk data quality assessment means making sure that the data
you’re using in your risk assessment is accurate. Sometimes it
makes sense to bring in outside experts to check out the
validity of your risk assessment data. Sometimes you can even
confirm the quality of the data on your own, by checking some
sample of it against other data sources
 Assessment of other risk parameters is about urgency and criticality
of risks. One way to assess these parameters is to check out how
soon you’re going to need to take care of a particular risk. If a risk is
going to happen soon, you’d better have a plan for how to deal with
it soon, too.
Data gathering
 Risk probability and impact
assessment is one of the best
ways to be sure that you’re
handling your risks properly
by examining how likely they
are to happen, and how bad
(or good) it will be if they do
51
Tools and Technques
Perform qualitative risk analysis
Data representation
 A Probability and Impact matrix is a table where all of your risks are plotted out
according to the values you assign. It’s a good way of looking at the data so you
can more easily make judgments about which risks require a response. The ones
with the higher numbers are more likely to happen and will have a bigger impact
on your project if they do. So you’d better figure out how to handle those.
 Hierarchical charts show how risks relate to each other. Most charts are
organized by risk category so that teams can plan risk responses by category
as well.
52
Sometimes you’ll find that some risks have obviously low
probability and impact, so you won’t put them in the
main section of your register. Instead, you can add them
to a separate section called the watch list, which is just a
list of risks. It’ll include risks you don’t want to forget
about, but which you don’t need to track as closely. You’ll
check your watch list from time to time to keep an eye on
things
53
Qualitative analysis helps you figure out which risks are most important to your project’s success. When you’ve
finished your analysis, you should have a risk register that tells you a lot more about what could go wrong
Outputs
Perform qualitative risk analysis
Project Documents
update
The only output of Perform
Qualitative Risk Analysis is
project documents updates
including updates to the risk
register
54
 Urgency of the risk How long before the risk may happen in the project?
 Proximity How long before the risk will affect a project objective?
 Dormancy How long after the risk has occurred before its impact is noticed?
 Manageability How easily can the risk be managed?
 Controllability How easily can the outcome of the risk event be controlled?
 Detectability How easily can the evidence of a risk’s occurrence be detected?
 Connectivity How connected is a risk to other risks within the project?
 Strategic impact What size of impact will the risk event have on the organization’s strategic goals?
 Propinquity What is the risk perception by key stakeholders?
Qualitative risk analysis also takes a cursory look at and documentation of the following:
55
Dumb Questions
Q: Who does Perform Qualitative Risk Analysis
Q: What if people disagree on how to rank risks?
Q: Where do the categories come from?
Q: How do I know if I’ve got all the risks?
Q: What’s the point in even tracking low-priority risks? Why have a watch list at all?
Q: I still don’t get the difference between priority and urgency?
Perform qualitative risk analysis
56
The conditions that cause
a risk are called triggers.
You use a watch list to
stay on top of them.
Perform qualitative risk analysis
57
Let’s say you’re a fitness trainer, and your specialty is helping millionaires get ready for major endurance
trials. You get paid the same for each job, but the catch is that you get paid only if they succeed. Which
of these clients would you take on?
Qualitative vs. quantitative analysis
Running a marathon Climbing Mount KilimanjaroVS.
One client wants you to help him train so
that he can finish a marathon. He doesn’t
have to win, just get to the finish line.
Another client wants you to help him get to the top of
Mount Kilimanjaro. He won’t be satisfied unless he gets
to the summit.
58
It’s much more likely that you can get even an out of shape millionaire to finish a
marathon than it is that you can get one to climb Mount Kilimanjaro successfully.
In fact, since the 1961s, more people have attempted to climb Kilimanjaro, and
only few have succeeded, while some have died. Your qualitative analysis
probably told you that the climbing project would be the riskier of the two. But
having the numbers to back up that judgment is what quantitative analysis is all
about
59
Perform Quantitative Risk Analysis
Once you’ve identified risks and ranked them according to the team’s assessment, you need to take your
analysis a little further and make sure that the numbers back you up. Sometimes you’ll find that your initial
assessment needs to be updated when you look into it further.
Planning
process group
Enterprise Enviromental
Factors
Project Management Plan
Organizational Process
Assests
Procurement Documents
Inputs
. This includes the cost baseline, schedule
baseline, and Risk Management plane.
This includes nearly all of
the documents you’ve created
with quantitative data:
assumption log, basis of
estimates, cost estimates,
cost forecasts, duration
estimates, milestone list,
resource requirements, risk
register, risk report, and
schedule forecasts
60
The tools for this process are all about gathering data and analyzing it to determine probability of risks occurring.
First gather the data…
Quantitative tools are broken down into three categories: the ones that help you get more data about risks, the
ones that help you to analyze the data you have, and expert judgment to help you put it all together. The tools for
gathering data focus on gathering numbers about the risks you have already identified and ranked. These tools
are called data gathering and representation techniques
 Interviewing Sometimes the best way to get hard data about your risks is to interview people who understand
them. In a risk interview, you might focus on getting three-point cost estimates so that you can come up with a
budget range that will help you mitigate risks later. Another good reason to interview is to establish ranges of
probability and impact, and document the reasons for the estimates on both sides of the range
 Representations of uncertainty Sometimes taking a look at your time and cost estimate ranges in terms of
their distribution will help you generate more data about them.
 Expert judgment It’s always a good idea to contact the experts if you have access to them. People who have a
good handle on statistics or risk analysis in general can be helpful when you are doing quantitative analysis
 Interpersonal and team skills: facilitation You’ll need to be skilled at facilitation to help the team come to its
quantitative representations of risk. Working with the team while they model out uncertainty and use it to drive
decisions is an important part of this process.
61
…then analyze it
Now that you have all the data you can get about your risk register, it’s time to analyze that data. Most of the tools
for analyzing risk data are about figuring out how much the risk will end up costing you.
 Sensitivity analysis is all about looking at the effect one variable might have if you could completely isolate it.
You might look at the cost of a windstorm on human safety, equipment loss, and tent stability without taking
into account other issues that might accompany the windstorm (like rain damage or possible debris from
nearby campsites). People generally use tornado diagrams to look at a project’s sensitivity to just one risk
factor.
 Influence diagrams It’s valuable to understand the relationships between entities, outcomes, and influences in
your project. Influence diagrams show these relationships graphically.
 Decision tree analysis lets you examine costs of all of the paths you might take through the project (depending
on which risks occur) and assign a monetary value to each decision. So, if it costs $100 to survey the cliff and
$20 to stake your tent, choosing to stake your tent after you’ve looked at the cliff has an expected monetary
value of $120. To perform a decision tree analysis, you just diagram out all of the decisions you think you will
need to make to deal with risks. Then you add up all that you would need to spend to make each decision
62
The wind’s blowing at 31 mph
SE. I weigh 153 lbs. According
to my simulations, I have a
28.3% chance of falling off the
cliff in these conditions
Quantitative analysis means taking
measurements and coming up with exact
numbers to describe your risks.
 Simulation refers to running your project risks through modeling programs. Monte Carlo analysis is one tool that
can randomize the outcomes of your risks and the probabilities of them occurring to help you get a better
sense of how to handle the risks you have identified
Monte Carlo analysis lets you run a lot of simulations to come up
with data about what could happen on your project.
63
Calculate the expected monetary value of your risks
OK, so you know the probability and impact of each risk. How does that really help you plan? Well, it turns out that if you
have good numbers for those things, you can actually figure out how much those risks are going to cost your project. You
can do that by calculating the expected monetary value (or EMV) of each risk
Start with the probability and impact of each risk1
Risk Probability Impact
High winds 35% Costs $48 to replace equipment
Mudslide 5% Losses $750 in demage costs
Wind generator is usable 15% Seves $800 in battery costs
Truck rental unavailable 10% Costs $350 for last minutes rental
You can find this in ypur
risk register
64
2 Take the first risk and multiply the probability by the impact. For opportunities, use a positive cost. For
threats, use a negative one. Then do the same for the rest of the risks.
High winds: 35% x – 48 = – 16.80
Mudslide: 5% x – 750 = – 37.50
Wind generator: 15% x 800 = 120.00
Truck rental: 10% x – 350 = – 35.00
Even though the impact of a
mudslide is big, the
probability is low so the EMV
is small
3 Now that you’ve calculated the EMV for each of the risks, you can add them up to find the total EMV
for all of them.
EMV = – 16.80 + – 37.50 + 120.00 + – 35.00 = 30.70
If you add $30.70 to the budget, then it should be enough to
account for these risks.
65
You’ll need to know how to do EMV calculations for the test. Give them a shot now they’re pretty
easy once you get the hang of them.Exercise
Take a look at this table of risks.
Risk Probability Impact
Equipment failure 15% Costs $300 due to getting lost
Unseasonably warm 8% Save $500 in excavation costs
Wind animals 10% Costs $100 for replacements
1. Calculate the EMV for each of these three risks.
2. If these are the only risks on the project, calculate the total EMV.
3. The latest weather report came out, and there is now a 20% chance of unseasonably warm weather. What’s
the new EMV for the project?
4. Now the cost of replacement rations goes up to $150. What’s the new EMV for the project?
66
Decision tree analysis uses EMV to help you make choices
There’s another way to do EMV as we mentioned earlier, you can do it visually using a decision tree. This decision tree
shows the hidden costs of whether or not you buy a heavier tent. The tent is more expensive it costs $350, while the
lighter tent costs $130. But the heavier tent has better protection against the wind, so if there are high winds, your
equipment isn’t damaged.
Buy havier
tent?
High Winds
-$48
Yes
No
High Winds
-$953
Low Winds
-$10
Low winds
-$15
-$350
-$130
35%
65%
65%
35%
EMV = 35% × –$48 –$16.80
EMV = 65% × –$10 –$6.50
EMV = 35% × –$953 –$333.55
EMV = 65% × –$15 –$9.75
The National Weather Service says there’s
a 35% chance of high winds, which means
there’s a 65% chance of low winds
A decision tree is a method used to determine which of two or more decisions is the best to make. For example, it can
be used to determine buy-versus-build scenarios, lease or purchase equations, or whether to use in-house resources
rather than outsourcing project work.
67
Decision tree analysis uses EMV to help you make choices…….
 What’s the EMV or how much it’s likely to cost you of choosing the heavier tent?
If we add the EMV for high winds plus the EMV for low winds to the cost of the tent, we’ll figure out the “real” cost of
choosing the heavier tent. So that’s -$16.80 + -$6.50 + -$350 = -$373.30.
 Compare that with the EMV of choosing the lighter tent. Which decision makes sense?
We can do the same thing for the bottom two branches of the tree. The “cheaper” tent costs -$130 + -$333.55 + -
$9.75 = -$473.30. So it’s actually more expensive!
68
Dumb Questions
Q:: I still don’t get this Monte Carlo stuff. What’s the deal
Q: I can figure out how much the risk costs using EMV, or I can do it with decision tree
analysis. Why do I need two ways to do this
Q: I understand that EMV and decision trees are related, but I still don’t exactly see how.
Q: So are both quantitative analysis and qualitative analysis really just concerned
with figuring out the impact of risks?
Perform qualitative risk analysis
69
Outputs
Perform quantitative risk analysis
Project Documents
update
Your risk register should include both
threats and opportunities.
Opportunities have positive impact
values, while threats have negative
ones. Don’t forget the plus or minus
sign when you’re calculating EMV.
Update the risk register based on your quantitative analysis results
When you’ve finished gathering data about the risks, you change your priorities, urgency ratings, and categories
(if necessary), and you update your risk register. Sometimes modeling out your potential responses to risk helps
you to find a more effective way to deal with them. That’s why the only output of the Perform Quantitative Risk
Analysis is project documents updates.
70
 The main output of all of the Risk Management planning processes is updated project documents, and the main
document that gets updated is the risk register.
 The first step in Risk Management is Identify Risks, where you work with the whole team to figure out what risks could
affect your project.
 Qualitative and quantitative analysis are all about ranking risks based on their probability and impact.
 Qualitative analysis is where you take the categories in your risk plan and assign them to each of the risks that you’ve
identified. ƒ
 Quantitative analysis focuses on gathering numbers to help evaluate risks and making the best decisions about how to
handle them.
 Decision tree analysis is one kind of expected monetary value analysis. It focuses on adding up all of the costs of decisions
being made on a project so that you can see the overall value of risk responses.
 To calculate EMV, be sure to treat all negative risks as negative numbers and all opportunities as positive ones. Then add
up all of the numbers on your decision tree.
 Don’t forget watch lists. They let you monitor lower-priority risks so that you can see if triggers for those risks occur and
you need to treat them as higher priorities.
 All of the processes in Risk Management are Planning or Monitoring and Controlling processes. There are no Executing
processes here. Since the goal is to plan for risks, there is no need to focus on actually doing the work. By then, it’s too
late to plan for risks.
BULLET POINT:
71
Once you’ve identified risks and ranked them according to the team’s assessment, you need to take your analysis a
little further and make sure that the numbers back you up. Sometimes you’ll find that your initial assessment needs
to be updated when you look into it further.
Planning
process group
Enterprise Enviromental
Factors
Project Management Plan
Organizational Process
Assests
Procurement DocumentsInputs
.
This includes the Resource Management
plan, Risk Management plan, and cost
baseline
.
You’ve updated your risk register
as part of all of your analysis so
far. It should contain everything
you know about the risks facing
your project, and even some
preliminary responses you might
have thought of along the way
How do you respond to a risk?
However you decide to deal with each individual risk, you’ll update your risk responses in the risk register to show your
decisions when you’re done. When you’re done with Plan Risk Responses, you should be able to tell your change control
board what your response plans are and who will be in charge of them so they can use them to evaluate changes.
72
Plan Risk Responses is
figuring out what you’ll
do if risks happen
73
Tools and Technques
Plan risk responses
 Contingent response strategies
Sometimes you need to make contingency plans in case an
event occurs in your project. Say you miss an important
milestone or a vendor you’re depending on goes out of
business. You might put together a plan that would be triggered
by that event to keep your project on track
 Expert judgment You might need to reach out to somebody
who has dealt with a risk you’ve identified before to
understand the best way to respond to it.
 Data gathering: interviews Interviewing stakeholders to get
their opinions on the best way to respond to specific risks is a
great way to put together a risk response plan.
 Data analysis: alternatives analysis and cost-
benefit analysis You know these data analysis
techniques already. They can help you figure
out the best way to respond to the risks
you’ve identified
 Interpersonal and team skills: facilitation
 Decision making
74
Tools and Technques
Plan risk responses
It isn’t always so bad
Remember the strategies for handling negative risks avoid, mitigate, transfer, accept, and escalate from
earlier? Well, there are strategies for handling positive risks, too. The difference is that strategies for
opportunities are all about how you can try to get the most out of them. The strategies for handling negative
and positive risks are the tools and techniques for the Plan Risk Responses process.
 Exploit This is when you do everything you can to
make sure that you take advantage of an
opportunity. You could assign your best resources to
it. Or you could allocate more than enough funds to
be sure that you get the most out of it
 Enhance This is when you try to make the
opportunity more probable by influencing its
triggers. If getting a picture of a rare bird is
important, then you might bring more food that it’s
attracted to
 Share Sometimes it’s harder to take advantage of an
opportunity on your own. Then you might call in
another company to share in it with you.
 Accept Just like accepting a negative risk,
sometimes an opportunity just falls in your lap. The
best thing to do in that case is to just accept it!
 Escalate If you found an opportunity that might help
your overall company strategy beyond what your
project set out to do, you might escalate that
opportunity to people who could take advantage of it.
75
Exercise
Can you figure out which risk response technique is being used in these situations? Match each technique to
its scenario.
A. Mitigate
B. Avoid
C. Accept
D. Transfer
E. Exploit
F. Share
G. Enhance
 If the weather’s good, then there’s a chance you could see a meteor shower. If the team gets a
photo that wins the meteor photo contest, you can get extra funding. You have your team stay up
all night with their telescopes and cameras ready
 You hear that it’s going to rain for the first three days of your trip, so you bring waterproof tents
and indoor projects for the team to work on in the meantime.
 You read that there’s a major bear problem in the spring on the cliff where you are planning to work.
You change your project start date to happen in the fall
 On your way up the cliff, you meet another team that is looking to survey the area. You offer to do
half of the surveying work while they do the other half and then trade your findings with each
other.
 There’s a high probability of water damage to some of your equipment, so you buy insurance to
avoid losses
 There’s always the chance that someone could make a mistake and fall off the cliff. No matter how
much you plan for the unexpected, sometimes mistakes happen
 About 10 years ago a really rare bird, the black-throated blue warbler, was seen on this cliff. If you
could get a picture of it, it would be worth a lot of money. So, you bring special seeds that you have
read are really attractive to this bird, and you set up lookout points around the cliff with cameras
ready to get the shot. 76
Add risk responses to the register
Outputs
It’s time to add you guessed it more updates to project documents, including the risk register. All of your risk
responses will be tracked through change control. Changes that you need to make to the plan will get evaluated
based on your risk responses, too. It’s even possible that some of your risk responses will need to be added into
your contract
Project Management Plan
updated
Procurement Documents
updated
Change request
The PM plan needs to be updated so that integrated change
control can include the risk responses.
77
Now that you’ve planned responses to risk, you’re ready to put that plan into action. The next process, Implement Risk
Responses, is all about what you do when you run into an occurrence of the risks you’ve identified. This is where you
actually respond to the risk by doing what’s in your plan
Implement Risk Responses
Executing
process group
Enterprise Enviromental
Factors
Project Management Plan
Organizational Process
AssestsProcurement DocumentsInputs
Lessons you’ve learned
from prior projects could
affect the way you
implement risk
responses on this one
You’ll need to consult
the Risk Management
plan to know the best
way to implement
your risk responses
78
Tools and Technques
Implement risk responses
 Interpersonal and team skills will help you influence the
people in your organization to implement the best response
to the risks you encounter while your project is executing
This is just like expert
judgment you’ve seen in
other processes.
 Project management information system will have all of the
schedule and resource information you need to make sure
risks don’t sink your project
Use all of the information available to
your team to make sure that risks are
dealt with as they occur
79
Implement risk responseOutputs
Procurement Documents
updated
Change request
Think about all of the documents that might need to change as you put your risk responses into action.
You might identify new issues that need to be added to the issue log. Or, you could learn something
new from a risk that you encounter and need to make an update to the lessons learned register. You
could need to change the way your team is assigned in order to respond to a risk that happens. There’s
always the possibility that you could need to change the risk register and the risk report themselves as
you learn more about the risks you’ve planned for.
As you respond to risk, you update your project documents
Changes to the plan will
always need to go
through change control
As you implement your
risk responses, make sure
project documents are
updated to include the
new information you
uncover.
80
Risk response can find even
more risks
Secondary risks come from a response you have to another risk.
If you dig a trench to stop landslides from taking out your camp,
it’s possible for someone to fall into the trench and get hurt
Residual risks remain after your risk responses have been
implemented. So even though you reinforce your tent stakes
and get weatherproof gear, there’s still a chance that winds
could destroy your camp if they are strong enough
81
You can’t plan for every risk at the start of the project
Monitoring &
Controlling
process group
Even the best planning can’t predict everything there’s always a chance that a new risk could crop up that you
hadn’t thought about. That’s why you need to constantly monitor how your project is doing compared to your
risk register. If a new risk happens, you have a good chance of catching it before it causes serious trouble. When
it comes to risk, the earlier you can react, the better for everybody. And that’s what the Monitor Risks process is
all about.
Risk monitoring is an active process that requires participation from the project manager, the project team, key
stakeholders, and, in particular, risk owners within the project. As the project progresses, risk conditions may
change and require new responses, additional planning, or the implementation of a contingency plan.
Risks must be actively monitored, and new risks must be responded to as they are discovered.
Risk monitoring is the process of monitoring identified risks for signs that they may be occurring, addressing
identified risks with the agreed-upon responses, looking for new risks that may creep into the project, and then
following the outcomes of the risk responses to track their effectiveness.
Risk monitoring also is concerned with the documentation of the success or failure of risk response plans and
keeping records of metrics that signal risks are occurring, fading, or disappearing from the project.
82
There are several goals to risk monitoring:
 To determine whether the project contingency reserves (cost and schedule) are adequate
 To confirm that risk responses are implemented as planned
 To determine whether risk responses are effective or whether new responses are needed
 To determine the validity of the project assumptions
 To determine whether risk exposure has changed, evolved, or declined due to trends in the project progression
 To monitor risk triggers
 To confirm that policies and procedures happen as planned
 To monitor the project for new risks
 To confirm the continued validity of the risk management approach
83
Monitor Risks is another change control process
Risk responses are treated just like changes. You monitor the project in every status meeting to see how the risks in the
risk register are affecting it. If you need to implement a risk response, you take it to your change control board, because
it amounts to a change that will affect your project constraints.
Work Performance
Report
Project Management
Plan
Work performace
data Inputs
Project Documents
84
Risk monitoring
should be done at
every status meeting
85
Work performance data and work performance reports The results of project work can inform the project manager
and the project team of new and pending risks. In addition, project team members may create reports to monitor
or document risks. Project performance focuses on the balance of the project schedule, costs, and scope. Should
the performance of time, cost, or scope suffer, new risks are likely to enter the project
The risk management plan Defines the organization’s approach to risk management. It is not the strategy for
specific risks within a project, but the overall strategy for risk analysis and planning.
Project documents The central repository for all project risk information, the risk register, is the primary document
you’ll need. The risk register includes the identified risks, the potential responses, the root causes of risks, and
any identified categories of risk. You may also reference the lessons learned register, the issue log, and the risk
report.
Inputs
86
Tools and Technques
Monitor risk
 Technical performance analysis Comparing the actual project performance to
the plan is a great way to tell if a risk might be happening. If you find that
you’re significantly over budget or behind schedule, a risk could have
cropped up that you didn’t take into account.
 Reserve analysis Just like you keep running tabs on your budget, you should
always know how much money you have set aside for risk response. As you
spend it, be sure to subtract it so you know if you have enough to cover all of
your remaining risks. If you start to see that your reserves are running low and
there are still a lot of risks being identified, you might be in trouble.
Here are the data analysis techniques you’ll need to use when you monitor your risks
Analyze the data you gather in project status meetings to determine how your project is managing risk.
87
Tools and Technques
Monitor risk
There are just a few more tools in the Monitor Risks process. They’re all focused on finding new risks if they
crop up, dealing with changes to the risks you’ve already planned for, and responding quickly to risks you
know how to handle.
 Audits are when you have an outside party come in and take a look at your risk response
strategies to judge how effective they are. Sometimes risk audits will point out better ways
of handling a specific risk so that you can change your response strategy going forward
 Meetings are the most important way to keep the team up to date on risk planning
so important that they should happen throughout the entire project. The more you
talk about risks with the team, the better. Every single status meeting should have
risk review on the agenda. Status meetings are a really important way of noticing
when things might go wrong, and of making sure that you implement your response
strategy in time.
88
Exercise
Here are some risk monitoring and control activities. Can you determine which of the tools is being
used in each one?
1. At every milestone, you do a new round of Identify Risks
and make sure that the risks in your risk register still apply
to the project
2. You check to make sure that you have all of the features
developed in your project that you had planned when you
reach the “feature complete” milestone. When you find that
you are missing one of the planned features, you realize that
a new risk has shown up you missed one of the required
features in your functional specification
3. You take a look at the number of defects you have found
in your project per phase and find that it is higher in your
project than it has been in most other projects that the
company is doing. You dig a little deeper and find some
previously unplanned risks that have been causing trouble
on your project
4. Your company sends a risk expert in to take a look at your
risk response strategies. She finds that you are missing a few
secondary risks that might be caused by the responses you
have planned. So you update your risk register to include the
secondary risks.
5. You decide to implement a risk response that costs
$4,000. You check to make sure that you have enough money
to cover the rest of the risks that might happen from here on
out in the project.
89
Dumb Questions
Q:: Why do I need to ask about risks at every status meeting
Q: I still don’t get technical performance analysis. How does it help me find risks?
Q: Why do we do risk audits?
Q: Hold on, didn’t we already talk about reserves way back in the Cost Management
chapter? Why is it coming up here?
Monitor Risk
Q: Shouldn’t I ask the sponsor about risks to the project
Q:Hey, didn’t you talk about risks back in the Project Schedule Management chapter too
90
The better you prepare
for risks, the more
secure your project is
against the unknown.
91
Risk monitoring helps the project become more successful. It measures the planned responses to risks and
creates reactions to unplanned risks. The outputs of risk monitoring also aim to help the project reach its
objectives. The process has several outputs
Examining The Results Of Risk Monitoring
Outputs
 Change requests Risk monitoring may cause the project’s cost or schedule baseline to need to be updated. The
update of a baseline will need a change request that follows the integrated change control process. Project
management plan updates could also be an output of this process, and these updates will also require a change
request. Corrective actions are taken to bring the project back into compliance with the project plan. Preventive
actions are taken to bring the project back into alignment with the project management plan.
 Work performance information What happens in the project because of monitoring risks and risk responses will
create work performance information. This information affects what needs to be communicated and what actions
the project manager and team may take next, and it helps with project decisions.
 Project document updates As the project moves along and the project manager and the project team complete the
risk assessments, audits, and risk reviews, they’ll need to record their findings in the risk register, risk report, or
both.
 Organizational process assets updates The risks from the current project can help other project managers in the
future. Therefore, the project manager must work to ensure that the current risks, their anticipated impact, and
their actual impact are recorded
92
Risk monitoring and
controlling is exactly
like the other change
control processes.
93
KEY TERMS
For maximum value, create your own flashcards based on these definitions and review them daily. You can find additional
information on these terms in the project glossary
 acceptance A response to a risk event, generally made when the probability of the event and/or its impact is
small. No proactive action is taken on the risk. It is used when escalation, mitigation, transference, and avoidance
are not selected.
 ambiguity risks These risks are impossible to predict accurately: certainty of a new technical solution, future laws
or regulations, or even complexity in the project approach.
 avoidance One response to a risk event. The risk is avoided by removing the risk from the project.
 brainstorming The most common approach to risk identification; it is performed by a project team to identify the
risks within the project. A multidisciplinary team, hostedby a project facilitator, can also perform brainstorming.
 bubble chart A hierarchical chart that uses three parameters for mapping the axes of the risks and the magnitude
of the third parameter. The larger the bubble the more significant parameter.
 cause-and-effect diagrams Used for root-cause analysis of what factors are creating the risks within the project.
The goal is to identify and treat the root of the problem, not the symptom
94
KEY TERMS
For maximum value, create your own flashcards based on these definitions and review them daily. You can find additional
information on these terms in the project glossary
 commercial risks When working with vendors, new risks are introduced to the project specific to the contractual
relationship. Risk categories can include the contract terms, internal procurement procedures, suppliers,
subcontracts, client and customer stability, and any partnerships or joint ventures.
 contingency reserve A time or dollar amount allotted as a response to risk events that may occur within a project.
 decision tree analysis A type of analysis that determines which of two decisions is the best. The decision tree assists
in calculating the value of the decision and determining which decision costs the least.
 Delphi Technique A method to survey experts anonymously on foreseeable risks within the project, phase, or
component of the project. The results of the survey are analyzed and organized, and then circulated to the experts.
There can be several rounds of anonymous discussions when using the Delphi Technique. The goal is to gain consensus
on project risks, and the anonymous nature of the process ensures that no one expert’s advice overtly influences the
opinions of other participants.
 enhance To enhance a risk is to attempt to modify its probability and/or its impacts to realize the most gains from it.
Enhance applies only to positive risks (opportunities).
95
KEY TERMS
For maximum value, create your own flashcards based on these definitions and review them daily. You can find additional
information on these terms in the project glossary
 escalate risk response Some risks that are outside of the boundary of the project should be escalated when the
project team, project sponsor, or project manager believes the risk management would exceed the authority the
project manager has over the risk event.
 exploit The organization wants to ensure that the identified risk does happen to realize the positive impact
associated with the risk event.
 individual project risks An individual risk that hinders or helps realize the project objectives.
 influence diagram A diagram that charts out a decision problem. It identifies all of the elements, variables,
decisions, and objectives—and how each factor may influence another.
 mitigation A process of reducing the probability or impact of a risk.
 overall project risk A combination of all risk events that will reveal the project’s risk exposure and determine just
how risky the project is for the organization.
 PESTLE Analysis of overall project risks by determining political, economic, social, technological, legal, and
environmental uncertainty
96
 qualitative risk analysis An examination and prioritization of the risks based on their probability of occurring and the
impact on the project if they do occur. Qualitative risk analysis guides the risk reaction process.
 quantitative risk analysis A numerical assessment of the probability and impact of the identified risks. Quantitative
risk analysis also creates an overall risk score for the project.
 residual risks Risks that are left over after mitigation, transference, and avoidance. These are generally accepted
risks. Management may elect to add contingency costs and time to account for the residual risks within the project.
 risk An uncertain event that can have a positive or negative influence on the project’s success.
 risk categories These help organize, rank, and identify risks within the project.
 risk management plan A subsidiary project management plan for determining how risks will be identified, how
quantitative and qualitative analyses will be completed, how risk response planning will happen, how risks will be
monitored, and how ongoing risk management activities will occur throughout the project life cycle.
KEY TERMS
For maximum value, create your own flashcards based on these definitions and review them daily. You can find additional
information on these terms in the project glossary
97
KEY TERMS
 risk owners The individuals or groups responsible for a risk response.
 risk register Documentation of all risk events and their conditions, impact, probability, and overall risk score.
 risk report A document that explains the overall project risks and provides a summary about the individual project
risks. You’ll update the risk report through the project as more information becomes available through analysis and
experience in the project.
 scales of probability and impact Used in a risk matrix in both qualitative risk analysis and quantitative risk analysis to
score each risk’s probability and impact.
 secondary risks Risks that stem from risk responses. For example, the response of transference may call for hiring a
third party to manage an identified risk. A secondary risk caused by the solution is the failure of the third party to
complete its assignment as scheduled. Secondary risks must be identified, analyzed, and planned for, just like any
other identified risk.
 sensitivity analysis Examines each project’s risk on its own merit to assess the impact on the project. All other risks
in the project are set at a baseline value.
For maximum value, create your own flashcards based on these definitions and review them daily. You can find additional
information on these terms in the project glossary
98
 share Sharing is nice. When sharing, the risk ownership is transferred to the organization that can most capitalize
on the risk opportunity.
 simulation Allows the project team to do “what-if” analysis without affecting any areas of production.
KEY TERMS
For maximum value, create your own flashcards based on these definitions and review them daily. You can find additional
information on these terms in the project glossary
 system or process flowcharts Show the relationship between components and how the overall process works. They
are useful for identifying risks between system components.
 TECOP Analysis of overall project risks by determining technical, environmental, commercial, operational, and
political uncertainty.
 transference A response to risks in which the responsibility and ownership of the risk are transferred to another
party (for example, through insurance).
 triggers Warning signs or symptoms that a risk has occurred or is about to occur (for example, a vendor failing to
complete their portion of the project as scheduled).
99
 utility function A person’s willingness to accept risk. The higher the utility function, the more likely the person or
organization is willing to accept risk.
 variability risks Uncertainty surrounding a project activity or decision. Fluctuations in productivity, number or
errors and defects, or even the weather affecting the project are all examples of variability risks.
 VUCA Analysis of overall project risks by determining volatility, uncertainty, complexity, and ambiguity.
 workarounds Unplanned responses to risks that were not identified or expected.
KEY TERMS
For maximum value, create your own flashcards based on these definitions and review them daily. You can find additional
information on these terms in the project glossary
100
Thank You

Project Risk Management

  • 1.
  • 2.
    11 Project RiskManagement Planning for the Unknown Gwamaka, What if these ropes break Don’t worry, Flora! I took care of it with risk planning. We can swing away without a care in the world Prepared by Kelvin Fredson2
  • 3.
  • 4.
    What is risk? Arisk can be an event (like a fire), or it can be a condition (like an important part being unavailable). Either way, it’s something that may or may not happen…but if it does, you will be forced to change the way you and your team work on the project. There are no guarantees on any project! Even the simplest activity can run into unexpected problems. Any time there’s anything that might occur on your project and change the outcome of a project activity, we call that a risk. Within a project, risks are unplanned events or conditions that can have positive or negative effects on a project’s success. Not all risks are bad, but almost all are seen as a threat. Even launching a project represents risk, because the project could succeed or fail there’s uncertainty in the endeavor 4
  • 5.
    No matter howwell you plan, your project can always run into unexpected problems. Team members get sick or quit, resources that you were depending on turn out to be unavailable even the weather can throw you for a loop. So does that mean that you’re helpless against unknown problems? No! You can use risk planning to identify potential problems that could cause trouble for your project, analyze how likely they’ll be to occur, take action to prevent the risks you can avoid, and minimize the ones that you can’t Even the most carefully planned project can run into trouble. A project manger’s work should not focus on dealing with problems; it should focus on preventing them Through risk management, the project manager can stay in control of the project, rather nthan being controlled by it. 5
  • 6.
    What is risk? Arisk is any uncertain event or condition that might affect your project. Not all risks are negative. 6
  • 7.
    Some events (likefinding an easier way to do an activity) or conditions (like lower prices for certain materials) can help your project! When this happens, we call it an opportunity…but it’s still handled just like a risk. Not all risks are negative 7
  • 8.
    How you dealwith risk When you’re planning your project, risks are still uncertain: they haven’t happened yet. But eventually, some of the risks that you plan for do happen. And that’s when you have to deal with them. There are five basic ways to handle a risk: Avoid The best thing that you can do with a risk is avoid it if you can prevent it from happening, it definitely won’t hurt your project Mitigate If you can’t avoid the risk, you can mitigate it. This means taking some sort of action that will cause it to do as little damage to your project as possible Transfer One effective way to deal with a risk is to pay someone else to accept it for you. The most common way to do this is to buy insurance Accept When you can’t avoid, mitigate, or transfer a risk, then you have to accept it. But even when you accept a risk, at least you’ve looked at the alternatives and you know what will happen if it occurs Escalate If the risk is not in your project’s scope, you might need to tell somebody else about it to find an appropriate response. 8
  • 9.
    Risk Management Is theprocess of identifying, evaluatiing, and planing responses to events, both positive and negative, that might occur throughout the course of a project. Through risk management, you increase the probability and impact of opportunities on the project (positive events) while decreasing the probability and impact of threats to the project (negative events) Risk management is the process by which the project manager and project team identify project risks, analyze and rank them, and determine what actions, if any, need to be taken to avert these threats. Associated with this process are the costs, schedule, and quality concerns of the project brought about by the solutions to those risks. Risks are identified and managed starting in initiating and are kept up to date while the project is underway. The project manager and the team look at what has happened on the project, the current status of the project, and what is yet to come and reasssess the potential threats and opportunities. 9
  • 10.
    In this chapter,we’ll discuss risk management planning, risk identification and analysis, response planning and implementation, and monitoring the identified risks 10
  • 11.
    Building A StrongRisk Understanding Risks in project management are either threats, which are negative risk events, or opportunities, which are positive risk events. Negative risk events are easy to see: loss of data, potential for injury, late resource delivery from a vendor Positive risk events are sometimes cloudier to see, but they do exist. Consider investing in a faster piece of equipment, hiring a vendor to do a portion of the project work, or saving costs by paying in advance for a service the project needs. Positive risks are opportunities to save time, money, or effort, or to increase productivity. Some risks, positive or negative, are negligible and are documented and accepted, while other risk events need to be quantified, planned for, and closely monitored throughout the project 11
  • 12.
    There are twolevels of risks in a project to consider: Individual project risks The risk events that can hinder or help the project reach its objectives Overall project risk The combination of all risk events that will reveal the project’s risk exposure and determine just how risky the project is for the organization Generally, the higher the project priority, the more willing the organization is to spend time or money to address risk events. You’ll also consider business risks and pure risks in a project. 12
  • 13.
    Integrated risk managementis part of the organization’s approach to risk. It’s the distribution of risk events and how the risks are managed. Some risks may be assigned to the project manager to manage, and some risks may need to be escalated to management to address and manage Integrated risk management The integrated nature of risk management is beyond the boundaries of project management; the risk should be given to the party who’s most appropriate to manage the risk event for the organization, not just the project or even the program. For agile projects, uncertainty is part of the approach. Because of the nature of uncertainty and the expectation of change in an agile project, there are iteration reviews, knowledge sharing, and risk management involved at each iteration. The project team, the product manager, and the project manager all work together at the beginning of an iteration to address potential risks and at the end of the iteration to review what did, or didn’t, work in the iteration While the iteration is in motion, the project team and project manager work to monitor and address risks as they may be pending or have happened. The team is empowered to address the risk events to achieve the project’s objectives in the current iteration 13
  • 14.
    Tailoring Risk ManagementIn Projects Like all knowledge areas, you can also tailor risk management to fit your organization and processes. Risk management should always be adjusted to fit the project you’re managing—there is no blanket approach to risk management that will fit every project. For risk management in your projects you’ll have to consider the following:  Size of the project Larger projects generally require a more formal risk management approach than smaller, low- priority projects.  Complexity of the project Simple is always better when it comes to project management, but that’s not always feasible. A complex project, based on the technology involved, the endeavor’s work, and external dependencies, can include many uncertainties that have to be addressed in risk management.  Importance of the project A high-profile project that the organization considers important for opportunities, investment, reputation, and other considerations will warrant a well-thought-out project management risk approach.  Development of the project A waterfall or predictive project calls for risk planning upfront, as opposed to an agile project, where risks are addressed at the start of each iteration. Both project types call for risk management, but the approach is different with each type. 14
  • 15.
    Risk Factors When assessingrisk, it’s necessary to determine the following: The probability that a risk event will occur (how likely) The range of possible outcomes (impact or amount at stake) Expected timing for it to occur in the project life cycle (when) The anticipated frequency of risk events from that source (how often) 15
  • 16.
    Defiining the Concepts Aswe continue discusing this Knowledge area, remember the basic, yet very important cocepts Uncertainty: Is a lack of knowledge about an event that reduce confidence in conclusions drawwn from data. The work that needs to be done, the cost, the time, the quality needs, the communications needs,etc. can be uncertainty Risk Appetites: (which is also referred to risk tolerence) is a general, high level description of the level of risk acceptable to an individual or an organization. For example a sponsor is willing to accept a little risk to the schedule on this project.. Risk threshold: refers to the specific point at which risk becomes unacceptable . For example, the sponso will not accept a risk of the schedule being delayed 15 days or longer. Risk Averse: Someone whomdoes not want to be negatively impacted by threats is risk averse. 16
  • 17.
    Risk Management Process TheScope Management Process Done During Done During Planning process Planning process Planning process Planning process Monitoring & controlling Implement Risk Responses Plan Risk Responses Perform Quantitative Risk Analysis Perform Qualitative Risk Analysis Identify Risks Plan Risk Management Planning process Executing process Monitor Risks
  • 18.
    Plan Risk Management Isthe process of defining how to conduct risk management activities for project. Key benefit of this process is that it ensures that the degree, tyoe, and visibilty of risk management are proportionate to both isk and the importance of the project to the organization and other stakeholders. By now, you should have a pretty good feel for how each of the planning processes works. The past few knowledge areas started out with their own planning process, and Risk Management is no different. You start with the Plan Risk Management process, which should look very familiar to you. Planning process group Up to 90 percent of the threats identified and investigated in the risk management process can be eliminated by changing how the project work is planned and performed 18
  • 19.
    Plan Risk Management Inputs OrganizatonalProcess Assets Project Documents Project Management Plan Project Charter Enterprise Enviromental Factors 19
  • 20.
    Watch it! Youmay get a question on the exam that asks which processes use organizational process assets! Think about why you need them for Plan Risk Management and the other planning processes. That should help you remember which processes need them. Are you starting to see a pattern here? 20
  • 21.
    You’ll keep meetingwith them throughout your project to stay on top of risks. Data analysis Meetings Expert Judgment Plan Risk Management – Tools & Techniques 21
  • 22.
    Plan Risk Management- Outputs The Risk Management plan is the only output It tells you how you’re going to handle risk on your project which you probably guessed, since that’s what management plans do. It says how you’ll assess risk on the project, who’s responsible for doing it, and how often you’ll do risk planning (since you’ll have to meet about risk planning with your team throughout the project Risk Management Plan Output It tells you who identifies and analyzes the risks, how they do it, and how often it happen 22
  • 23.
    The plan hasparts that are really useful for managing risk: Risk Management Plan.........  It has a bunch of risk categories that you’ll use to classify your risks. Some risks are technical, like a component that might turn out to be difficult to use. Others are external, like changes in the market or even problems with the weather. Risk categories help you to build a risk breakdown structure (RBS).  You’ll need to describe the methods and approach you’ll use for identifying and classifying risks on your project. This section of the document is called the methodology  It’s important to come up with a plan to help you figure out how big a risk’s impact is and how likely a risk is to happen. The impact tells you how much damage the risk will cause to your project. A lot of projects classify impact on a scale from minimal to severe, or from very low to very high. This section of the document is called the definitions of probability and impact  Roles and Responsibilities, who will do what risk maanagement work, Stakeholders outside the project team may have roles and responsibilities regarding risk management  Funding, Plan for utilizing reserves in response to risks on the project  Timing, When to do risk management for the project. Risk management should start as soon as you have the appropriate inputs and should be repeated throughout the life of the project, since new risks can be identified as the project progress and degree of risk can change over course of a project. 23
  • 24.
    Use a riskbreakdown structure to categorize risk You should build guidelines for risk categories into your Risk Management plan, and the easiest way to do that is to use a risk breakdown structure (RBS). Project risks Technical risks External risks Organizational risks Quality Issues Part compatibility New government regualtions Customer Issues Weather problems Project priority changes Staff attrition Fundind cuts When you sit down with the team to come up with a list of risks, the RBS will be really useful. The categories are a great reminder when you’re brainstorming 24
  • 25.
    Exercise Take a lookat how each of these project risks is handled and figure out if the risk is being avoided, mitigated, transferred, or accepted. 1. Stormy weather and high winds could cause very slippery conditions, so you put up a tent and wear slip-resistant footwear to keep from losing your footing 2. You buy a surge protector to make sure a lightning strike won’t blow out all of your equipment 3. Flooding could cause serious damage to your equipment, so you buy an insurance policy that covers flood damage. 4. The manufacturer issues a warning that the safety equipment you are using has a small but nonzero probability of failure under the conditions that you’ll be facing. You replace it with more appropriate equipment 5. A mud slide would be very damaging to your project, but there’s nothing you can do about it. 6. A team member discovers that the location you planned on using is in a county that is considering regulations that could be expensive to comply with. You work with a surveying team to find a new location 7. Surrounding geological features could interfere with your communications equipment, so you bring a flare gun and rescue beacon in case it fails. 25
  • 26.
    Anatomy of arisk Once you’re done with Plan Risk Management, there are four more Risk Management processes that will help you and your team come up with the list of risks for your project, analyze how they could affect it, and plan how you and your team will respond if any of the risks materialize when you’re executing it Identify risk Perform Qualitative risk Analysis Perform Quantitatice risk Analysis Plan risk response The first thing you need to do when planning for risks is to gather the team together and come up with a list of every possible risk you can think of Once you’ve got a list of risks, you’ll need to get a good idea of the probability and impact of each risk You can make better decisions with more precise data. That’s what this process is about—assigning numerical values for the probability and impact of each risk All that’s left now is to plan responses to each risk! This is where you decide whether to avoid, mitigate, transfer, or accept…and how you’ll do it! Prepared by Kelvin Fredson26
  • 27.
    All four ofthese Risk Management processes are in the Planning process group you need to plan for your project’s risks before you start executing the project 27
  • 28.
    What could happento your project? You can’t plan for risks until you’ve figured out which ones you’re likely to run into. That’s why the next Risk Management process is Identify Risks. The idea is that you want to figure out every possible risk that might affect your project Planning process group Identifying Risks After completing the risk management plan, you’ll need to get to work identifying risks that can hinder the project’s success. Risk identification is the process of identifying the risks and then documenting how their presence can affect the project. Risk identification is an iterative process and can be completed by the project manager, the project team, a risk management team, and even SMEs. In some instances, stakeholders and even people outside of the project can complete additional waves of risk identification. Risk identification addresses both individual risks and the overall project risks. 28
  • 29.
    Watch it! The bestanswer is “everyone” Each stakeholder has a different perspective of the project and can provide thoughts on opportunities and threats. When you get a question about who should be involved in risk identification? 29
  • 30.
    Project managers shouldbegin looking for risks as soon as a project is first discussed. In fact, an assessment of overall project risk is included in the project charter. However, the major risk identification effort occurs during planning. The project manager will need to have skills to faciliate the identification of all risks ( or as may risk as reasonably possible) But keep in mind that smaller numbers of risks may also be identified later in the project. Risk should continually readdedded. But for PMP exam risk identification is done during integrate changr control, when working with contracts, when working with resources, and when dealing with project issues Inputs Enterprise Enviromental Factors Project Management Plan Organizational Process Assests Project Documents Procurement Documents Agreements30
  • 31.
    Risk Register The riskregister is the only output and it’s the most important part of Risk Management. It’s a list of all of the risks and some initial ideas about how you’d respond to them 31
  • 32.
    The goal ofall of the risk planning processes is to produce the risk register. That’s your main weapon against risk. 32
  • 33.
    Data gathering techniquesfor Identify Risks Tools & Techniques The most important way to identify those risks is to gather data from the team. That’s why the first and most important technique in Identify Risks is called data-gathering techniques. These are time-tested and effective ways to get data from your team, stakeholders, and anyone else who might have data on risks. Useful data gathering techniques There are a lot of different ways that you can find risks on your project. But there are only a few that you’re most likely to use and those are the ones that you will run across on the exam.  Brainstorming is the first thing you should do with your team. Get them all together in a room, and start pumping out ideas. Brainstorming sessions always have a facilitator to lead the team and help turn their ideas into a list of risks  Interviews are a really important part of identifying risk. Try to find everyone who might have an opinion and ask them about what could cause trouble on the project. The sponsor or client will think about the project in a very different way than the project team. 33
  • 34.
     Checklist analysismeans using checklists that you developed specifically to help you find risks. Your checklist might remind you to check certain assumptions, talk to certain people, or review documents you might have overlooked. Tools & Techniques Useful data gathering techniques……. What’s the big difference between brainstorming and the interviews? Can you think of a situation where one would be more useful than the other? 34
  • 35.
    More Identify Riskstechnique Tools & Techniques Even though gathering data is the biggest part of Identify Risks, it’s not the only part of it. There are other tools and techniques that you’ll use to make sure that the risk register you put together lists as many risks as possible. The more you know about risk going into the project, the better you’ll handle surprises when they happen. And that’s what these tools and techniques are for looking far and wide to get every risk possible. Data analysis tools and techniques  Document analysis is when you look at plans, requirements, documents from your organizational process assets, and any other relevant documents that you can find to squeeze every possible risk out of them  SWOT analysis lets you analyze strengths, weaknesses, opportunities, and threats. You’ll start by brainstorming strengths and weaknesses, and then examine the strengths to find opportunities, and the weaknesses to identify threats to the project  Root-cause identification is analyzing each risk and figuring out what’s actually behind it. Even though falling off of the cliff and having your tent blow away are two separate risks, when you take a closer look you might find that they’re both caused by the same thing: high winds, which is the root cause for both of them. So you know that if you get high winds, you need to be on the lookout for both risks 35
  • 36.
     Assumptions andconstraint analysis is what you’re doing when you look over your project’s assumptions. Remember how important assumptions were when you were estimating the project? Well, now it’s time to look back at the assumptions you made and make sure that they really are things you can assume about the project. Wrong assumptions are definitely a risk.  Interpersonal and team skills help the team to get broad participation in risk identification. Specifically, the facilitation skill is important to this process  Prompt lists are lists of risk categories that you and the team use to jog your memory when you’re identifying risks. You might use the risk categories from the lowest level of the risk breakdown structure to get the team started thinking about risks that could occur on your project as an example  Expert judgment lets you rely on past experience to identify risks  Meetings are where your team gets together to identify risks as a group. Data analysis tools and techniques…….. 36
  • 37.
    SWOT stands forstrengths, weaknesses, opportunities, and threats. SWOT analysis is the process of examining the project from the perspective of each characteristic. For example, a technology project may identify SWOT as follows: In depth: SWOT Strenghts Threats Oportunities Weakness  Strengths The technology to be installed in the project has been installed by other large companies in our industry.  Weaknesses We have never installed this technology before.  Opportunities The new technology will allow us to reduce our cycle time for time to-market on new products.  Threats The time to complete the training and simulation may overlap with product updates, new versions, and external changes to our technology portfolio. 37
  • 38.
    Diagramming Technique In depth.... Theproject team can utilize several diagramming techniques to identify risks:  Ishikawa These cause-and-effect diagrams, as shown, are also called fishbone diagrams. They are great for the root- cause analysis of factors that are causing risks within the project. The goal is to identify and treat the root of the problem, not the symptom. Schedule MaterialsEquipments Labor AvailabilityAbility Major Defects  Flowcharts System or process flowcharts show the relationship between components and how the overall process works. These are useful for identifying risks between system components. 38
  • 39.
     Influence diagramsAn influence diagram, shows out a decision problem. It identifies all the elements, variables, decisions, and objectives and how each factor may influence another In depth..... Market Budget Gross Price Retail Price Competition Market Share Sales Gross Income Cost Net Income Market Size 39
  • 40.
    Using Prompt Lists Indepth......: If you’re doing the same types of projects over and over, such as IT projects or construction projects, you might use a prompt list to help the project team better identify project risks. Prompt lists are risk categories that were identified in the risk management plan. For example, your prompt list might ask, “What type of risks are lurking in hardware for this project?” or “Are there any new materials that could have risks we should consider?” The prompt list prompt risk identification participants to think about individual risks based on the prompts you include. Overall project risks subscribe to one of three common types of prompt lists:  VUCA volatility, uncertainty, complexity, and ambiguity  TECOP technical, environmental, commercial, operational, and political  PESTLE political, economic, social, technological, legal, and environmental 40
  • 41.
    Read each ofthese scenarios and identify which tool or technique is being used. If a scenario uses a data- gathering technique, specify which one.Exercise 1. Your project requires that you set up a campsite on the edge of a cliff. You gather your team members including a geologist, a meteorologist, a tracker, and three campsite workers and lead them in a directed discussion where they identify as many risks as possible 2. You look through your company’s asset library and discover that two previous projects involved setting up camp in this area. You look through the lessons learned to figure out what went wrong, and what could have been avoided through better planning. 3. You meet individually with many different people: the sponsor, stakeholders, team members, and experts. You ask each of them detailed questions about what they think could go wrong on the project 4. You’ve identified a risk that is very complex, so you try to find out what made it happen. You use an Ishikawa diagram to gain insight into it. 5. You’ve reviewed your estimates and find that you had assumed that seasonal weather patterns would hold. If they change, then it could cause serious problems with the project. 41
  • 42.
    Where to lookfor risks A good way to understand risks is to know where they come from. If you start thinking about how you find risks on your project, it will help you figure out how to handle them. Here are a few things to keep in mind when you’re looking for risks: 1 Resources are a good place to start. Have you ever been promised a person, equipment, conference room, or some other resource, only to be told at the last minute that the resource you were depending on wasn’t available? What about having a critical team member get sick or leave the company at the worst possible time? Check your list of resources. If a resource might not be available to you when you need it, then that’s a risk. 2 The critical path is full of risks. Remember the critical path method from Chapter 6? Well, an activity on the critical path is a lot riskier than an activity with plenty of float, because any delay in that activity will delay the project. 3 ”When you assume...” Have you ever heard that old saying about what happens when you assume? At the beginning of the project, your team had to make a bunch of assumptions in order to do your estimates. But some of those assumptions may not actually be true, even though you needed to make them for the sake of the estimate. It’s a good thing you wrote them down now it’s time to go back and look at that list. If you find some of them that are likely to be false, then you’ve found a risk. 4 Look outside your project. Is there a new rule, regulation, or law being passed that might affect your project? A new union contract being negotiated? Could the price of a critical component suddenly jump? There are plenty of things outside of your project that are risks and if you identify them now, you can plan for them and not be caught off guard 42
  • 43.
    If an activitythat’s not on the critical path has a really small float, that means a small problem could easily cause it to become critical which could lead to big delays in your project. Finding risks means talking to your team and being creative. Risks can be anywhere Remember: 43
  • 44.
    Now put itin the risk register The point of the Identify Risks process is to identify risks. But what does that really give you? You need to know enough about each risk to analyze it and make good decisions about how to handle it. So when you’re doing interviews, leading brainstorming sessions, analyzing assumptions, gathering expert opinions, and using the other Identify Risks tools and techniques, you’re gathering exactly the things you need to add to the risk register. Outputs The other major output of the Identify Risks process is the risk report and Project documents updates. As you work through all of the Risk Management process, you’ll be compiling a report of the sources of risk to your project and summary-level information Risk report Project document update While you identify risks, you might find changes to your assumption log, issue log, or lessons learned register 44
  • 45.
    Rank your risks Planning processgroup It’s not enough to know that risks are out there. You can identify risks all day long, and there’s really no limit to the number of risks you can think of. But some of them are likely to occur, while others are very improbable. It’s the ones that have much better odds of happening that you really want to plan for Besides, some risks will cause a whole lot of damage to your project if they happen, while others will barely make a scratch and you care much more about the risks that will have a big impact. That’s why you need the next Risk Management process, Perform Qualitative Risk Analysis so you can look at each risk and figure out how likely it is and how big its impact will be on your project. Perform Qualitative Risk Analysis Once you’ve got a list of risks, you’ll need to get a good idea of the probability and impact of each risk 45
  • 46.
    When you thinkof “qualitative,” think of qualifying. You are qualifying, or justifying, the seriousness of the risk for further analysis. All the different risks’ impact on the project should be considered and ultimately quantified: schedule impact, health and safety, even reputational risks. When you think of quantitative, think of quantifying the risk’s financial effect on the project. Watch it! 46
  • 47.
    Qualitative risk analysis“qualifies” the risks that have been identified in the project. Specifically, qualitative risk analysis examines and prioritizes the risks based on their probability of their occurrence and the impact on the project if they did occur. Qualitative risk analysis is a broad approach to ranking risks by priority, which then guides the risk reaction process. The facilitator of the qualitative risk analysis process, whether an expert or the project manager, must be aware of perception and bias of how and why risks are rated by the participants Qualitative is subjective, because it’s really a fast human judgment based on experience, a gut feeling, or a best guess about the risk’s impact and probability. Remember Qualitative risk analysis is a subjective analysis of the risk identified in the risk register Keep in mind that this process is repeated as new risks are uncovered throughout the project 47
  • 48.
    To perform thisanalysis, the following must be determined The probability of each risk occuring, using a standard scale (common subjective analysis scales include low,Medium,High and 1 to 10) The impact (the amount at stake or the positive or negative consequences) of each risk occurin, using a standard scale, such as low,Medium,High or 1 to 10 48
  • 49.
    What we need Inputs Enterpriseenviromental factors Organizational process assests Project documents Project Management Plan A good way to figure out whether a risk is likely is to look at lessons learned and see if it happened before You need to know what risks you’ve identified in order to analyze them, so the risk register is an important project document to include 49
  • 50.
     Expert judgmentdefinitely comes in handy when you’re assessing risks. Who better to help you come up with things that might go wrong than experts who have been through similar projects before?  Risk categorization is all about grouping your risks so that you can come up with a better strategy for dealing with them. You might group them by the phase of the project where you’ll see them, or by the source of the risk. Or you could come up with a bunch of additional categories that would help you to organize your responses better and be ready for the risk if it should happen  Interpersonal and team skills facilitation  Meetings Tools and Technques Perform qualitative risk analysis 50
  • 51.
    Tools and Technques Examineeach risk in the register Not all risks are created equal. Some of them are really likely to happen, while others are almost impossible. One risk will cause a catastrophe on your project if it happens; another will just waste a few minutes of someone’s time  Interviews are a great way to get a sense for how important or likely people think a risk is.  Risk data quality assessment means making sure that the data you’re using in your risk assessment is accurate. Sometimes it makes sense to bring in outside experts to check out the validity of your risk assessment data. Sometimes you can even confirm the quality of the data on your own, by checking some sample of it against other data sources  Assessment of other risk parameters is about urgency and criticality of risks. One way to assess these parameters is to check out how soon you’re going to need to take care of a particular risk. If a risk is going to happen soon, you’d better have a plan for how to deal with it soon, too. Data gathering  Risk probability and impact assessment is one of the best ways to be sure that you’re handling your risks properly by examining how likely they are to happen, and how bad (or good) it will be if they do 51
  • 52.
    Tools and Technques Performqualitative risk analysis Data representation  A Probability and Impact matrix is a table where all of your risks are plotted out according to the values you assign. It’s a good way of looking at the data so you can more easily make judgments about which risks require a response. The ones with the higher numbers are more likely to happen and will have a bigger impact on your project if they do. So you’d better figure out how to handle those.  Hierarchical charts show how risks relate to each other. Most charts are organized by risk category so that teams can plan risk responses by category as well. 52
  • 53.
    Sometimes you’ll findthat some risks have obviously low probability and impact, so you won’t put them in the main section of your register. Instead, you can add them to a separate section called the watch list, which is just a list of risks. It’ll include risks you don’t want to forget about, but which you don’t need to track as closely. You’ll check your watch list from time to time to keep an eye on things 53
  • 54.
    Qualitative analysis helpsyou figure out which risks are most important to your project’s success. When you’ve finished your analysis, you should have a risk register that tells you a lot more about what could go wrong Outputs Perform qualitative risk analysis Project Documents update The only output of Perform Qualitative Risk Analysis is project documents updates including updates to the risk register 54
  • 55.
     Urgency ofthe risk How long before the risk may happen in the project?  Proximity How long before the risk will affect a project objective?  Dormancy How long after the risk has occurred before its impact is noticed?  Manageability How easily can the risk be managed?  Controllability How easily can the outcome of the risk event be controlled?  Detectability How easily can the evidence of a risk’s occurrence be detected?  Connectivity How connected is a risk to other risks within the project?  Strategic impact What size of impact will the risk event have on the organization’s strategic goals?  Propinquity What is the risk perception by key stakeholders? Qualitative risk analysis also takes a cursory look at and documentation of the following: 55
  • 56.
    Dumb Questions Q: Whodoes Perform Qualitative Risk Analysis Q: What if people disagree on how to rank risks? Q: Where do the categories come from? Q: How do I know if I’ve got all the risks? Q: What’s the point in even tracking low-priority risks? Why have a watch list at all? Q: I still don’t get the difference between priority and urgency? Perform qualitative risk analysis 56
  • 57.
    The conditions thatcause a risk are called triggers. You use a watch list to stay on top of them. Perform qualitative risk analysis 57
  • 58.
    Let’s say you’rea fitness trainer, and your specialty is helping millionaires get ready for major endurance trials. You get paid the same for each job, but the catch is that you get paid only if they succeed. Which of these clients would you take on? Qualitative vs. quantitative analysis Running a marathon Climbing Mount KilimanjaroVS. One client wants you to help him train so that he can finish a marathon. He doesn’t have to win, just get to the finish line. Another client wants you to help him get to the top of Mount Kilimanjaro. He won’t be satisfied unless he gets to the summit. 58
  • 59.
    It’s much morelikely that you can get even an out of shape millionaire to finish a marathon than it is that you can get one to climb Mount Kilimanjaro successfully. In fact, since the 1961s, more people have attempted to climb Kilimanjaro, and only few have succeeded, while some have died. Your qualitative analysis probably told you that the climbing project would be the riskier of the two. But having the numbers to back up that judgment is what quantitative analysis is all about 59
  • 60.
    Perform Quantitative RiskAnalysis Once you’ve identified risks and ranked them according to the team’s assessment, you need to take your analysis a little further and make sure that the numbers back you up. Sometimes you’ll find that your initial assessment needs to be updated when you look into it further. Planning process group Enterprise Enviromental Factors Project Management Plan Organizational Process Assests Procurement Documents Inputs . This includes the cost baseline, schedule baseline, and Risk Management plane. This includes nearly all of the documents you’ve created with quantitative data: assumption log, basis of estimates, cost estimates, cost forecasts, duration estimates, milestone list, resource requirements, risk register, risk report, and schedule forecasts 60
  • 61.
    The tools forthis process are all about gathering data and analyzing it to determine probability of risks occurring. First gather the data… Quantitative tools are broken down into three categories: the ones that help you get more data about risks, the ones that help you to analyze the data you have, and expert judgment to help you put it all together. The tools for gathering data focus on gathering numbers about the risks you have already identified and ranked. These tools are called data gathering and representation techniques  Interviewing Sometimes the best way to get hard data about your risks is to interview people who understand them. In a risk interview, you might focus on getting three-point cost estimates so that you can come up with a budget range that will help you mitigate risks later. Another good reason to interview is to establish ranges of probability and impact, and document the reasons for the estimates on both sides of the range  Representations of uncertainty Sometimes taking a look at your time and cost estimate ranges in terms of their distribution will help you generate more data about them.  Expert judgment It’s always a good idea to contact the experts if you have access to them. People who have a good handle on statistics or risk analysis in general can be helpful when you are doing quantitative analysis  Interpersonal and team skills: facilitation You’ll need to be skilled at facilitation to help the team come to its quantitative representations of risk. Working with the team while they model out uncertainty and use it to drive decisions is an important part of this process. 61
  • 62.
    …then analyze it Nowthat you have all the data you can get about your risk register, it’s time to analyze that data. Most of the tools for analyzing risk data are about figuring out how much the risk will end up costing you.  Sensitivity analysis is all about looking at the effect one variable might have if you could completely isolate it. You might look at the cost of a windstorm on human safety, equipment loss, and tent stability without taking into account other issues that might accompany the windstorm (like rain damage or possible debris from nearby campsites). People generally use tornado diagrams to look at a project’s sensitivity to just one risk factor.  Influence diagrams It’s valuable to understand the relationships between entities, outcomes, and influences in your project. Influence diagrams show these relationships graphically.  Decision tree analysis lets you examine costs of all of the paths you might take through the project (depending on which risks occur) and assign a monetary value to each decision. So, if it costs $100 to survey the cliff and $20 to stake your tent, choosing to stake your tent after you’ve looked at the cliff has an expected monetary value of $120. To perform a decision tree analysis, you just diagram out all of the decisions you think you will need to make to deal with risks. Then you add up all that you would need to spend to make each decision 62
  • 63.
    The wind’s blowingat 31 mph SE. I weigh 153 lbs. According to my simulations, I have a 28.3% chance of falling off the cliff in these conditions Quantitative analysis means taking measurements and coming up with exact numbers to describe your risks.  Simulation refers to running your project risks through modeling programs. Monte Carlo analysis is one tool that can randomize the outcomes of your risks and the probabilities of them occurring to help you get a better sense of how to handle the risks you have identified Monte Carlo analysis lets you run a lot of simulations to come up with data about what could happen on your project. 63
  • 64.
    Calculate the expectedmonetary value of your risks OK, so you know the probability and impact of each risk. How does that really help you plan? Well, it turns out that if you have good numbers for those things, you can actually figure out how much those risks are going to cost your project. You can do that by calculating the expected monetary value (or EMV) of each risk Start with the probability and impact of each risk1 Risk Probability Impact High winds 35% Costs $48 to replace equipment Mudslide 5% Losses $750 in demage costs Wind generator is usable 15% Seves $800 in battery costs Truck rental unavailable 10% Costs $350 for last minutes rental You can find this in ypur risk register 64
  • 65.
    2 Take thefirst risk and multiply the probability by the impact. For opportunities, use a positive cost. For threats, use a negative one. Then do the same for the rest of the risks. High winds: 35% x – 48 = – 16.80 Mudslide: 5% x – 750 = – 37.50 Wind generator: 15% x 800 = 120.00 Truck rental: 10% x – 350 = – 35.00 Even though the impact of a mudslide is big, the probability is low so the EMV is small 3 Now that you’ve calculated the EMV for each of the risks, you can add them up to find the total EMV for all of them. EMV = – 16.80 + – 37.50 + 120.00 + – 35.00 = 30.70 If you add $30.70 to the budget, then it should be enough to account for these risks. 65
  • 66.
    You’ll need toknow how to do EMV calculations for the test. Give them a shot now they’re pretty easy once you get the hang of them.Exercise Take a look at this table of risks. Risk Probability Impact Equipment failure 15% Costs $300 due to getting lost Unseasonably warm 8% Save $500 in excavation costs Wind animals 10% Costs $100 for replacements 1. Calculate the EMV for each of these three risks. 2. If these are the only risks on the project, calculate the total EMV. 3. The latest weather report came out, and there is now a 20% chance of unseasonably warm weather. What’s the new EMV for the project? 4. Now the cost of replacement rations goes up to $150. What’s the new EMV for the project? 66
  • 67.
    Decision tree analysisuses EMV to help you make choices There’s another way to do EMV as we mentioned earlier, you can do it visually using a decision tree. This decision tree shows the hidden costs of whether or not you buy a heavier tent. The tent is more expensive it costs $350, while the lighter tent costs $130. But the heavier tent has better protection against the wind, so if there are high winds, your equipment isn’t damaged. Buy havier tent? High Winds -$48 Yes No High Winds -$953 Low Winds -$10 Low winds -$15 -$350 -$130 35% 65% 65% 35% EMV = 35% × –$48 –$16.80 EMV = 65% × –$10 –$6.50 EMV = 35% × –$953 –$333.55 EMV = 65% × –$15 –$9.75 The National Weather Service says there’s a 35% chance of high winds, which means there’s a 65% chance of low winds A decision tree is a method used to determine which of two or more decisions is the best to make. For example, it can be used to determine buy-versus-build scenarios, lease or purchase equations, or whether to use in-house resources rather than outsourcing project work. 67
  • 68.
    Decision tree analysisuses EMV to help you make choices…….  What’s the EMV or how much it’s likely to cost you of choosing the heavier tent? If we add the EMV for high winds plus the EMV for low winds to the cost of the tent, we’ll figure out the “real” cost of choosing the heavier tent. So that’s -$16.80 + -$6.50 + -$350 = -$373.30.  Compare that with the EMV of choosing the lighter tent. Which decision makes sense? We can do the same thing for the bottom two branches of the tree. The “cheaper” tent costs -$130 + -$333.55 + - $9.75 = -$473.30. So it’s actually more expensive! 68
  • 69.
    Dumb Questions Q:: Istill don’t get this Monte Carlo stuff. What’s the deal Q: I can figure out how much the risk costs using EMV, or I can do it with decision tree analysis. Why do I need two ways to do this Q: I understand that EMV and decision trees are related, but I still don’t exactly see how. Q: So are both quantitative analysis and qualitative analysis really just concerned with figuring out the impact of risks? Perform qualitative risk analysis 69
  • 70.
    Outputs Perform quantitative riskanalysis Project Documents update Your risk register should include both threats and opportunities. Opportunities have positive impact values, while threats have negative ones. Don’t forget the plus or minus sign when you’re calculating EMV. Update the risk register based on your quantitative analysis results When you’ve finished gathering data about the risks, you change your priorities, urgency ratings, and categories (if necessary), and you update your risk register. Sometimes modeling out your potential responses to risk helps you to find a more effective way to deal with them. That’s why the only output of the Perform Quantitative Risk Analysis is project documents updates. 70
  • 71.
     The mainoutput of all of the Risk Management planning processes is updated project documents, and the main document that gets updated is the risk register.  The first step in Risk Management is Identify Risks, where you work with the whole team to figure out what risks could affect your project.  Qualitative and quantitative analysis are all about ranking risks based on their probability and impact.  Qualitative analysis is where you take the categories in your risk plan and assign them to each of the risks that you’ve identified. ƒ  Quantitative analysis focuses on gathering numbers to help evaluate risks and making the best decisions about how to handle them.  Decision tree analysis is one kind of expected monetary value analysis. It focuses on adding up all of the costs of decisions being made on a project so that you can see the overall value of risk responses.  To calculate EMV, be sure to treat all negative risks as negative numbers and all opportunities as positive ones. Then add up all of the numbers on your decision tree.  Don’t forget watch lists. They let you monitor lower-priority risks so that you can see if triggers for those risks occur and you need to treat them as higher priorities.  All of the processes in Risk Management are Planning or Monitoring and Controlling processes. There are no Executing processes here. Since the goal is to plan for risks, there is no need to focus on actually doing the work. By then, it’s too late to plan for risks. BULLET POINT: 71
  • 72.
    Once you’ve identifiedrisks and ranked them according to the team’s assessment, you need to take your analysis a little further and make sure that the numbers back you up. Sometimes you’ll find that your initial assessment needs to be updated when you look into it further. Planning process group Enterprise Enviromental Factors Project Management Plan Organizational Process Assests Procurement DocumentsInputs . This includes the Resource Management plan, Risk Management plan, and cost baseline . You’ve updated your risk register as part of all of your analysis so far. It should contain everything you know about the risks facing your project, and even some preliminary responses you might have thought of along the way How do you respond to a risk? However you decide to deal with each individual risk, you’ll update your risk responses in the risk register to show your decisions when you’re done. When you’re done with Plan Risk Responses, you should be able to tell your change control board what your response plans are and who will be in charge of them so they can use them to evaluate changes. 72
  • 73.
    Plan Risk Responsesis figuring out what you’ll do if risks happen 73
  • 74.
    Tools and Technques Planrisk responses  Contingent response strategies Sometimes you need to make contingency plans in case an event occurs in your project. Say you miss an important milestone or a vendor you’re depending on goes out of business. You might put together a plan that would be triggered by that event to keep your project on track  Expert judgment You might need to reach out to somebody who has dealt with a risk you’ve identified before to understand the best way to respond to it.  Data gathering: interviews Interviewing stakeholders to get their opinions on the best way to respond to specific risks is a great way to put together a risk response plan.  Data analysis: alternatives analysis and cost- benefit analysis You know these data analysis techniques already. They can help you figure out the best way to respond to the risks you’ve identified  Interpersonal and team skills: facilitation  Decision making 74
  • 75.
    Tools and Technques Planrisk responses It isn’t always so bad Remember the strategies for handling negative risks avoid, mitigate, transfer, accept, and escalate from earlier? Well, there are strategies for handling positive risks, too. The difference is that strategies for opportunities are all about how you can try to get the most out of them. The strategies for handling negative and positive risks are the tools and techniques for the Plan Risk Responses process.  Exploit This is when you do everything you can to make sure that you take advantage of an opportunity. You could assign your best resources to it. Or you could allocate more than enough funds to be sure that you get the most out of it  Enhance This is when you try to make the opportunity more probable by influencing its triggers. If getting a picture of a rare bird is important, then you might bring more food that it’s attracted to  Share Sometimes it’s harder to take advantage of an opportunity on your own. Then you might call in another company to share in it with you.  Accept Just like accepting a negative risk, sometimes an opportunity just falls in your lap. The best thing to do in that case is to just accept it!  Escalate If you found an opportunity that might help your overall company strategy beyond what your project set out to do, you might escalate that opportunity to people who could take advantage of it. 75
  • 76.
    Exercise Can you figureout which risk response technique is being used in these situations? Match each technique to its scenario. A. Mitigate B. Avoid C. Accept D. Transfer E. Exploit F. Share G. Enhance  If the weather’s good, then there’s a chance you could see a meteor shower. If the team gets a photo that wins the meteor photo contest, you can get extra funding. You have your team stay up all night with their telescopes and cameras ready  You hear that it’s going to rain for the first three days of your trip, so you bring waterproof tents and indoor projects for the team to work on in the meantime.  You read that there’s a major bear problem in the spring on the cliff where you are planning to work. You change your project start date to happen in the fall  On your way up the cliff, you meet another team that is looking to survey the area. You offer to do half of the surveying work while they do the other half and then trade your findings with each other.  There’s a high probability of water damage to some of your equipment, so you buy insurance to avoid losses  There’s always the chance that someone could make a mistake and fall off the cliff. No matter how much you plan for the unexpected, sometimes mistakes happen  About 10 years ago a really rare bird, the black-throated blue warbler, was seen on this cliff. If you could get a picture of it, it would be worth a lot of money. So, you bring special seeds that you have read are really attractive to this bird, and you set up lookout points around the cliff with cameras ready to get the shot. 76
  • 77.
    Add risk responsesto the register Outputs It’s time to add you guessed it more updates to project documents, including the risk register. All of your risk responses will be tracked through change control. Changes that you need to make to the plan will get evaluated based on your risk responses, too. It’s even possible that some of your risk responses will need to be added into your contract Project Management Plan updated Procurement Documents updated Change request The PM plan needs to be updated so that integrated change control can include the risk responses. 77
  • 78.
    Now that you’veplanned responses to risk, you’re ready to put that plan into action. The next process, Implement Risk Responses, is all about what you do when you run into an occurrence of the risks you’ve identified. This is where you actually respond to the risk by doing what’s in your plan Implement Risk Responses Executing process group Enterprise Enviromental Factors Project Management Plan Organizational Process AssestsProcurement DocumentsInputs Lessons you’ve learned from prior projects could affect the way you implement risk responses on this one You’ll need to consult the Risk Management plan to know the best way to implement your risk responses 78
  • 79.
    Tools and Technques Implementrisk responses  Interpersonal and team skills will help you influence the people in your organization to implement the best response to the risks you encounter while your project is executing This is just like expert judgment you’ve seen in other processes.  Project management information system will have all of the schedule and resource information you need to make sure risks don’t sink your project Use all of the information available to your team to make sure that risks are dealt with as they occur 79
  • 80.
    Implement risk responseOutputs ProcurementDocuments updated Change request Think about all of the documents that might need to change as you put your risk responses into action. You might identify new issues that need to be added to the issue log. Or, you could learn something new from a risk that you encounter and need to make an update to the lessons learned register. You could need to change the way your team is assigned in order to respond to a risk that happens. There’s always the possibility that you could need to change the risk register and the risk report themselves as you learn more about the risks you’ve planned for. As you respond to risk, you update your project documents Changes to the plan will always need to go through change control As you implement your risk responses, make sure project documents are updated to include the new information you uncover. 80
  • 81.
    Risk response canfind even more risks Secondary risks come from a response you have to another risk. If you dig a trench to stop landslides from taking out your camp, it’s possible for someone to fall into the trench and get hurt Residual risks remain after your risk responses have been implemented. So even though you reinforce your tent stakes and get weatherproof gear, there’s still a chance that winds could destroy your camp if they are strong enough 81
  • 82.
    You can’t planfor every risk at the start of the project Monitoring & Controlling process group Even the best planning can’t predict everything there’s always a chance that a new risk could crop up that you hadn’t thought about. That’s why you need to constantly monitor how your project is doing compared to your risk register. If a new risk happens, you have a good chance of catching it before it causes serious trouble. When it comes to risk, the earlier you can react, the better for everybody. And that’s what the Monitor Risks process is all about. Risk monitoring is an active process that requires participation from the project manager, the project team, key stakeholders, and, in particular, risk owners within the project. As the project progresses, risk conditions may change and require new responses, additional planning, or the implementation of a contingency plan. Risks must be actively monitored, and new risks must be responded to as they are discovered. Risk monitoring is the process of monitoring identified risks for signs that they may be occurring, addressing identified risks with the agreed-upon responses, looking for new risks that may creep into the project, and then following the outcomes of the risk responses to track their effectiveness. Risk monitoring also is concerned with the documentation of the success or failure of risk response plans and keeping records of metrics that signal risks are occurring, fading, or disappearing from the project. 82
  • 83.
    There are severalgoals to risk monitoring:  To determine whether the project contingency reserves (cost and schedule) are adequate  To confirm that risk responses are implemented as planned  To determine whether risk responses are effective or whether new responses are needed  To determine the validity of the project assumptions  To determine whether risk exposure has changed, evolved, or declined due to trends in the project progression  To monitor risk triggers  To confirm that policies and procedures happen as planned  To monitor the project for new risks  To confirm the continued validity of the risk management approach 83
  • 84.
    Monitor Risks isanother change control process Risk responses are treated just like changes. You monitor the project in every status meeting to see how the risks in the risk register are affecting it. If you need to implement a risk response, you take it to your change control board, because it amounts to a change that will affect your project constraints. Work Performance Report Project Management Plan Work performace data Inputs Project Documents 84
  • 85.
    Risk monitoring should bedone at every status meeting 85
  • 86.
    Work performance dataand work performance reports The results of project work can inform the project manager and the project team of new and pending risks. In addition, project team members may create reports to monitor or document risks. Project performance focuses on the balance of the project schedule, costs, and scope. Should the performance of time, cost, or scope suffer, new risks are likely to enter the project The risk management plan Defines the organization’s approach to risk management. It is not the strategy for specific risks within a project, but the overall strategy for risk analysis and planning. Project documents The central repository for all project risk information, the risk register, is the primary document you’ll need. The risk register includes the identified risks, the potential responses, the root causes of risks, and any identified categories of risk. You may also reference the lessons learned register, the issue log, and the risk report. Inputs 86
  • 87.
    Tools and Technques Monitorrisk  Technical performance analysis Comparing the actual project performance to the plan is a great way to tell if a risk might be happening. If you find that you’re significantly over budget or behind schedule, a risk could have cropped up that you didn’t take into account.  Reserve analysis Just like you keep running tabs on your budget, you should always know how much money you have set aside for risk response. As you spend it, be sure to subtract it so you know if you have enough to cover all of your remaining risks. If you start to see that your reserves are running low and there are still a lot of risks being identified, you might be in trouble. Here are the data analysis techniques you’ll need to use when you monitor your risks Analyze the data you gather in project status meetings to determine how your project is managing risk. 87
  • 88.
    Tools and Technques Monitorrisk There are just a few more tools in the Monitor Risks process. They’re all focused on finding new risks if they crop up, dealing with changes to the risks you’ve already planned for, and responding quickly to risks you know how to handle.  Audits are when you have an outside party come in and take a look at your risk response strategies to judge how effective they are. Sometimes risk audits will point out better ways of handling a specific risk so that you can change your response strategy going forward  Meetings are the most important way to keep the team up to date on risk planning so important that they should happen throughout the entire project. The more you talk about risks with the team, the better. Every single status meeting should have risk review on the agenda. Status meetings are a really important way of noticing when things might go wrong, and of making sure that you implement your response strategy in time. 88
  • 89.
    Exercise Here are somerisk monitoring and control activities. Can you determine which of the tools is being used in each one? 1. At every milestone, you do a new round of Identify Risks and make sure that the risks in your risk register still apply to the project 2. You check to make sure that you have all of the features developed in your project that you had planned when you reach the “feature complete” milestone. When you find that you are missing one of the planned features, you realize that a new risk has shown up you missed one of the required features in your functional specification 3. You take a look at the number of defects you have found in your project per phase and find that it is higher in your project than it has been in most other projects that the company is doing. You dig a little deeper and find some previously unplanned risks that have been causing trouble on your project 4. Your company sends a risk expert in to take a look at your risk response strategies. She finds that you are missing a few secondary risks that might be caused by the responses you have planned. So you update your risk register to include the secondary risks. 5. You decide to implement a risk response that costs $4,000. You check to make sure that you have enough money to cover the rest of the risks that might happen from here on out in the project. 89
  • 90.
    Dumb Questions Q:: Whydo I need to ask about risks at every status meeting Q: I still don’t get technical performance analysis. How does it help me find risks? Q: Why do we do risk audits? Q: Hold on, didn’t we already talk about reserves way back in the Cost Management chapter? Why is it coming up here? Monitor Risk Q: Shouldn’t I ask the sponsor about risks to the project Q:Hey, didn’t you talk about risks back in the Project Schedule Management chapter too 90
  • 91.
    The better youprepare for risks, the more secure your project is against the unknown. 91
  • 92.
    Risk monitoring helpsthe project become more successful. It measures the planned responses to risks and creates reactions to unplanned risks. The outputs of risk monitoring also aim to help the project reach its objectives. The process has several outputs Examining The Results Of Risk Monitoring Outputs  Change requests Risk monitoring may cause the project’s cost or schedule baseline to need to be updated. The update of a baseline will need a change request that follows the integrated change control process. Project management plan updates could also be an output of this process, and these updates will also require a change request. Corrective actions are taken to bring the project back into compliance with the project plan. Preventive actions are taken to bring the project back into alignment with the project management plan.  Work performance information What happens in the project because of monitoring risks and risk responses will create work performance information. This information affects what needs to be communicated and what actions the project manager and team may take next, and it helps with project decisions.  Project document updates As the project moves along and the project manager and the project team complete the risk assessments, audits, and risk reviews, they’ll need to record their findings in the risk register, risk report, or both.  Organizational process assets updates The risks from the current project can help other project managers in the future. Therefore, the project manager must work to ensure that the current risks, their anticipated impact, and their actual impact are recorded 92
  • 93.
    Risk monitoring and controllingis exactly like the other change control processes. 93
  • 94.
    KEY TERMS For maximumvalue, create your own flashcards based on these definitions and review them daily. You can find additional information on these terms in the project glossary  acceptance A response to a risk event, generally made when the probability of the event and/or its impact is small. No proactive action is taken on the risk. It is used when escalation, mitigation, transference, and avoidance are not selected.  ambiguity risks These risks are impossible to predict accurately: certainty of a new technical solution, future laws or regulations, or even complexity in the project approach.  avoidance One response to a risk event. The risk is avoided by removing the risk from the project.  brainstorming The most common approach to risk identification; it is performed by a project team to identify the risks within the project. A multidisciplinary team, hostedby a project facilitator, can also perform brainstorming.  bubble chart A hierarchical chart that uses three parameters for mapping the axes of the risks and the magnitude of the third parameter. The larger the bubble the more significant parameter.  cause-and-effect diagrams Used for root-cause analysis of what factors are creating the risks within the project. The goal is to identify and treat the root of the problem, not the symptom 94
  • 95.
    KEY TERMS For maximumvalue, create your own flashcards based on these definitions and review them daily. You can find additional information on these terms in the project glossary  commercial risks When working with vendors, new risks are introduced to the project specific to the contractual relationship. Risk categories can include the contract terms, internal procurement procedures, suppliers, subcontracts, client and customer stability, and any partnerships or joint ventures.  contingency reserve A time or dollar amount allotted as a response to risk events that may occur within a project.  decision tree analysis A type of analysis that determines which of two decisions is the best. The decision tree assists in calculating the value of the decision and determining which decision costs the least.  Delphi Technique A method to survey experts anonymously on foreseeable risks within the project, phase, or component of the project. The results of the survey are analyzed and organized, and then circulated to the experts. There can be several rounds of anonymous discussions when using the Delphi Technique. The goal is to gain consensus on project risks, and the anonymous nature of the process ensures that no one expert’s advice overtly influences the opinions of other participants.  enhance To enhance a risk is to attempt to modify its probability and/or its impacts to realize the most gains from it. Enhance applies only to positive risks (opportunities). 95
  • 96.
    KEY TERMS For maximumvalue, create your own flashcards based on these definitions and review them daily. You can find additional information on these terms in the project glossary  escalate risk response Some risks that are outside of the boundary of the project should be escalated when the project team, project sponsor, or project manager believes the risk management would exceed the authority the project manager has over the risk event.  exploit The organization wants to ensure that the identified risk does happen to realize the positive impact associated with the risk event.  individual project risks An individual risk that hinders or helps realize the project objectives.  influence diagram A diagram that charts out a decision problem. It identifies all of the elements, variables, decisions, and objectives—and how each factor may influence another.  mitigation A process of reducing the probability or impact of a risk.  overall project risk A combination of all risk events that will reveal the project’s risk exposure and determine just how risky the project is for the organization.  PESTLE Analysis of overall project risks by determining political, economic, social, technological, legal, and environmental uncertainty 96
  • 97.
     qualitative riskanalysis An examination and prioritization of the risks based on their probability of occurring and the impact on the project if they do occur. Qualitative risk analysis guides the risk reaction process.  quantitative risk analysis A numerical assessment of the probability and impact of the identified risks. Quantitative risk analysis also creates an overall risk score for the project.  residual risks Risks that are left over after mitigation, transference, and avoidance. These are generally accepted risks. Management may elect to add contingency costs and time to account for the residual risks within the project.  risk An uncertain event that can have a positive or negative influence on the project’s success.  risk categories These help organize, rank, and identify risks within the project.  risk management plan A subsidiary project management plan for determining how risks will be identified, how quantitative and qualitative analyses will be completed, how risk response planning will happen, how risks will be monitored, and how ongoing risk management activities will occur throughout the project life cycle. KEY TERMS For maximum value, create your own flashcards based on these definitions and review them daily. You can find additional information on these terms in the project glossary 97
  • 98.
    KEY TERMS  riskowners The individuals or groups responsible for a risk response.  risk register Documentation of all risk events and their conditions, impact, probability, and overall risk score.  risk report A document that explains the overall project risks and provides a summary about the individual project risks. You’ll update the risk report through the project as more information becomes available through analysis and experience in the project.  scales of probability and impact Used in a risk matrix in both qualitative risk analysis and quantitative risk analysis to score each risk’s probability and impact.  secondary risks Risks that stem from risk responses. For example, the response of transference may call for hiring a third party to manage an identified risk. A secondary risk caused by the solution is the failure of the third party to complete its assignment as scheduled. Secondary risks must be identified, analyzed, and planned for, just like any other identified risk.  sensitivity analysis Examines each project’s risk on its own merit to assess the impact on the project. All other risks in the project are set at a baseline value. For maximum value, create your own flashcards based on these definitions and review them daily. You can find additional information on these terms in the project glossary 98
  • 99.
     share Sharingis nice. When sharing, the risk ownership is transferred to the organization that can most capitalize on the risk opportunity.  simulation Allows the project team to do “what-if” analysis without affecting any areas of production. KEY TERMS For maximum value, create your own flashcards based on these definitions and review them daily. You can find additional information on these terms in the project glossary  system or process flowcharts Show the relationship between components and how the overall process works. They are useful for identifying risks between system components.  TECOP Analysis of overall project risks by determining technical, environmental, commercial, operational, and political uncertainty.  transference A response to risks in which the responsibility and ownership of the risk are transferred to another party (for example, through insurance).  triggers Warning signs or symptoms that a risk has occurred or is about to occur (for example, a vendor failing to complete their portion of the project as scheduled). 99
  • 100.
     utility functionA person’s willingness to accept risk. The higher the utility function, the more likely the person or organization is willing to accept risk.  variability risks Uncertainty surrounding a project activity or decision. Fluctuations in productivity, number or errors and defects, or even the weather affecting the project are all examples of variability risks.  VUCA Analysis of overall project risks by determining volatility, uncertainty, complexity, and ambiguity.  workarounds Unplanned responses to risks that were not identified or expected. KEY TERMS For maximum value, create your own flashcards based on these definitions and review them daily. You can find additional information on these terms in the project glossary 100
  • 101.