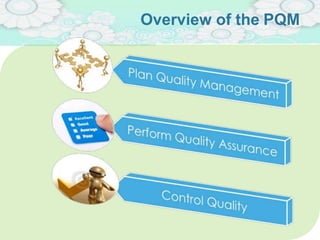
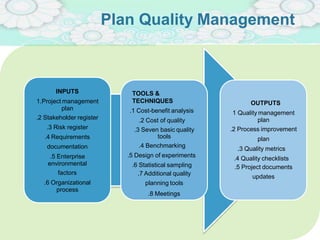
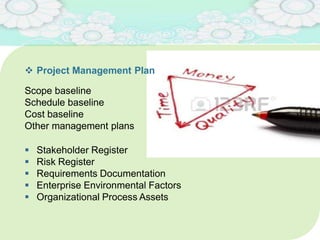
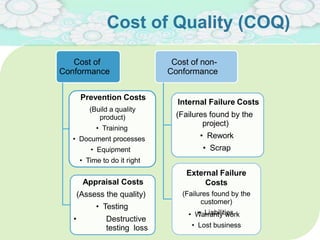
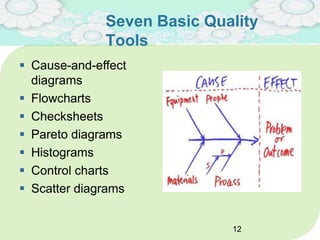
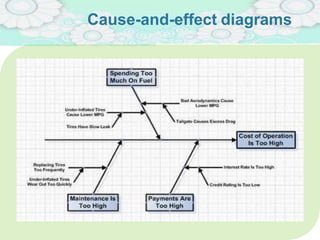
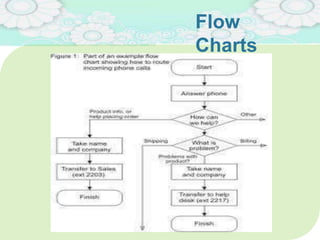
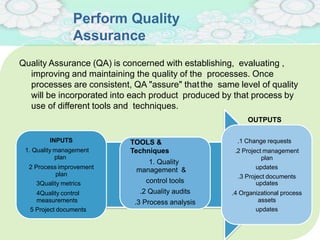
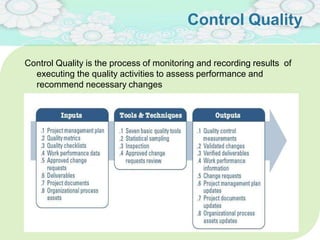
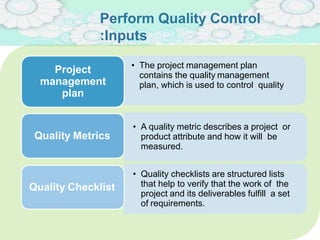
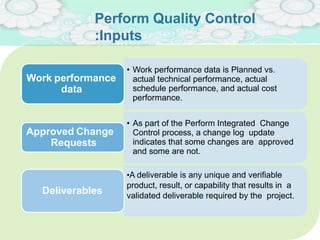
Project Quality
Management
Introduction
Quality management ensures that an organization, product or service is
consistent. Quality management is focused not only on product and
service quality, but also on the means to achieve it. Quality
management, therefore, uses quality assurance and control of processes
as well as products to achieve more consistent quality.
Project Quality Management
Project Quality Management includes the
processes and activities of the performing
organization that determines quality policies,
objectives, and responsibilities so that the
project will satisfy the needs for which it was
undertaken
3
Overview of the PQM
Plan Quality Management
Process of identifying quality requirements
and standards for the project and its
deliverables and documenting how the
project will demonstrate compliance with
quality requirements.
Plan Quality Management
INPUTS
1.Project management
plan
.2 Stakeholder register
.3 Risk register
.4 Requirements
documentation
.5 Enterprise
environmental
factors
.6 Organizational
process
TOOLS &
TECHNIQUES
.1 Cost-benefit analysis
.2 Cost of quality
.3 Seven basic quality
tools
.4 Benchmarking
.5 Design of experiments
.6 Statistical sampling
.7 Additional quality
planning tools
.8 Meetings
OUTPUTS
1 Quality management
plan
.2 Process improvement
plan
.3 Quality metrics
.4 Quality checklists
.5 Project documents
updates
Plan Quality
Management: Inputs
7
 Project Management Plan
Scope baseline
Schedule baseline
Cost baseline
Other management plans
 Stakeholder Register
 Risk Register
 Requirements Documentation
 Enterprise Environmental Factors
 Organizational Process Assets
Plan Quality Management:
Tools and Techniques
Cost-Benefit
Analysis10
A cost-benefit analysis for each quality activity
compares the cost of the quality step to the
expected benefit.
Cost of Quality (COQ)
11
Cost of
Conformance
Prevention Costs
(Build a quality
product)
• Training
• Document processes
• Equipment
• Time to do it right
Appraisal Costs
(Assess the quality)
• Testing
• Destructive
testing loss
Cost of non-
Conformance
Internal Failure Costs
(Failures found by the
project)
• Rework
• Scrap
External Failure
Costs
(Failures found by the
customer)
• Liabilities• Warranty work
• Lost business
Seven Basic Quality
Tools
 Cause-and-effect
diagrams
 Flowcharts
 Checksheets
 Pareto diagrams
 Histograms
 Control charts
 Scatter diagrams
12
Cause-and-effect diagrams
13
Flow
Charts14
Checksheets
15
Pareto Diagrams
16
Histogram
s17
Control
Charts18
Scatter Diagrams
19
Plan Quality Management: Tools and
Techniques
 Benchmarking
 Design of Experiments
 Statistical Sampling
 Additional Quality Planning Tools
 Brainstorming
 Force field analysis
 Nominal group technique
 Quality management and control tools
 Meetings
20
Plan Quality Management:
Outputs
21
Quality Management Plan :Outputs
 Quality Management Plan
 The quality management plan is a component of the project
management plan that describes how the organization’s quality
policies will be implemented.
 Process Improvement Plan
 Process boundaries.
 Process configuration.
 Process metrics..
 Targets for improved performance.
22
Quality Management Plan :
Outputs
Quality Metrics
 A quality metric specifically describes a project or
product attribute and how the control quality process
will measure it.
Quality Checklists
 A checklist is a structured tool, usually component-
specific, used to verify that a set of required steps has
been performed
Project Documents Updates
 Stakeholder register
 Responsibility assignment matrix
 WBS and WBS Dictionary.
Perform
Quality
Assurance
Perform Quality
Assurance
INPUTS
1. Quality management
plan
2 Process improvement
plan
3Quality metrics
4Quality control
measurements
5 Project documents
TOOLS &
Techniques
1. Quality
management &
control tools
.2 Quality audits
.3 Process analysis
Quality Assurance (QA) is concerned with establishing, evaluating ,
improving and maintaining the quality of the processes. Once
processes are consistent, QA "assure" thatthe same level of quality
will be incorporated into each product produced by that process by
use of different tools and techniques.
OUTPUTS
.1 Change requests
.2 Project management
plan
updates
.3 Project documents
updates
.4 Organizational process
assets
updates
1. Quality Management and Control Tools
1. Affinity Diagrams
2. Process decision
program charts
(PDPC)
3. Interrelationship digraphs
4. Tree diagrams
5. Prioritization matrices
6. Activity network diagrams
7. Matrix diagrams
I. Steps to Create Affinity Diagrams
STEP 1
Write each idea
on a separate
index card
STEP 2
Randomly place
each index cardon
flat surface. Wall
board or flipchart
In silence, team
members move the
cards into
meaningful groups
until the group
stops moving the
cards.
STEP 4
As a team,
discuss and then
label each
category with a
title
STEP 5
As a team, discuss
Each category,
Using cause-and
Effect diagrams, if
needed.
It is an orderly extension of a structured brainstorming session to generate
ideas
STEP 3
II. Steps to Create
PDPC
• Develop a tree diagram of the proposed plan
• For each task on the third level, brainstorm what could go wrong
• Review all the potential problems and eliminate any that are insignificant
1
2
3
4
• For each potential problem, brainstorm possible countermeasures
5
• Decide how practical each countermeasure is. Use criteria such as cost, time
required, ease of implementation and effectiveness. Mark impractical
countermeasures with an X and practical ones with an O.
systematically identifies what might go wrong in a plan under development. By
using PDPC, you can either revise the plan to avoid the problems or be ready with
the best response when a problem occurs.
III. How to Construct an Interrelationship Digraph
1. Create a
Problem
Statement
2. Brainstorm
Ideas
3. Determine
Relationships
Between
Ideas
4. Analyze
the Diagram
Show cause-and-effect relationships, and help analyze the natural links
between different aspects of a complex situation
IV. Tree diagrams and Prioritization Matrices
It is used to figure out all the various tasks that must be undertaken to achieve a
given objective
Delay of Bridge
Construction
Unavailability of
Construction
Material
Scarcity of raw
materials
Shortage of funds
Unfavorable
weather
conditions
Equipment
Problems
Equipment
Damage
Unavailabity of
equipment
1 2 3 4
Prioritization Matrix
1. Quality Management & Control Tools
VI.Activity network diagrams –used with
project scheduling methodologies
 Activity on arrow
 Activity on node
 Can be used for review technique
(PERT), critical path method (CPM) &
precedence diagramming method
(PDM).
VII.Matrix diagrams –used to perform data
analysis within the organizational structure
 show the strength of relationships between
factors, causes, and objectives that exist
between the rows and columns of matrix
Perform Quality Assurance: Tools
&
Techniques
2. Quality Audits
 Structured, independent process to determine if project
activities comply with organizational and project policies,
processes, and procedures.
 can confirm the implementation of approved change requests
including updates, corrective actions, defect repairs, and preventive
actions.
3. Process Analysis
 follows the steps outlined in the process improvement plan to
identify needed improvements.
 examines problems experienced, constraints experienced, and non-
value-added activities identified during process operation.
Perform Quality Assurance:
Outputs
 Change Requests
 used as input into the Perform Integrated Change Control process
 used to take
 corrective action,
 preventive action,
 to perform defect repair
 Project Management Plan Updates
 Quality management plan
 Scope management plan
 Schedule management plan
 Cost management plan
 Project Documents Updates
 Quality audit reports,
 Training plans
 Process documentation.
 Organizational Process Assets Updates
Perform
Quality
Control
Control Quality
Control Quality is the process of monitoring and recording results of
executing the quality activities to assess performance and
recommend necessary changes
Perform Quality Control
:Inputs
• The project management plan
contains the quality management
plan, which is used to control quality
Project
management
plan
• A quality metric describes a project or
product attribute and how it will be
measured.
Quality Metrics
• Quality checklists are structured lists
that help to verify that the work of the
project and its deliverables fulfill a set
of requirements.
Quality Checklist
Perform Quality Control
:Inputs
• Work performance data is Planned vs.
actual technical performance, actual
schedule performance, and actual cost
performance.
Work performance
data
• As part of the Perform Integrated Change
Control process, a change log update
indicates that some changes are approved
and some are not.
Approved Change
Requests
•A deliverable is any unique and verifiable
product, result, or capability that results in a
validated deliverable required by the project.
Deliverables
Perform Quality Control
:Inputs
• Project documents may include
Agreements, Quality audit reports and
change logs , Training plans and
assessments and Process
documentation .
Project
Documents
• The organizational process assets
includes the organization’s quality
standards and policies, guidelines,
reporting procedures and
communication policies.
Organizational
Process
Assets
Perform Quality Control:
T&T
Seven Basic Quality Tools
The seven basic quality tools are illustratedearlier.
Statistical Sampling
Samples are selected and tested as defined in
the quality management plan.
Inspection
An inspection is the examination of awork
product to determine if it conforms to
documented standards.
Approved Change Requests Review
All approved change requests should be reviewed to
verify that they were implemented as approved.
Perform Quality Control
:Outputs
Quality Control Measurements
Quality control measurements are the documented results of
control quality activities.
Verified Deliverables
A goal of the Control Quality process is to determine the
correctness of deliverables.
Work Performance Information
Work performance information is the performance data
collected
Validated Changes
Any changed or repaired items are inspected and will be either
accepted or rejected before notification of the decision is provided.
Perform Quality Control
:Outputs
Change Requests
If the recommended corrective or preventive actions or a defect
repair requires a change to the project management plan, a
change request should be initiated.
Project Management Plan Updates
Elements of the project management plan that may be
updated include Quality management plan , and Process
improvement plan
Project Documents Updates
Project documents is being updated
Organizational Process Assets Updates
Elements of the organizational process assets that may be
updated include Completed checklists and Lessons learned
documentation
References
 http://asq.org/learn-about-quality/new-management-
planning-tools/overview/process-decision-program-
chart.html
 http://www.health.state.mn.us/divs/opi/qi/toolbox/interrelatio
nshipdigraph.html
 http://asq.org/learn-about-quality/new-management-
planning-tools/overview/tree-diagram.html

Product quality management

  • 1.
  • 2.
    Introduction Quality management ensuresthat an organization, product or service is consistent. Quality management is focused not only on product and service quality, but also on the means to achieve it. Quality management, therefore, uses quality assurance and control of processes as well as products to achieve more consistent quality.
  • 3.
    Project Quality Management ProjectQuality Management includes the processes and activities of the performing organization that determines quality policies, objectives, and responsibilities so that the project will satisfy the needs for which it was undertaken 3
  • 4.
  • 5.
    Plan Quality Management Processof identifying quality requirements and standards for the project and its deliverables and documenting how the project will demonstrate compliance with quality requirements.
  • 6.
    Plan Quality Management INPUTS 1.Projectmanagement plan .2 Stakeholder register .3 Risk register .4 Requirements documentation .5 Enterprise environmental factors .6 Organizational process TOOLS & TECHNIQUES .1 Cost-benefit analysis .2 Cost of quality .3 Seven basic quality tools .4 Benchmarking .5 Design of experiments .6 Statistical sampling .7 Additional quality planning tools .8 Meetings OUTPUTS 1 Quality management plan .2 Process improvement plan .3 Quality metrics .4 Quality checklists .5 Project documents updates
  • 7.
  • 8.
     Project ManagementPlan Scope baseline Schedule baseline Cost baseline Other management plans  Stakeholder Register  Risk Register  Requirements Documentation  Enterprise Environmental Factors  Organizational Process Assets
  • 9.
  • 10.
    Cost-Benefit Analysis10 A cost-benefit analysisfor each quality activity compares the cost of the quality step to the expected benefit.
  • 11.
    Cost of Quality(COQ) 11 Cost of Conformance Prevention Costs (Build a quality product) • Training • Document processes • Equipment • Time to do it right Appraisal Costs (Assess the quality) • Testing • Destructive testing loss Cost of non- Conformance Internal Failure Costs (Failures found by the project) • Rework • Scrap External Failure Costs (Failures found by the customer) • Liabilities• Warranty work • Lost business
  • 12.
    Seven Basic Quality Tools Cause-and-effect diagrams  Flowcharts  Checksheets  Pareto diagrams  Histograms  Control charts  Scatter diagrams 12
  • 13.
  • 14.
  • 15.
  • 16.
  • 17.
  • 18.
  • 19.
  • 20.
    Plan Quality Management:Tools and Techniques  Benchmarking  Design of Experiments  Statistical Sampling  Additional Quality Planning Tools  Brainstorming  Force field analysis  Nominal group technique  Quality management and control tools  Meetings 20
  • 21.
  • 22.
    Quality Management Plan:Outputs  Quality Management Plan  The quality management plan is a component of the project management plan that describes how the organization’s quality policies will be implemented.  Process Improvement Plan  Process boundaries.  Process configuration.  Process metrics..  Targets for improved performance. 22
  • 23.
    Quality Management Plan: Outputs Quality Metrics  A quality metric specifically describes a project or product attribute and how the control quality process will measure it. Quality Checklists  A checklist is a structured tool, usually component- specific, used to verify that a set of required steps has been performed Project Documents Updates  Stakeholder register  Responsibility assignment matrix  WBS and WBS Dictionary.
  • 24.
  • 25.
    Perform Quality Assurance INPUTS 1. Qualitymanagement plan 2 Process improvement plan 3Quality metrics 4Quality control measurements 5 Project documents TOOLS & Techniques 1. Quality management & control tools .2 Quality audits .3 Process analysis Quality Assurance (QA) is concerned with establishing, evaluating , improving and maintaining the quality of the processes. Once processes are consistent, QA "assure" thatthe same level of quality will be incorporated into each product produced by that process by use of different tools and techniques. OUTPUTS .1 Change requests .2 Project management plan updates .3 Project documents updates .4 Organizational process assets updates
  • 26.
    1. Quality Managementand Control Tools 1. Affinity Diagrams 2. Process decision program charts (PDPC) 3. Interrelationship digraphs 4. Tree diagrams 5. Prioritization matrices 6. Activity network diagrams 7. Matrix diagrams
  • 27.
    I. Steps toCreate Affinity Diagrams STEP 1 Write each idea on a separate index card STEP 2 Randomly place each index cardon flat surface. Wall board or flipchart In silence, team members move the cards into meaningful groups until the group stops moving the cards. STEP 4 As a team, discuss and then label each category with a title STEP 5 As a team, discuss Each category, Using cause-and Effect diagrams, if needed. It is an orderly extension of a structured brainstorming session to generate ideas STEP 3
  • 28.
    II. Steps toCreate PDPC • Develop a tree diagram of the proposed plan • For each task on the third level, brainstorm what could go wrong • Review all the potential problems and eliminate any that are insignificant 1 2 3 4 • For each potential problem, brainstorm possible countermeasures 5 • Decide how practical each countermeasure is. Use criteria such as cost, time required, ease of implementation and effectiveness. Mark impractical countermeasures with an X and practical ones with an O. systematically identifies what might go wrong in a plan under development. By using PDPC, you can either revise the plan to avoid the problems or be ready with the best response when a problem occurs.
  • 29.
    III. How toConstruct an Interrelationship Digraph 1. Create a Problem Statement 2. Brainstorm Ideas 3. Determine Relationships Between Ideas 4. Analyze the Diagram Show cause-and-effect relationships, and help analyze the natural links between different aspects of a complex situation
  • 30.
    IV. Tree diagramsand Prioritization Matrices It is used to figure out all the various tasks that must be undertaken to achieve a given objective Delay of Bridge Construction Unavailability of Construction Material Scarcity of raw materials Shortage of funds Unfavorable weather conditions Equipment Problems Equipment Damage Unavailabity of equipment 1 2 3 4 Prioritization Matrix
  • 31.
    1. Quality Management& Control Tools VI.Activity network diagrams –used with project scheduling methodologies  Activity on arrow  Activity on node  Can be used for review technique (PERT), critical path method (CPM) & precedence diagramming method (PDM). VII.Matrix diagrams –used to perform data analysis within the organizational structure  show the strength of relationships between factors, causes, and objectives that exist between the rows and columns of matrix
  • 32.
    Perform Quality Assurance:Tools & Techniques 2. Quality Audits  Structured, independent process to determine if project activities comply with organizational and project policies, processes, and procedures.  can confirm the implementation of approved change requests including updates, corrective actions, defect repairs, and preventive actions. 3. Process Analysis  follows the steps outlined in the process improvement plan to identify needed improvements.  examines problems experienced, constraints experienced, and non- value-added activities identified during process operation.
  • 33.
    Perform Quality Assurance: Outputs Change Requests  used as input into the Perform Integrated Change Control process  used to take  corrective action,  preventive action,  to perform defect repair  Project Management Plan Updates  Quality management plan  Scope management plan  Schedule management plan  Cost management plan  Project Documents Updates  Quality audit reports,  Training plans  Process documentation.  Organizational Process Assets Updates
  • 34.
  • 35.
    Control Quality Control Qualityis the process of monitoring and recording results of executing the quality activities to assess performance and recommend necessary changes
  • 36.
    Perform Quality Control :Inputs •The project management plan contains the quality management plan, which is used to control quality Project management plan • A quality metric describes a project or product attribute and how it will be measured. Quality Metrics • Quality checklists are structured lists that help to verify that the work of the project and its deliverables fulfill a set of requirements. Quality Checklist
  • 37.
    Perform Quality Control :Inputs •Work performance data is Planned vs. actual technical performance, actual schedule performance, and actual cost performance. Work performance data • As part of the Perform Integrated Change Control process, a change log update indicates that some changes are approved and some are not. Approved Change Requests •A deliverable is any unique and verifiable product, result, or capability that results in a validated deliverable required by the project. Deliverables
  • 38.
    Perform Quality Control :Inputs •Project documents may include Agreements, Quality audit reports and change logs , Training plans and assessments and Process documentation . Project Documents • The organizational process assets includes the organization’s quality standards and policies, guidelines, reporting procedures and communication policies. Organizational Process Assets
  • 39.
    Perform Quality Control: T&T SevenBasic Quality Tools The seven basic quality tools are illustratedearlier. Statistical Sampling Samples are selected and tested as defined in the quality management plan. Inspection An inspection is the examination of awork product to determine if it conforms to documented standards. Approved Change Requests Review All approved change requests should be reviewed to verify that they were implemented as approved.
  • 40.
    Perform Quality Control :Outputs QualityControl Measurements Quality control measurements are the documented results of control quality activities. Verified Deliverables A goal of the Control Quality process is to determine the correctness of deliverables. Work Performance Information Work performance information is the performance data collected Validated Changes Any changed or repaired items are inspected and will be either accepted or rejected before notification of the decision is provided.
  • 41.
    Perform Quality Control :Outputs ChangeRequests If the recommended corrective or preventive actions or a defect repair requires a change to the project management plan, a change request should be initiated. Project Management Plan Updates Elements of the project management plan that may be updated include Quality management plan , and Process improvement plan Project Documents Updates Project documents is being updated Organizational Process Assets Updates Elements of the organizational process assets that may be updated include Completed checklists and Lessons learned documentation
  • 42.