Download as PDF, PPTX


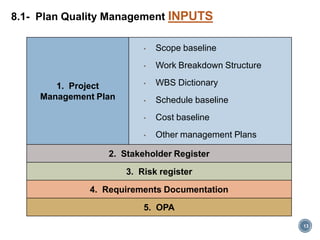


The document discusses project quality management. It covers quality theories, the evolution of quality management, and the three key quality management processes - plan quality management, perform quality assurance, and control quality. Plan quality management involves identifying quality requirements and documenting how the project will demonstrate compliance. Perform quality assurance involves auditing quality requirements and results to ensure appropriate standards. Control quality involves monitoring and recording quality activities to assess performance and recommend changes.


