The document discusses project scheduling and time management. It covers topics like work breakdown structure (WBS), critical path method (CPM), resource histograms, resource leveling, program evaluation and review technique (PERT), and using project management software. The objectives of project scheduling are outlined as finishing on time, within budget, continuous workflow, minimized rework, increased status visibility, optimized resource use, and defined responsibilities. Techniques discussed include bar charts, network analysis methods like CPM and PERT, and project management software applications.
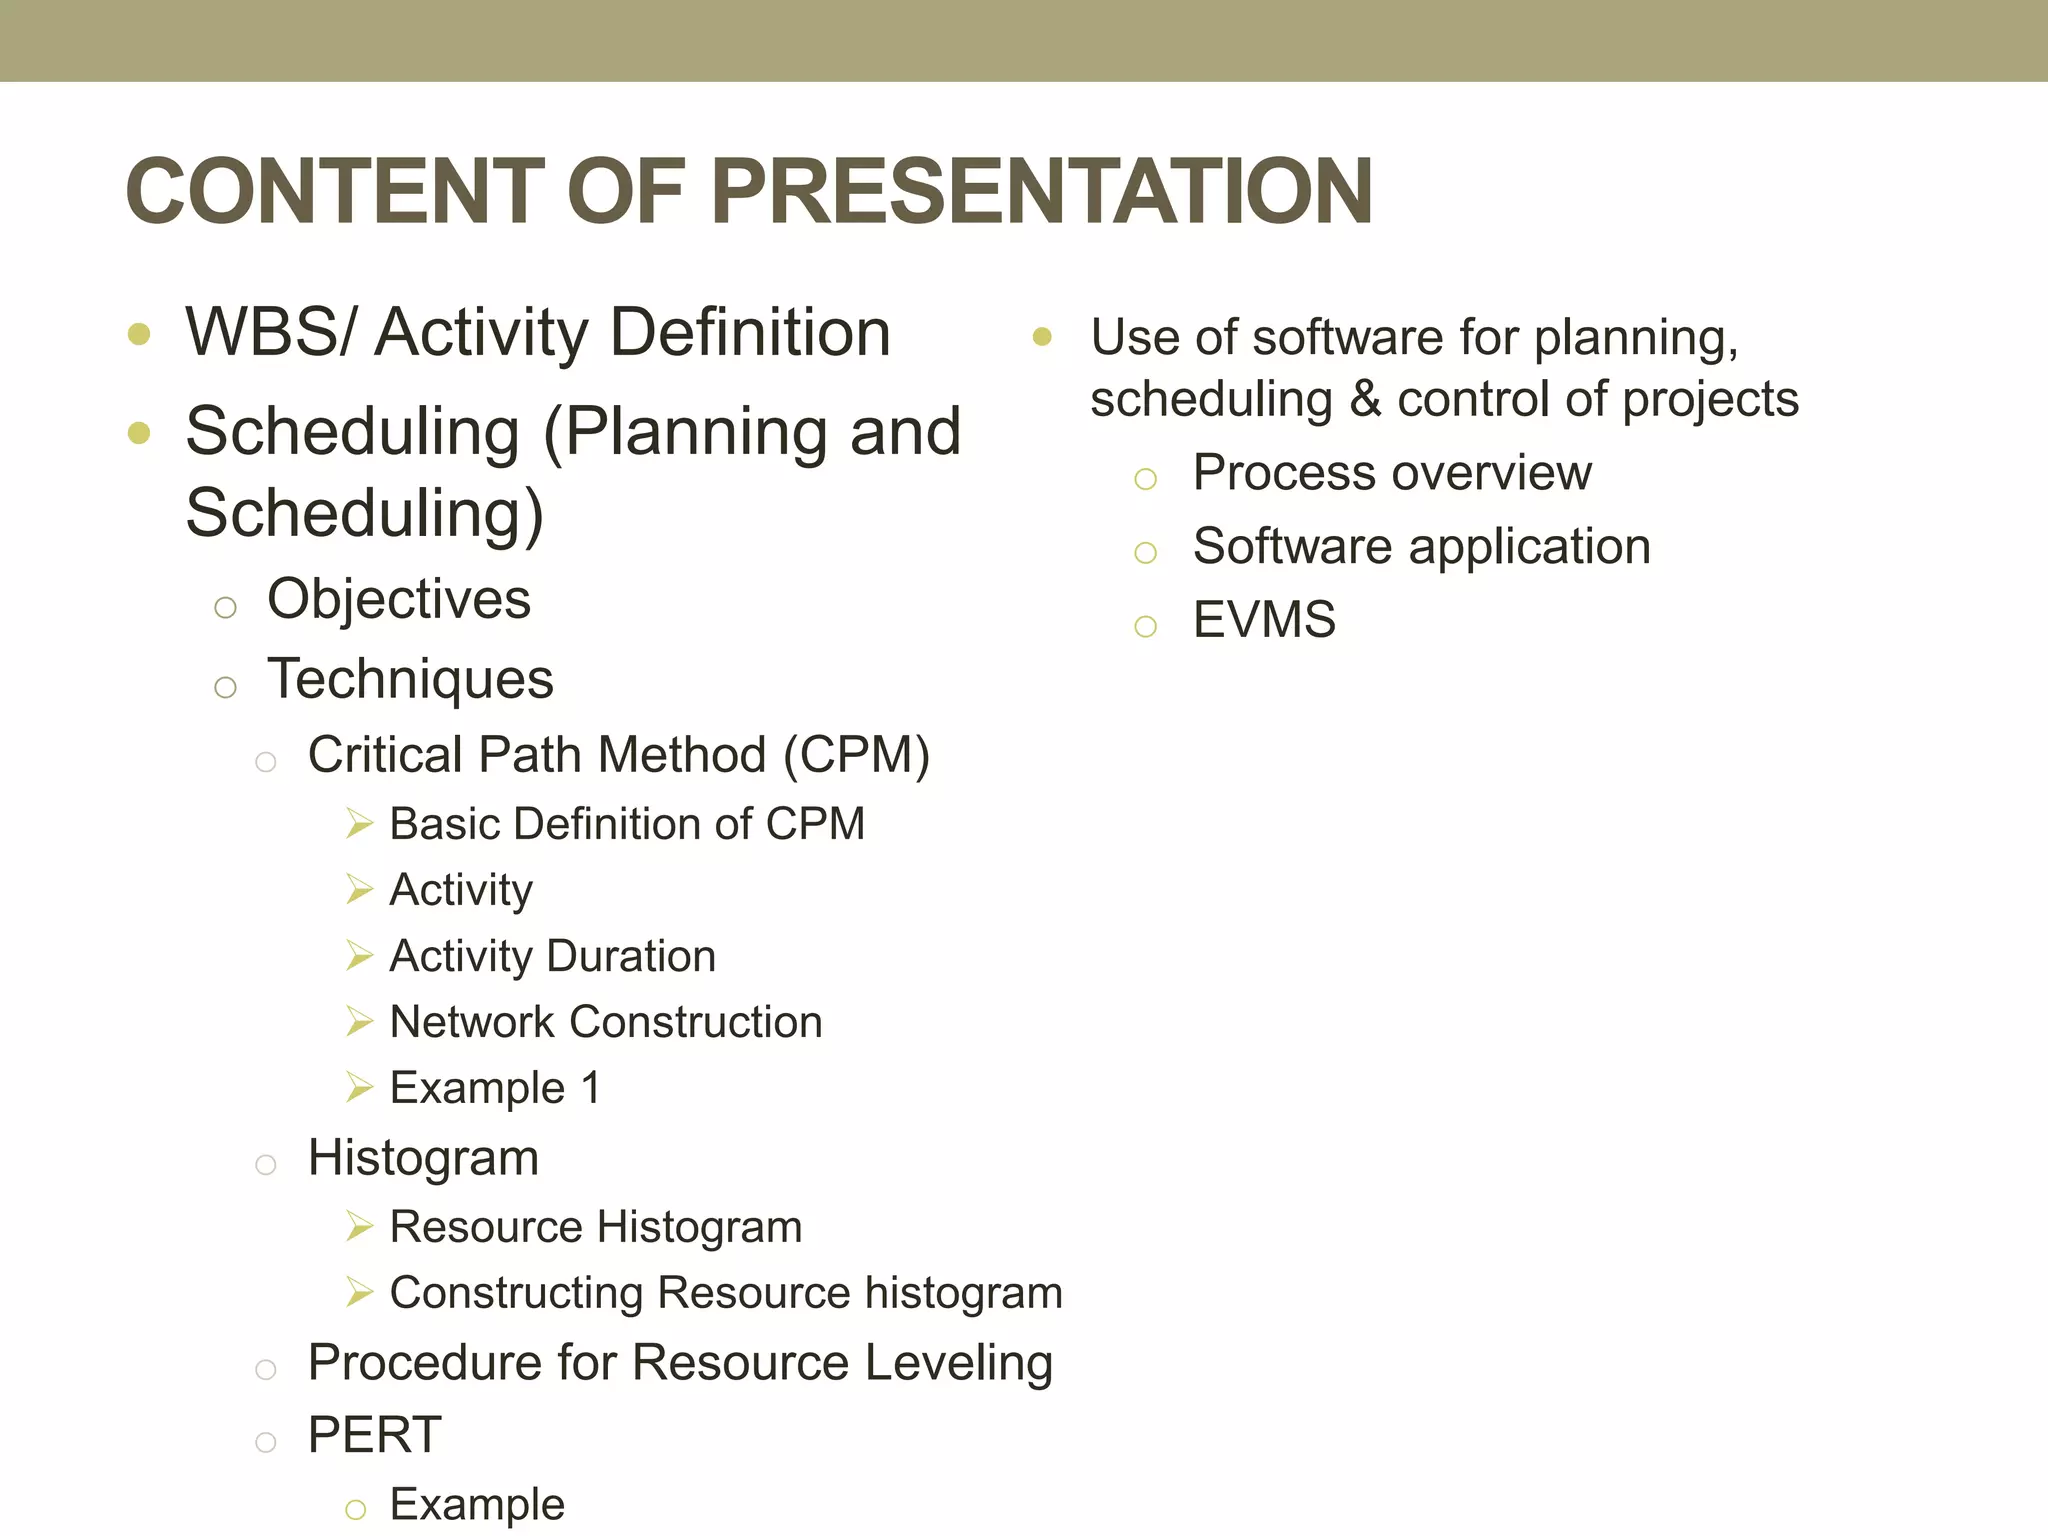
CONTENT OF PRESENTATION
WBS/ Activity Definition
Scheduling (Planning and
Scheduling)
o Objectives
o Techniques
o Critical Path Method (CPM)
Basic Definition of CPM
Activity
Activity Duration
Network Construction
Example 1
o Histogram
Resource Histogram
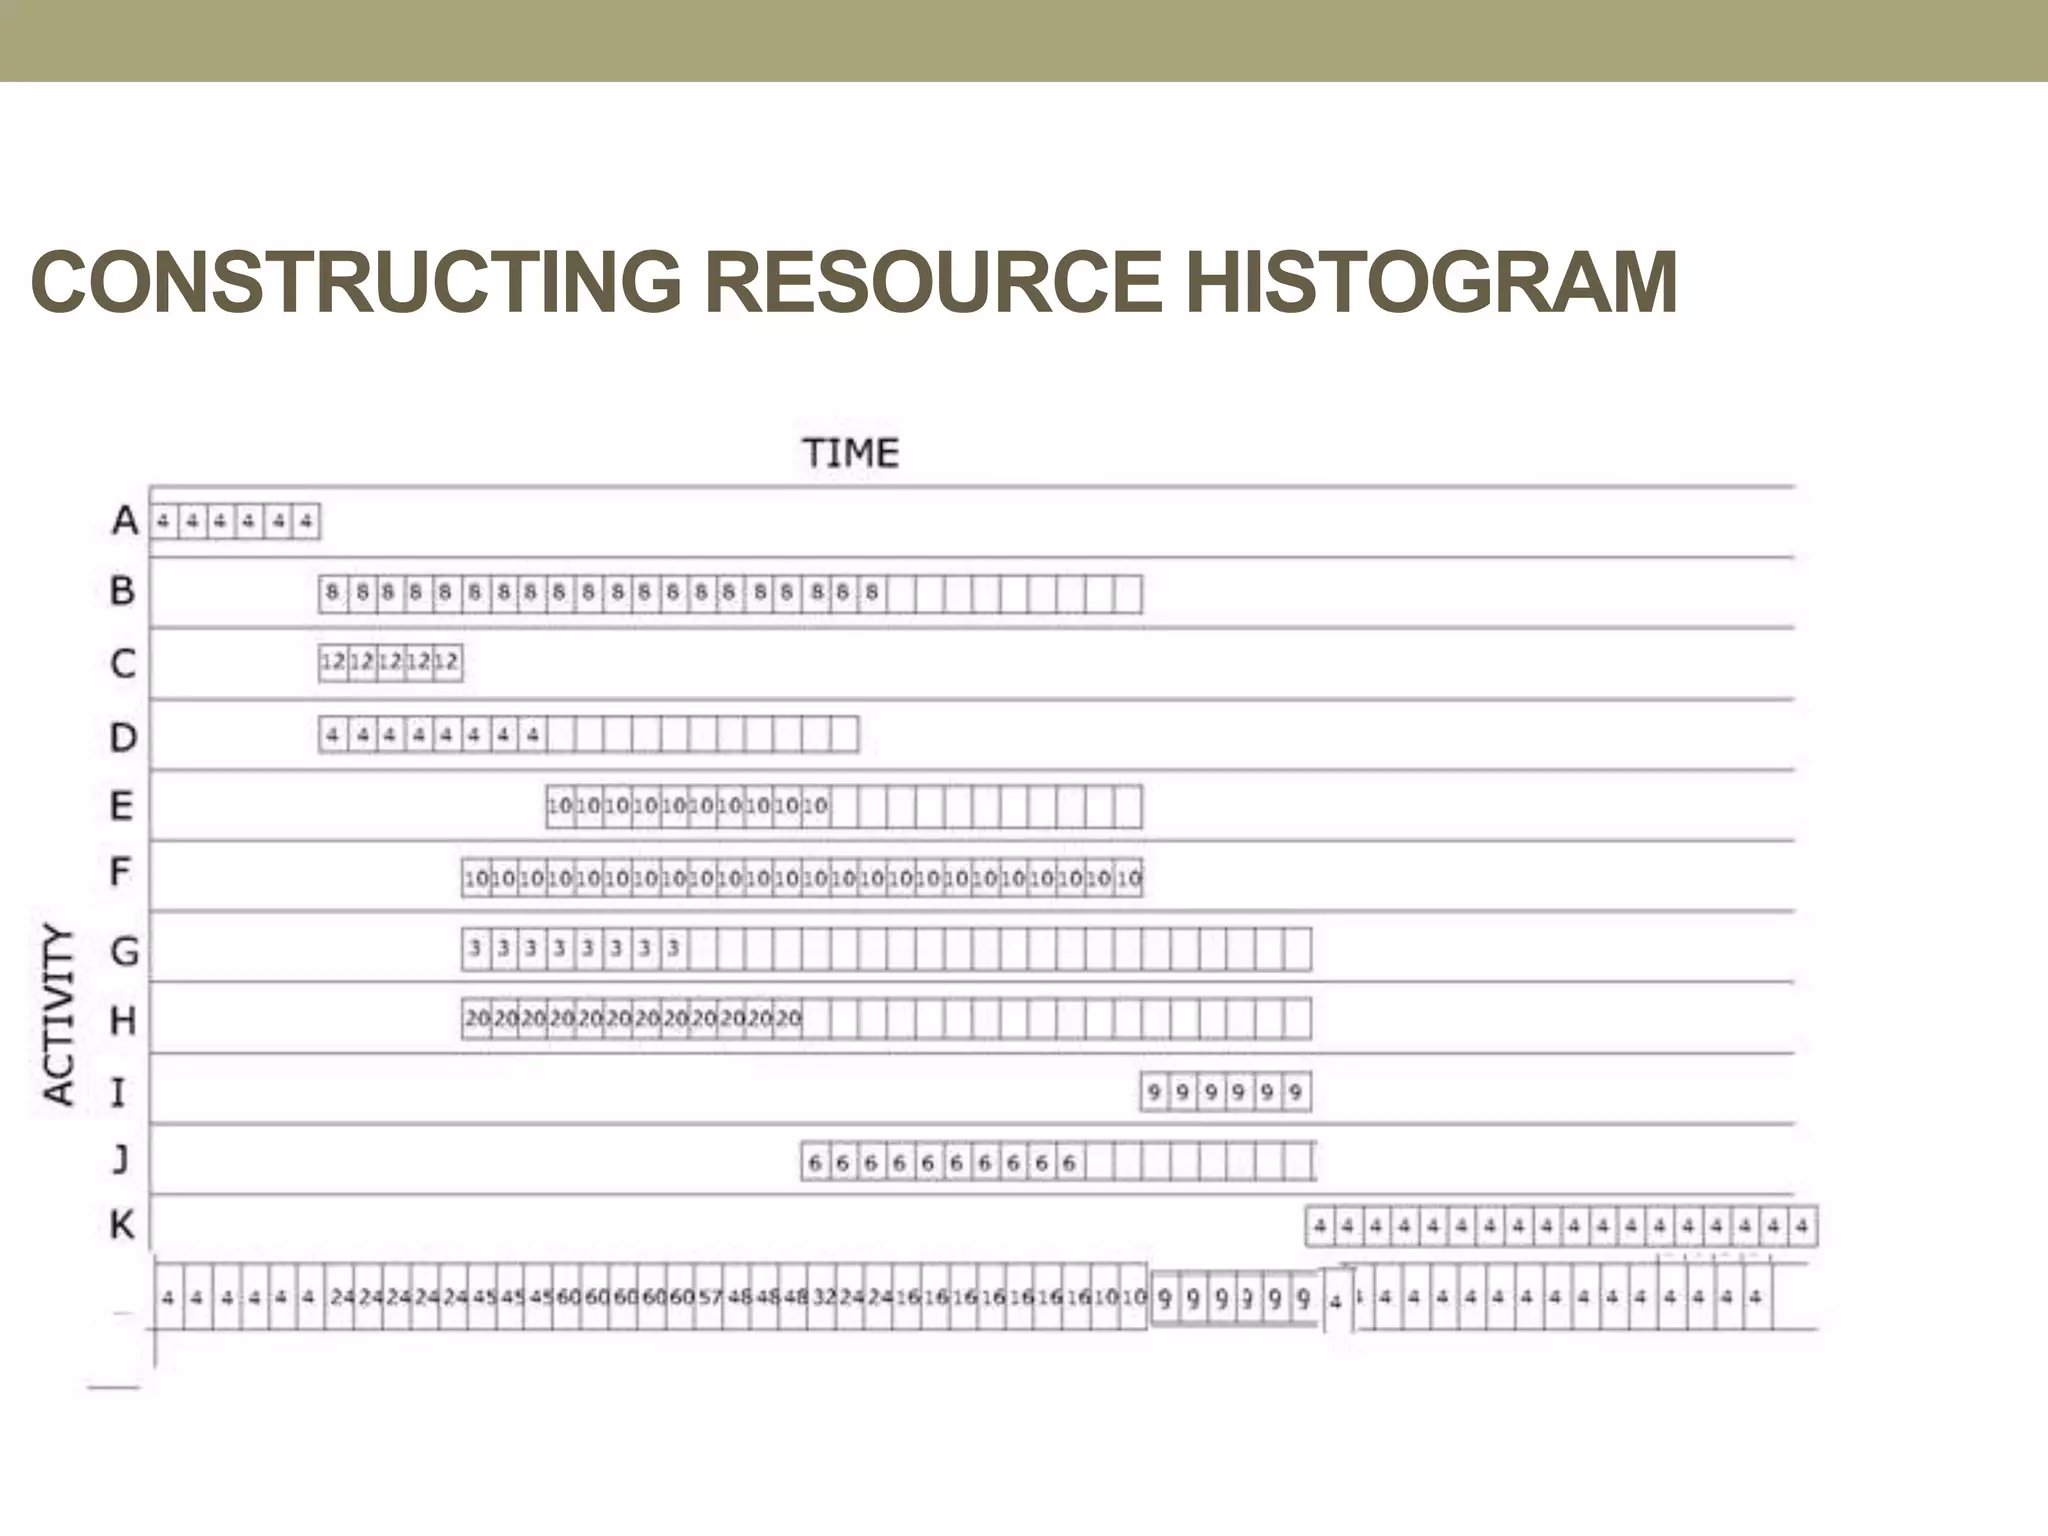
Constructing Resource histogram
o Procedure for Resource Leveling
o PERT
o Example
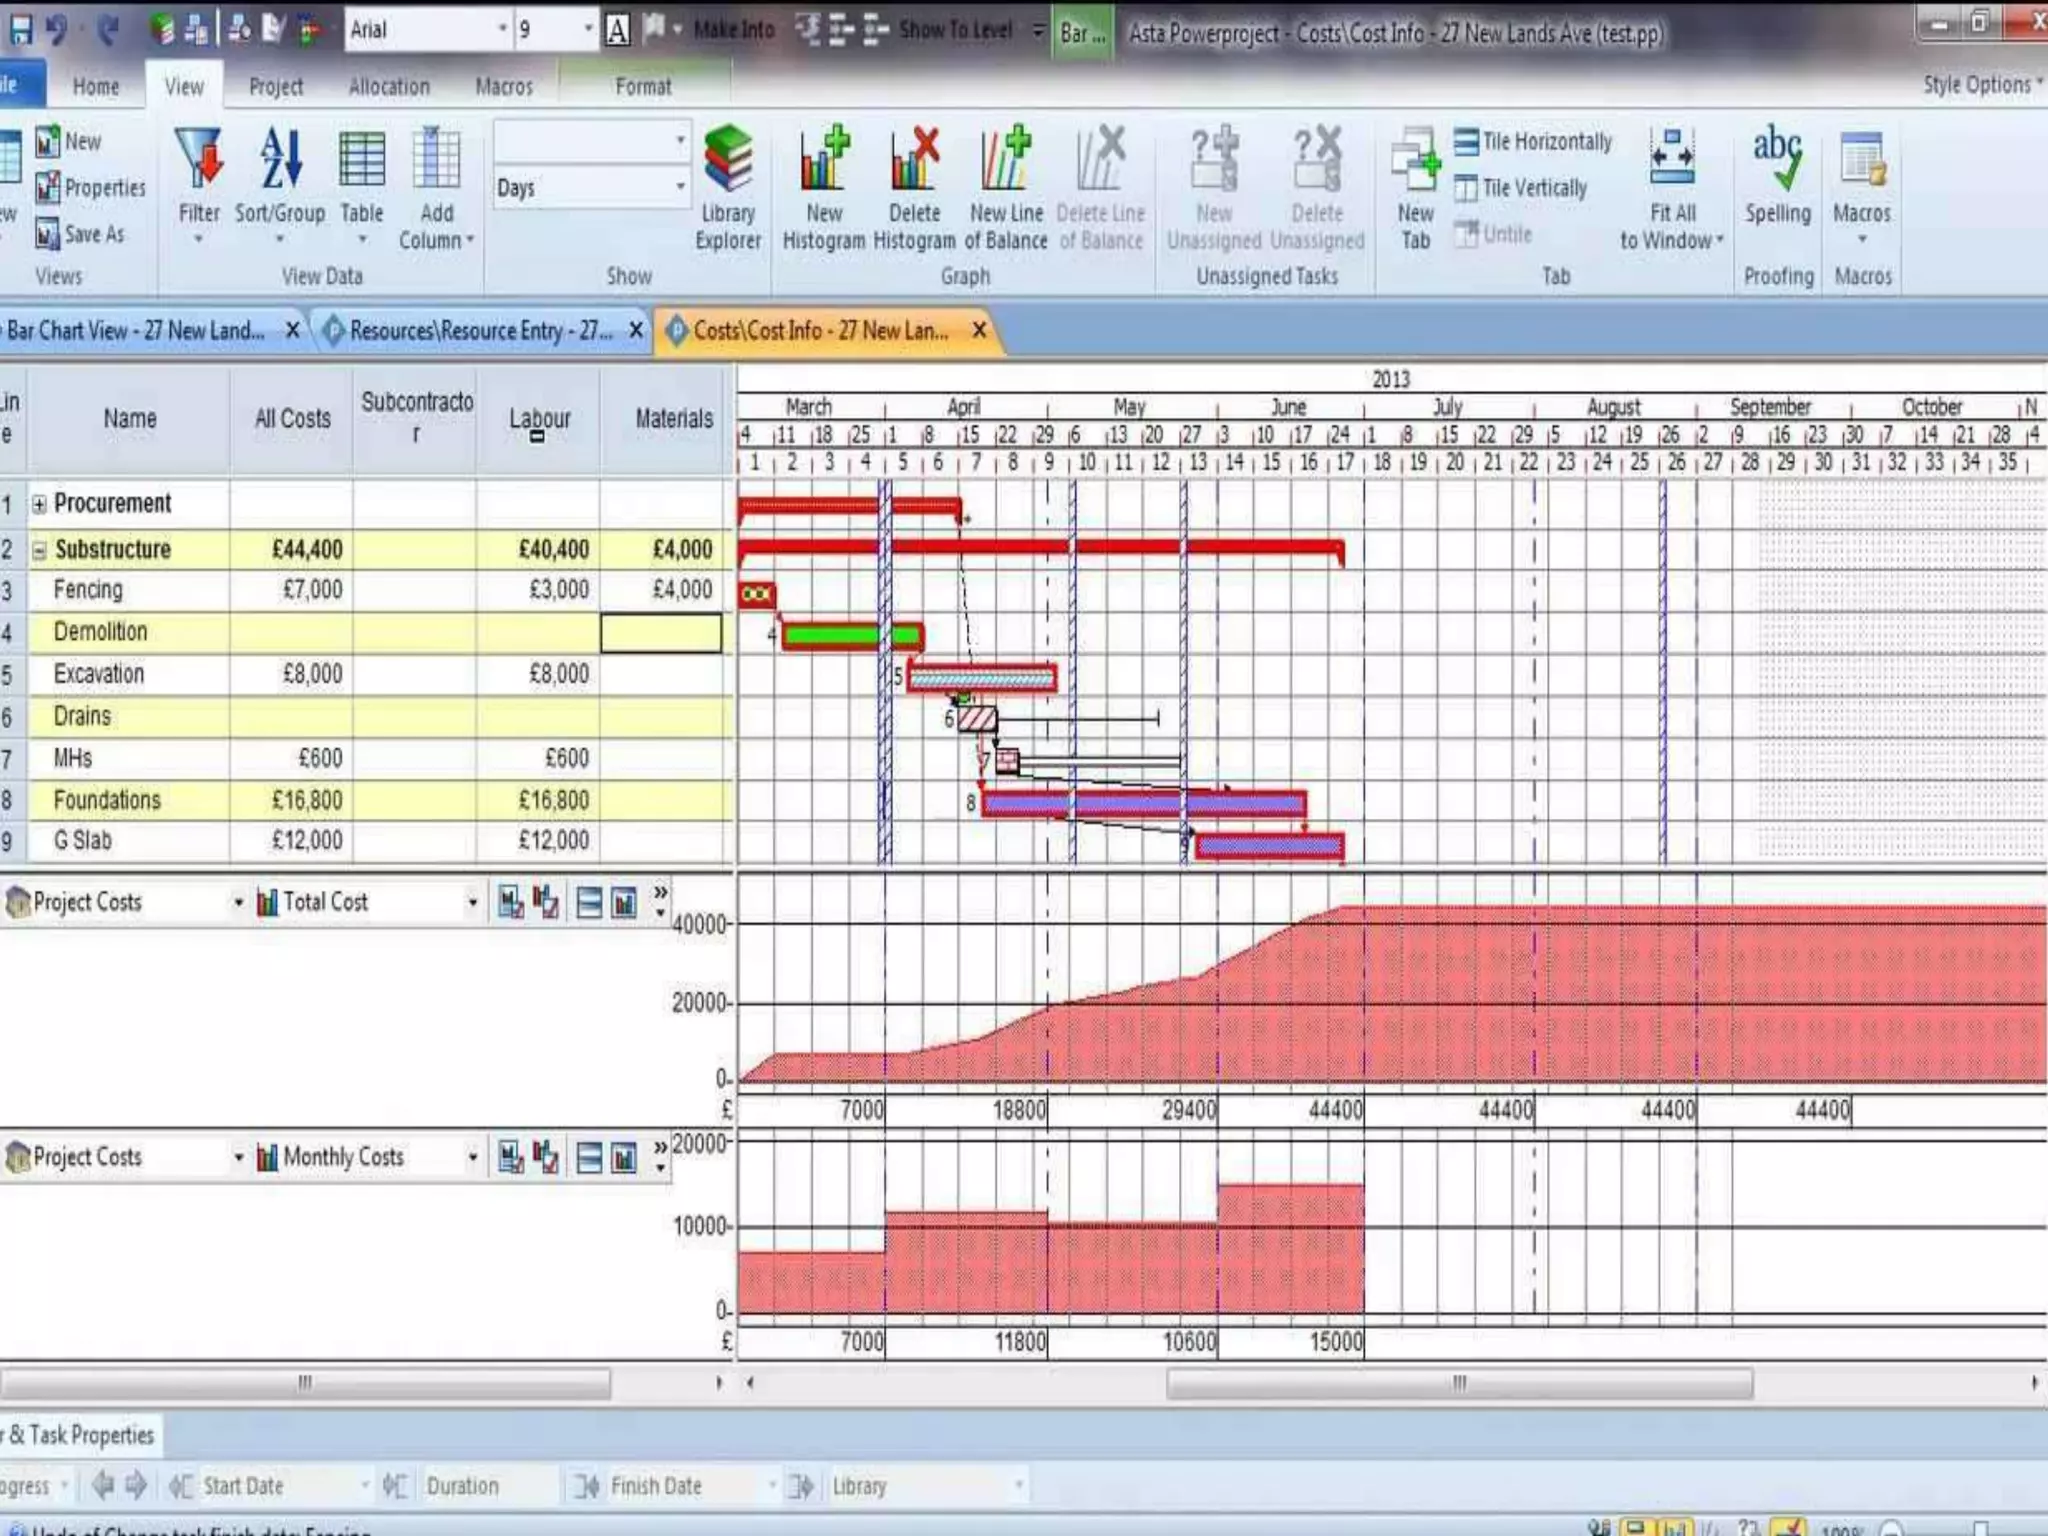
Use of software for planning,
scheduling & control of projects
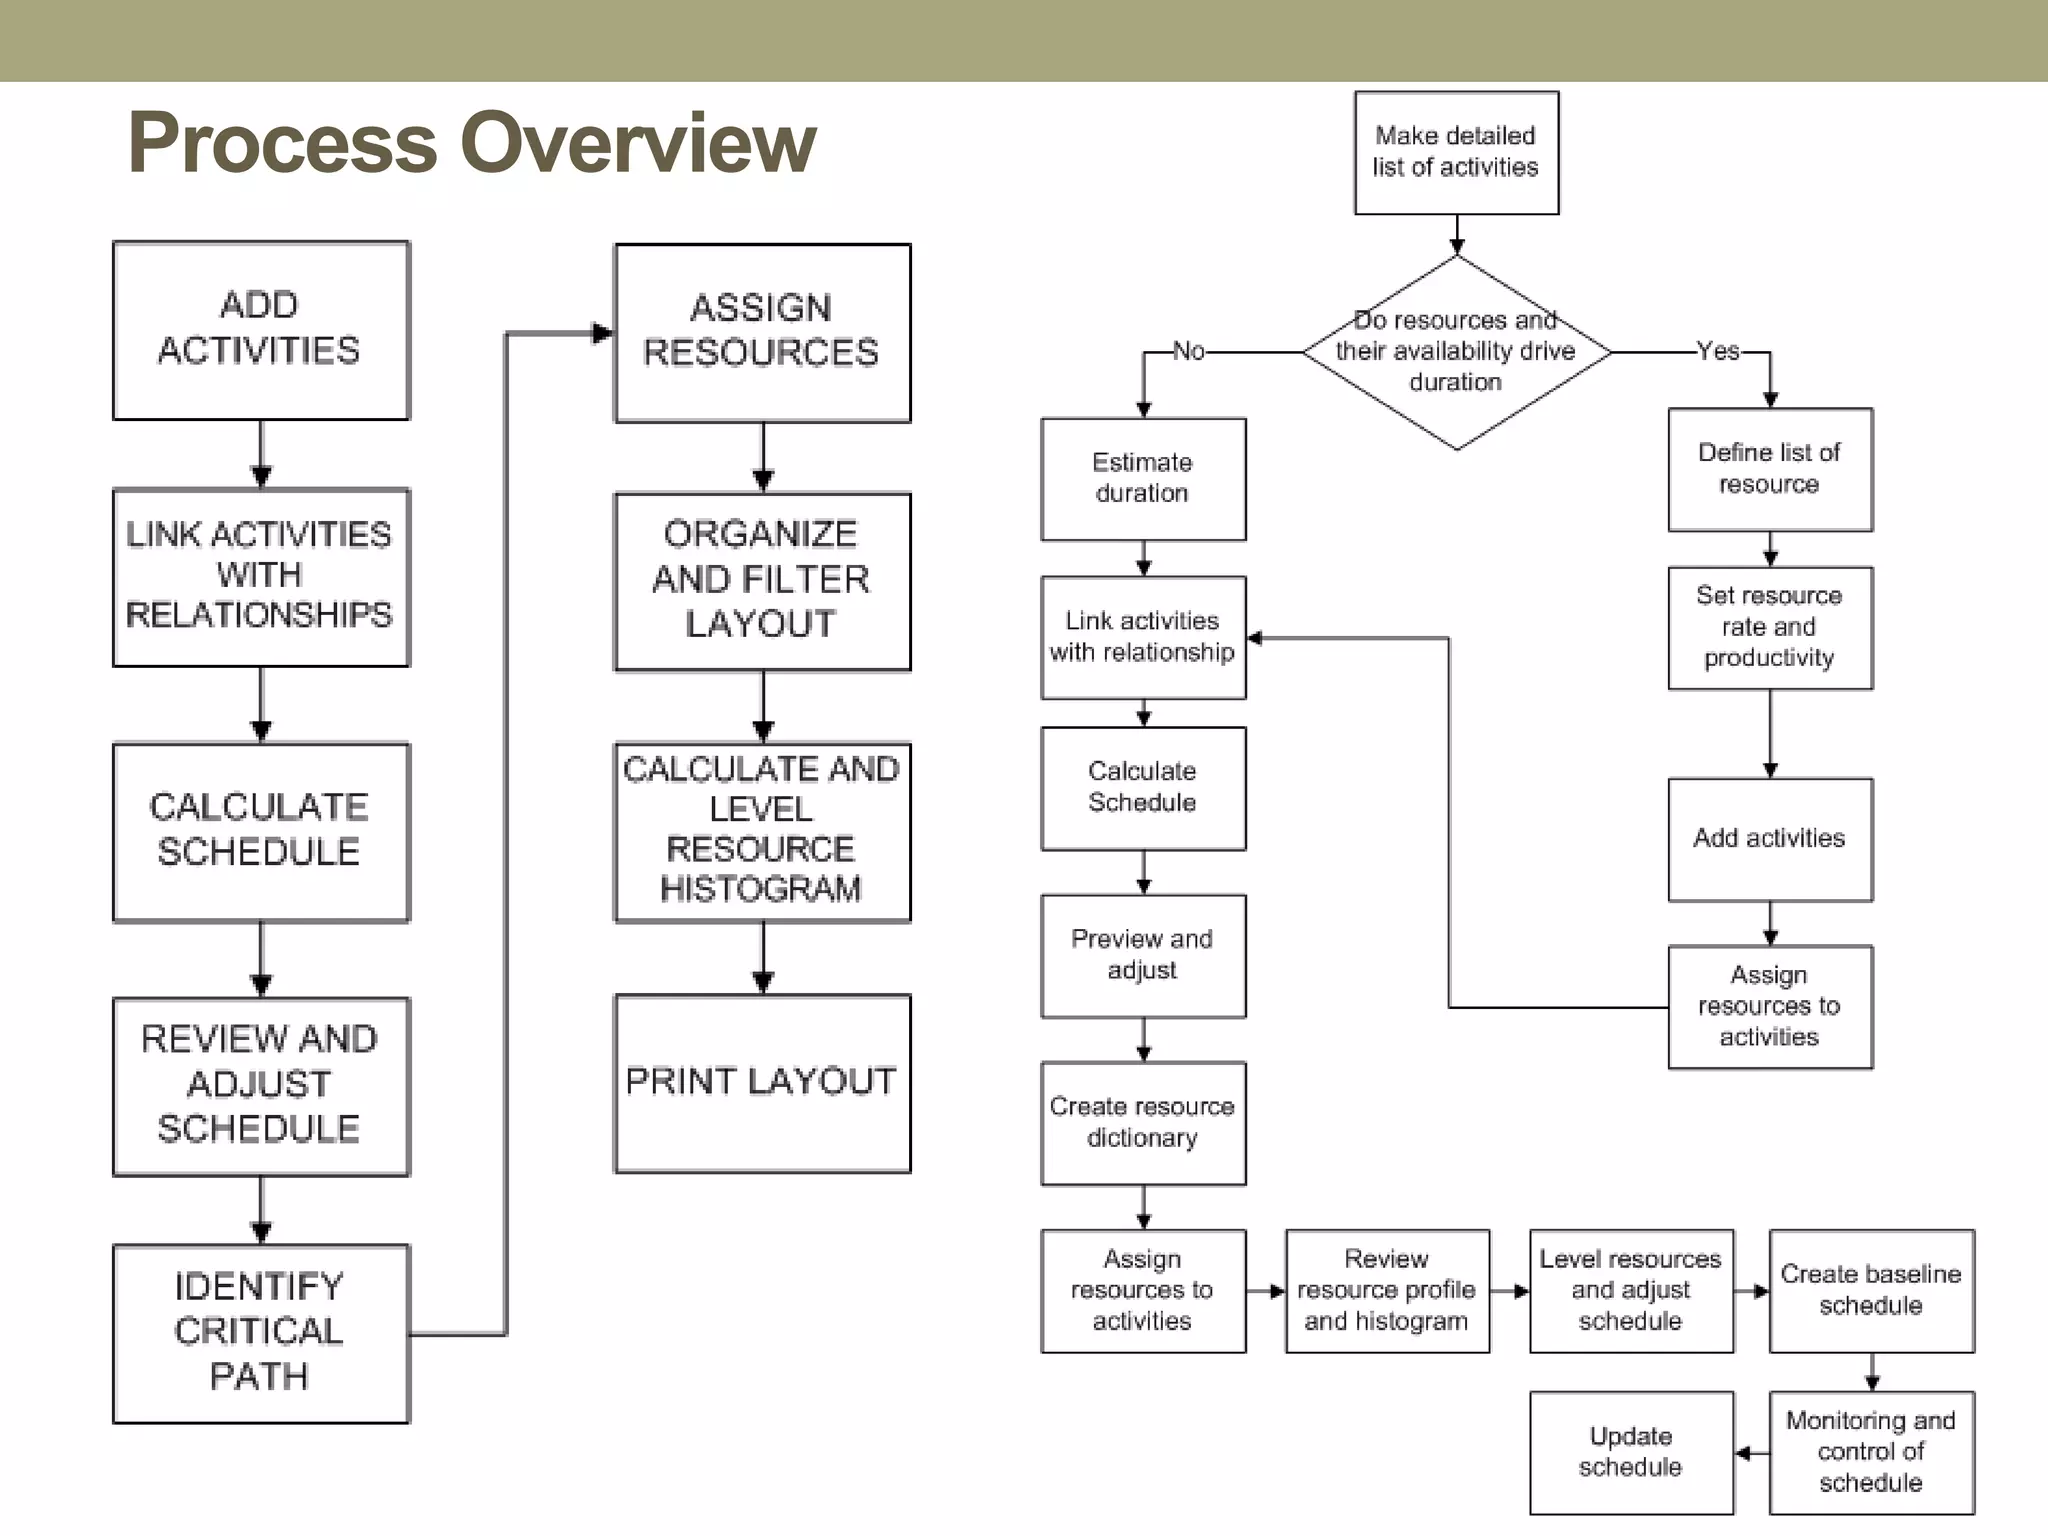
o Process overview
o Software application
o EVMS
3.
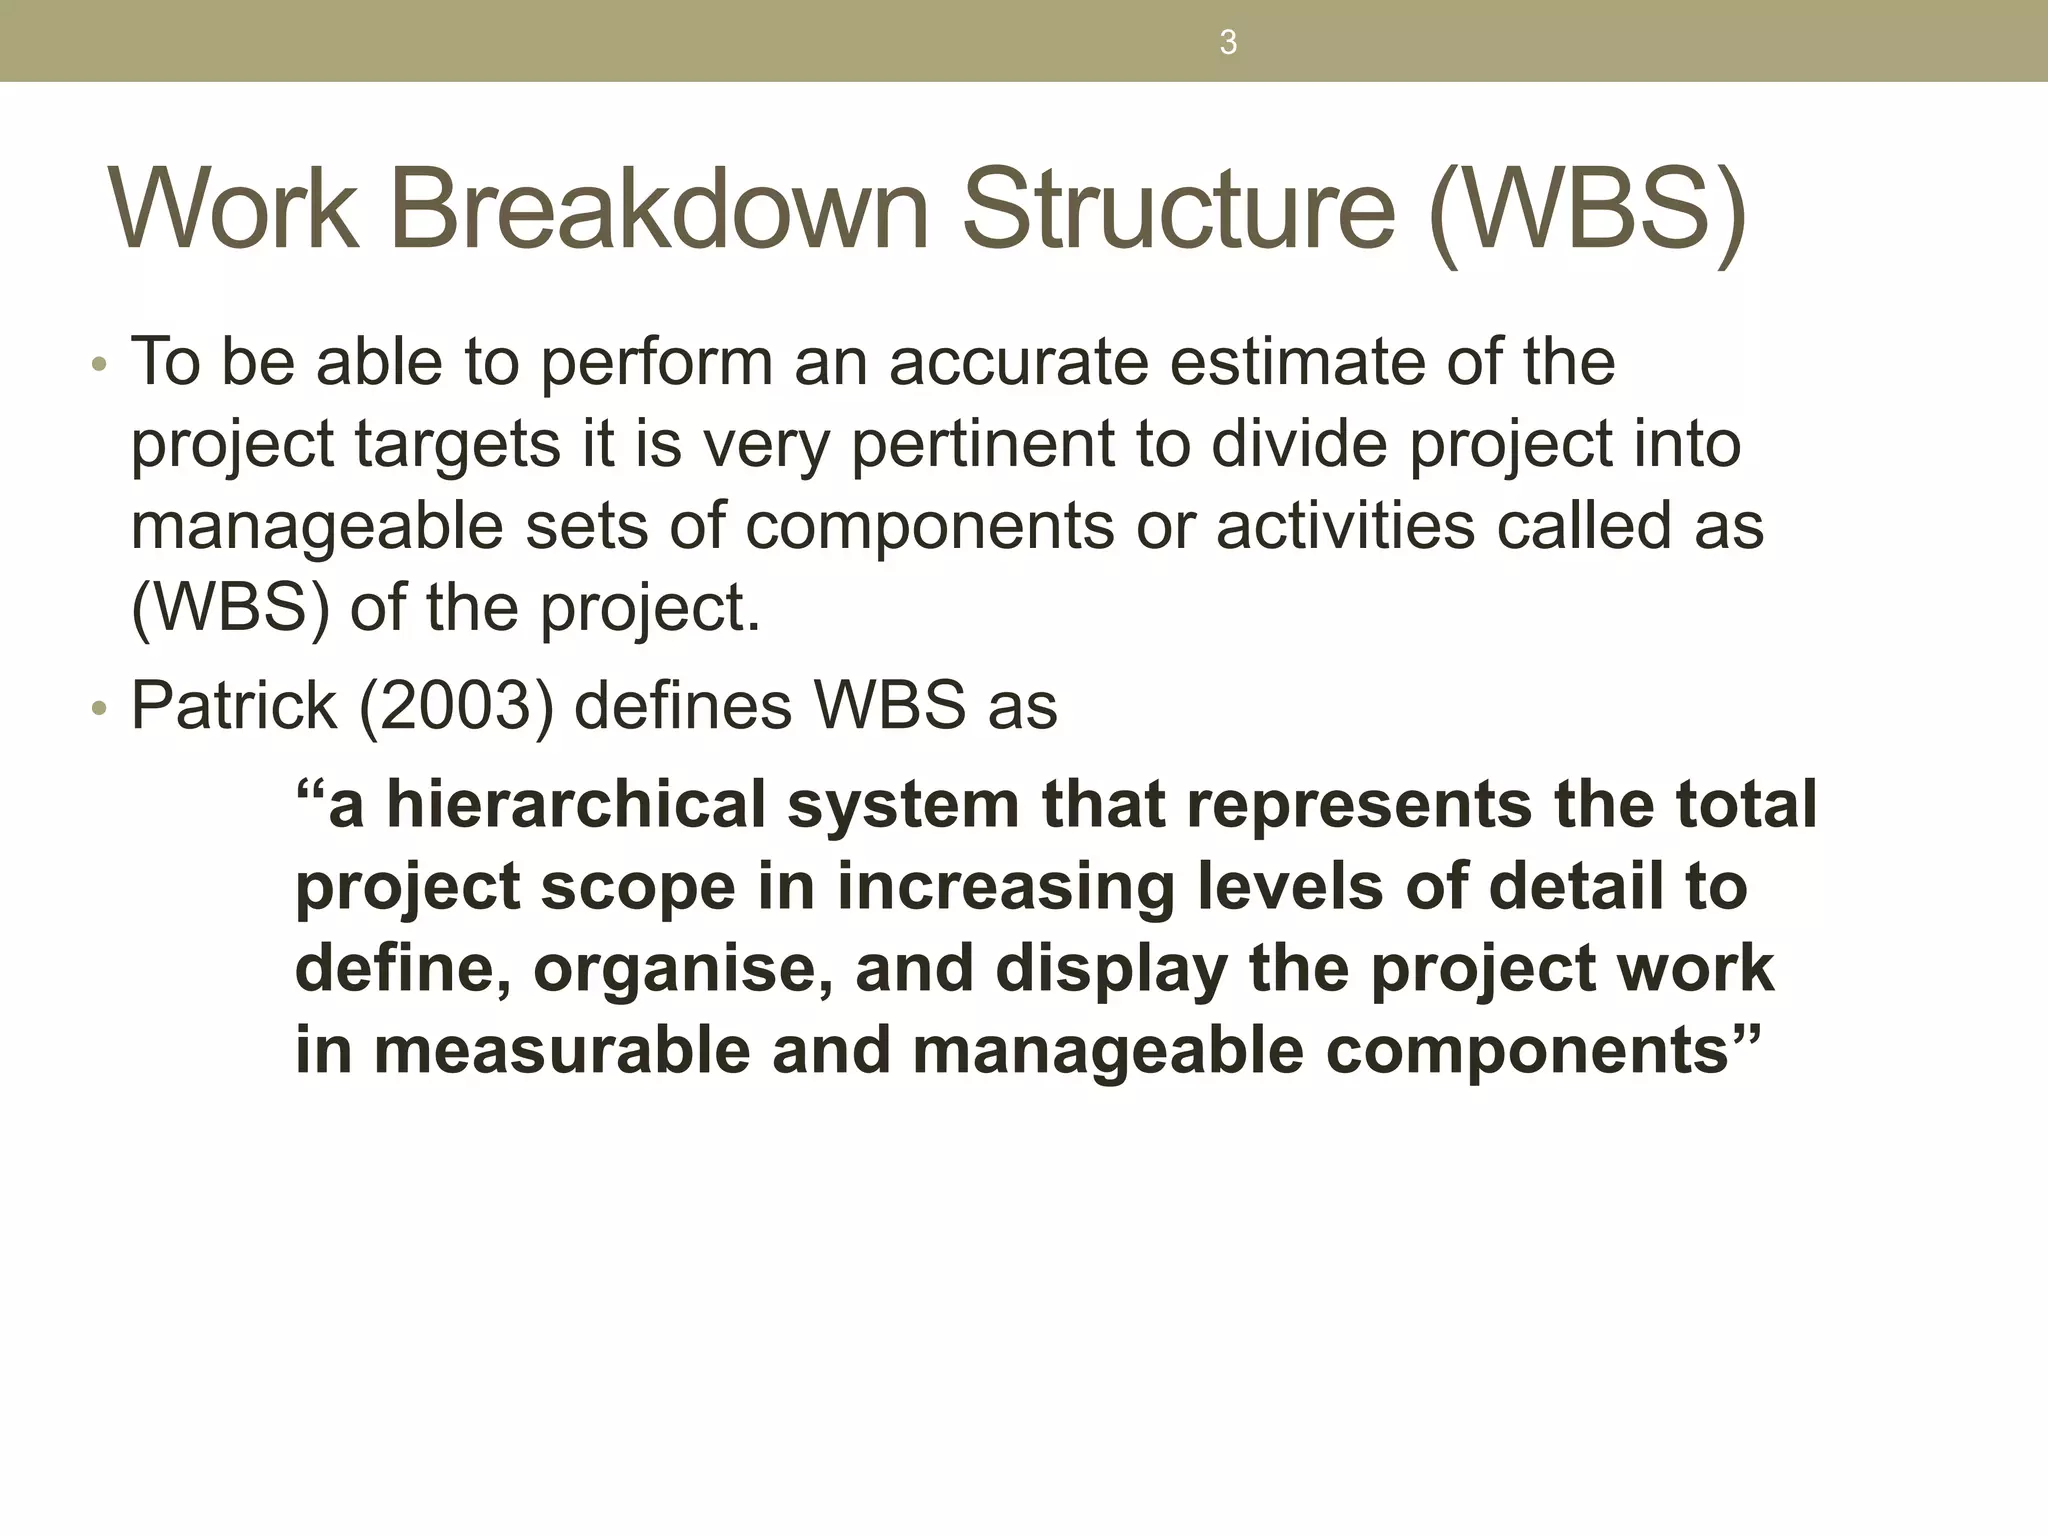
Work Breakdown Structure(WBS)
• To be able to perform an accurate estimate of the
project targets it is very pertinent to divide project into
manageable sets of components or activities called as
(WBS) of the project.
• Patrick (2003) defines WBS as
“a hierarchical system that represents the total
project scope in increasing levels of detail to
define, organise, and display the project work
in measurable and manageable components”
3
4.
Work Breakdown Structure(WBS)
PMI
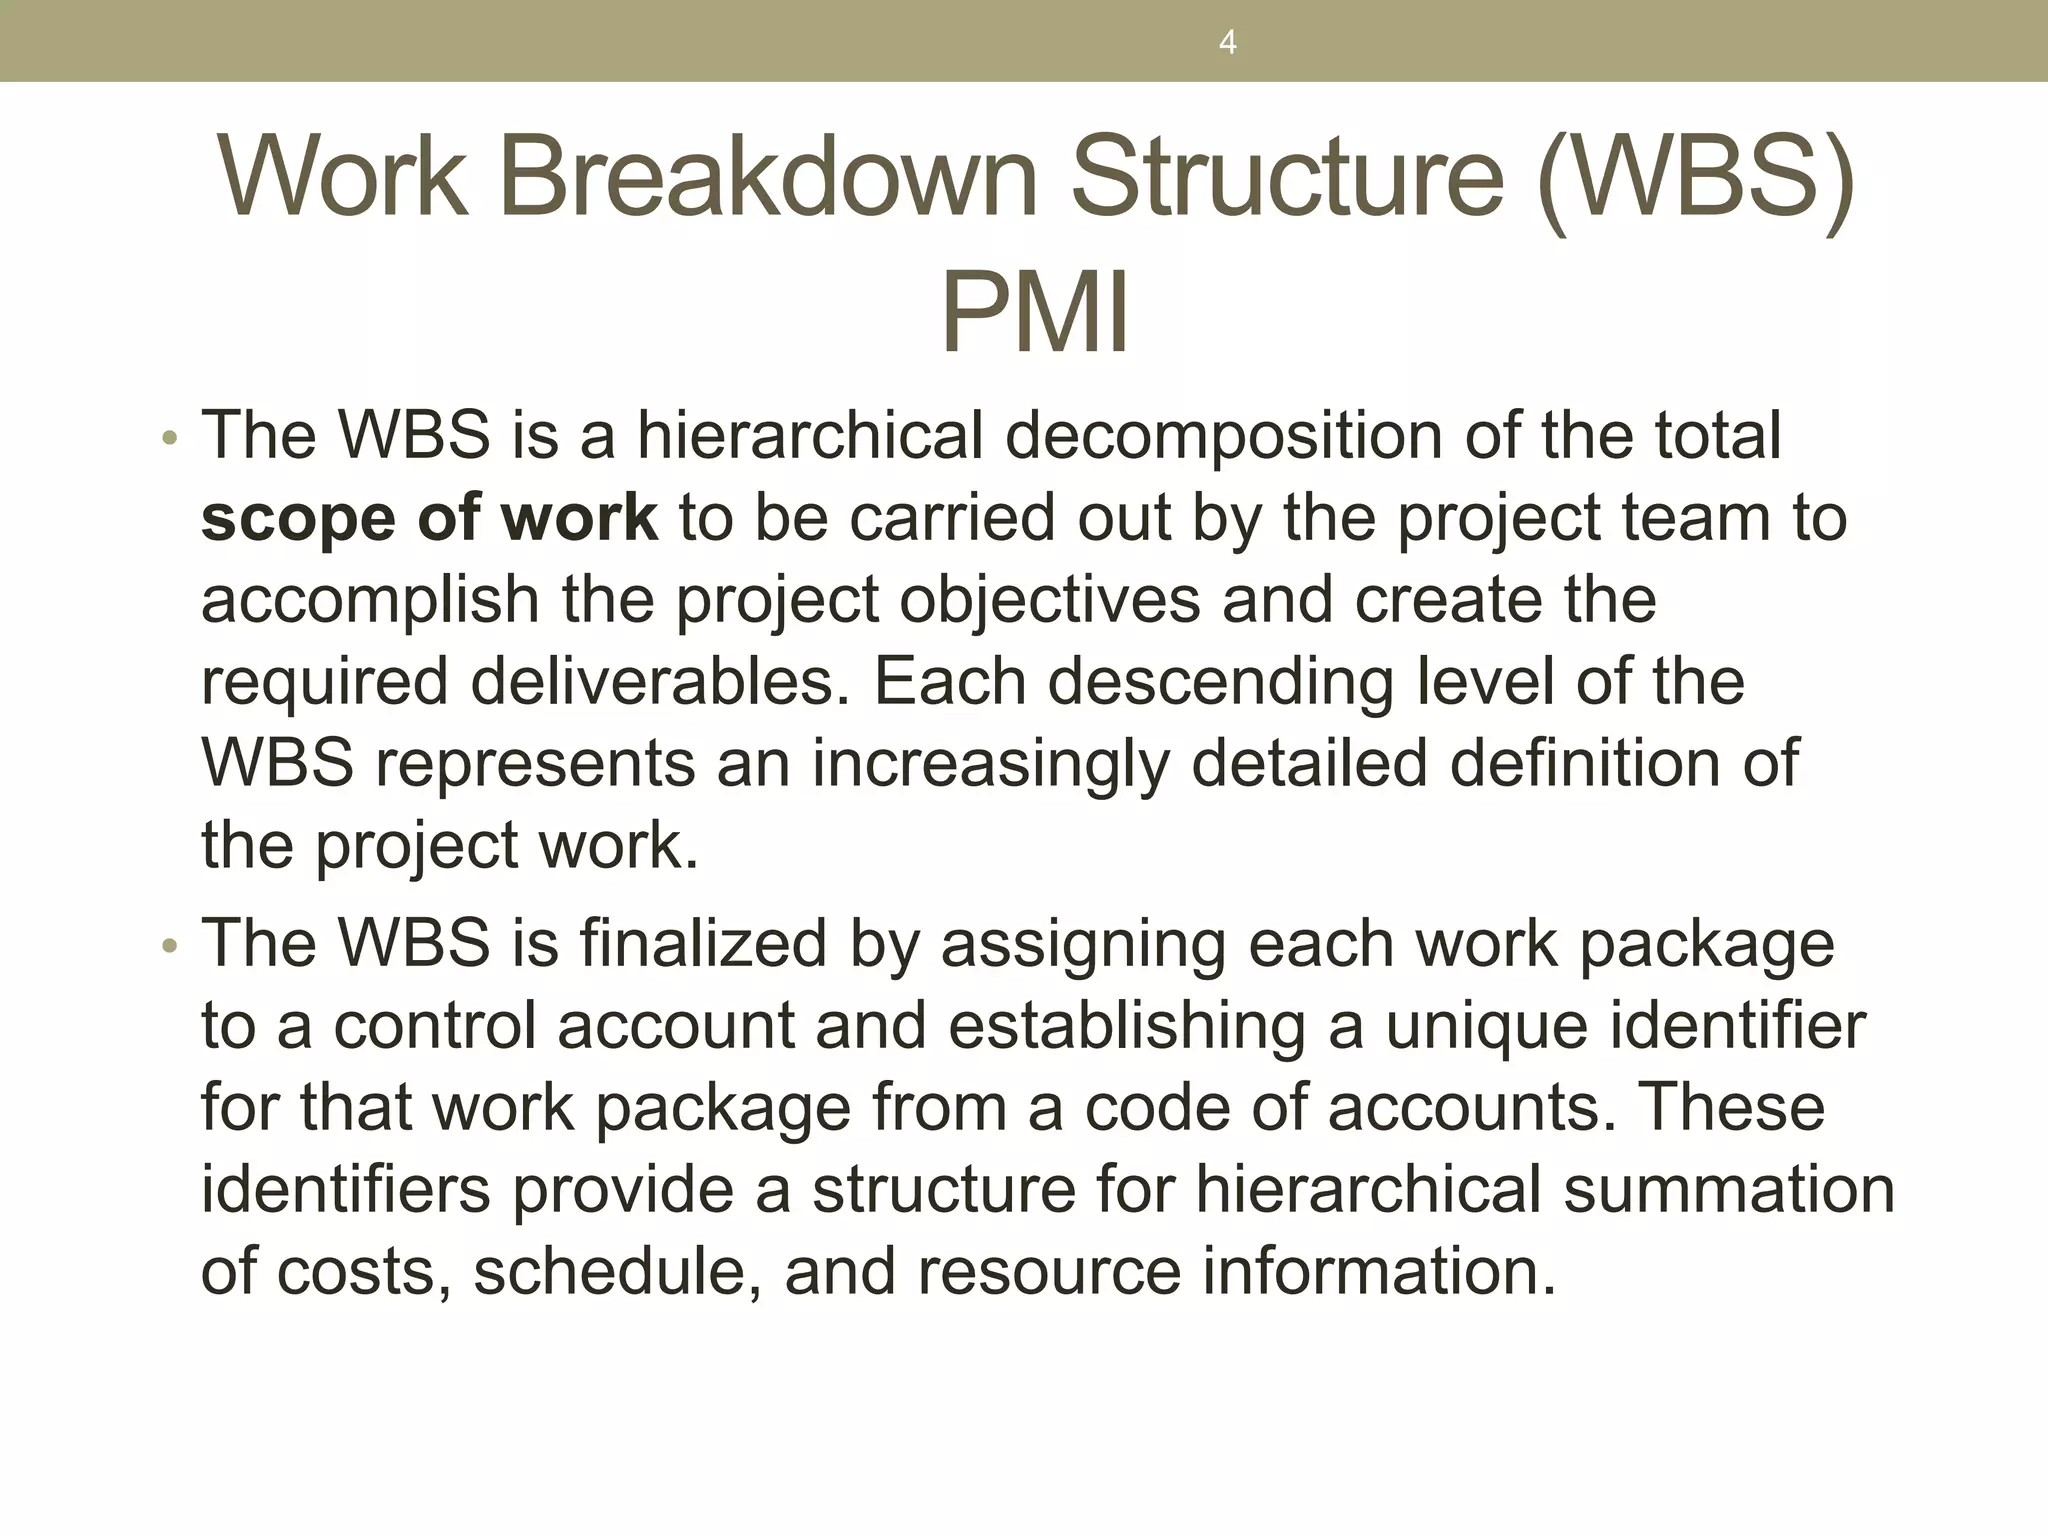
• The WBS is a hierarchical decomposition of the total
scope of work to be carried out by the project team to
accomplish the project objectives and create the
required deliverables. Each descending level of the
WBS represents an increasingly detailed definition of
the project work.
• The WBS is finalized by assigning each work package
to a control account and establishing a unique identifier
for that work package from a code of accounts. These
identifiers provide a structure for hierarchical summation
of costs, schedule, and resource information.
4
Work Breakdown Structure(WBS)
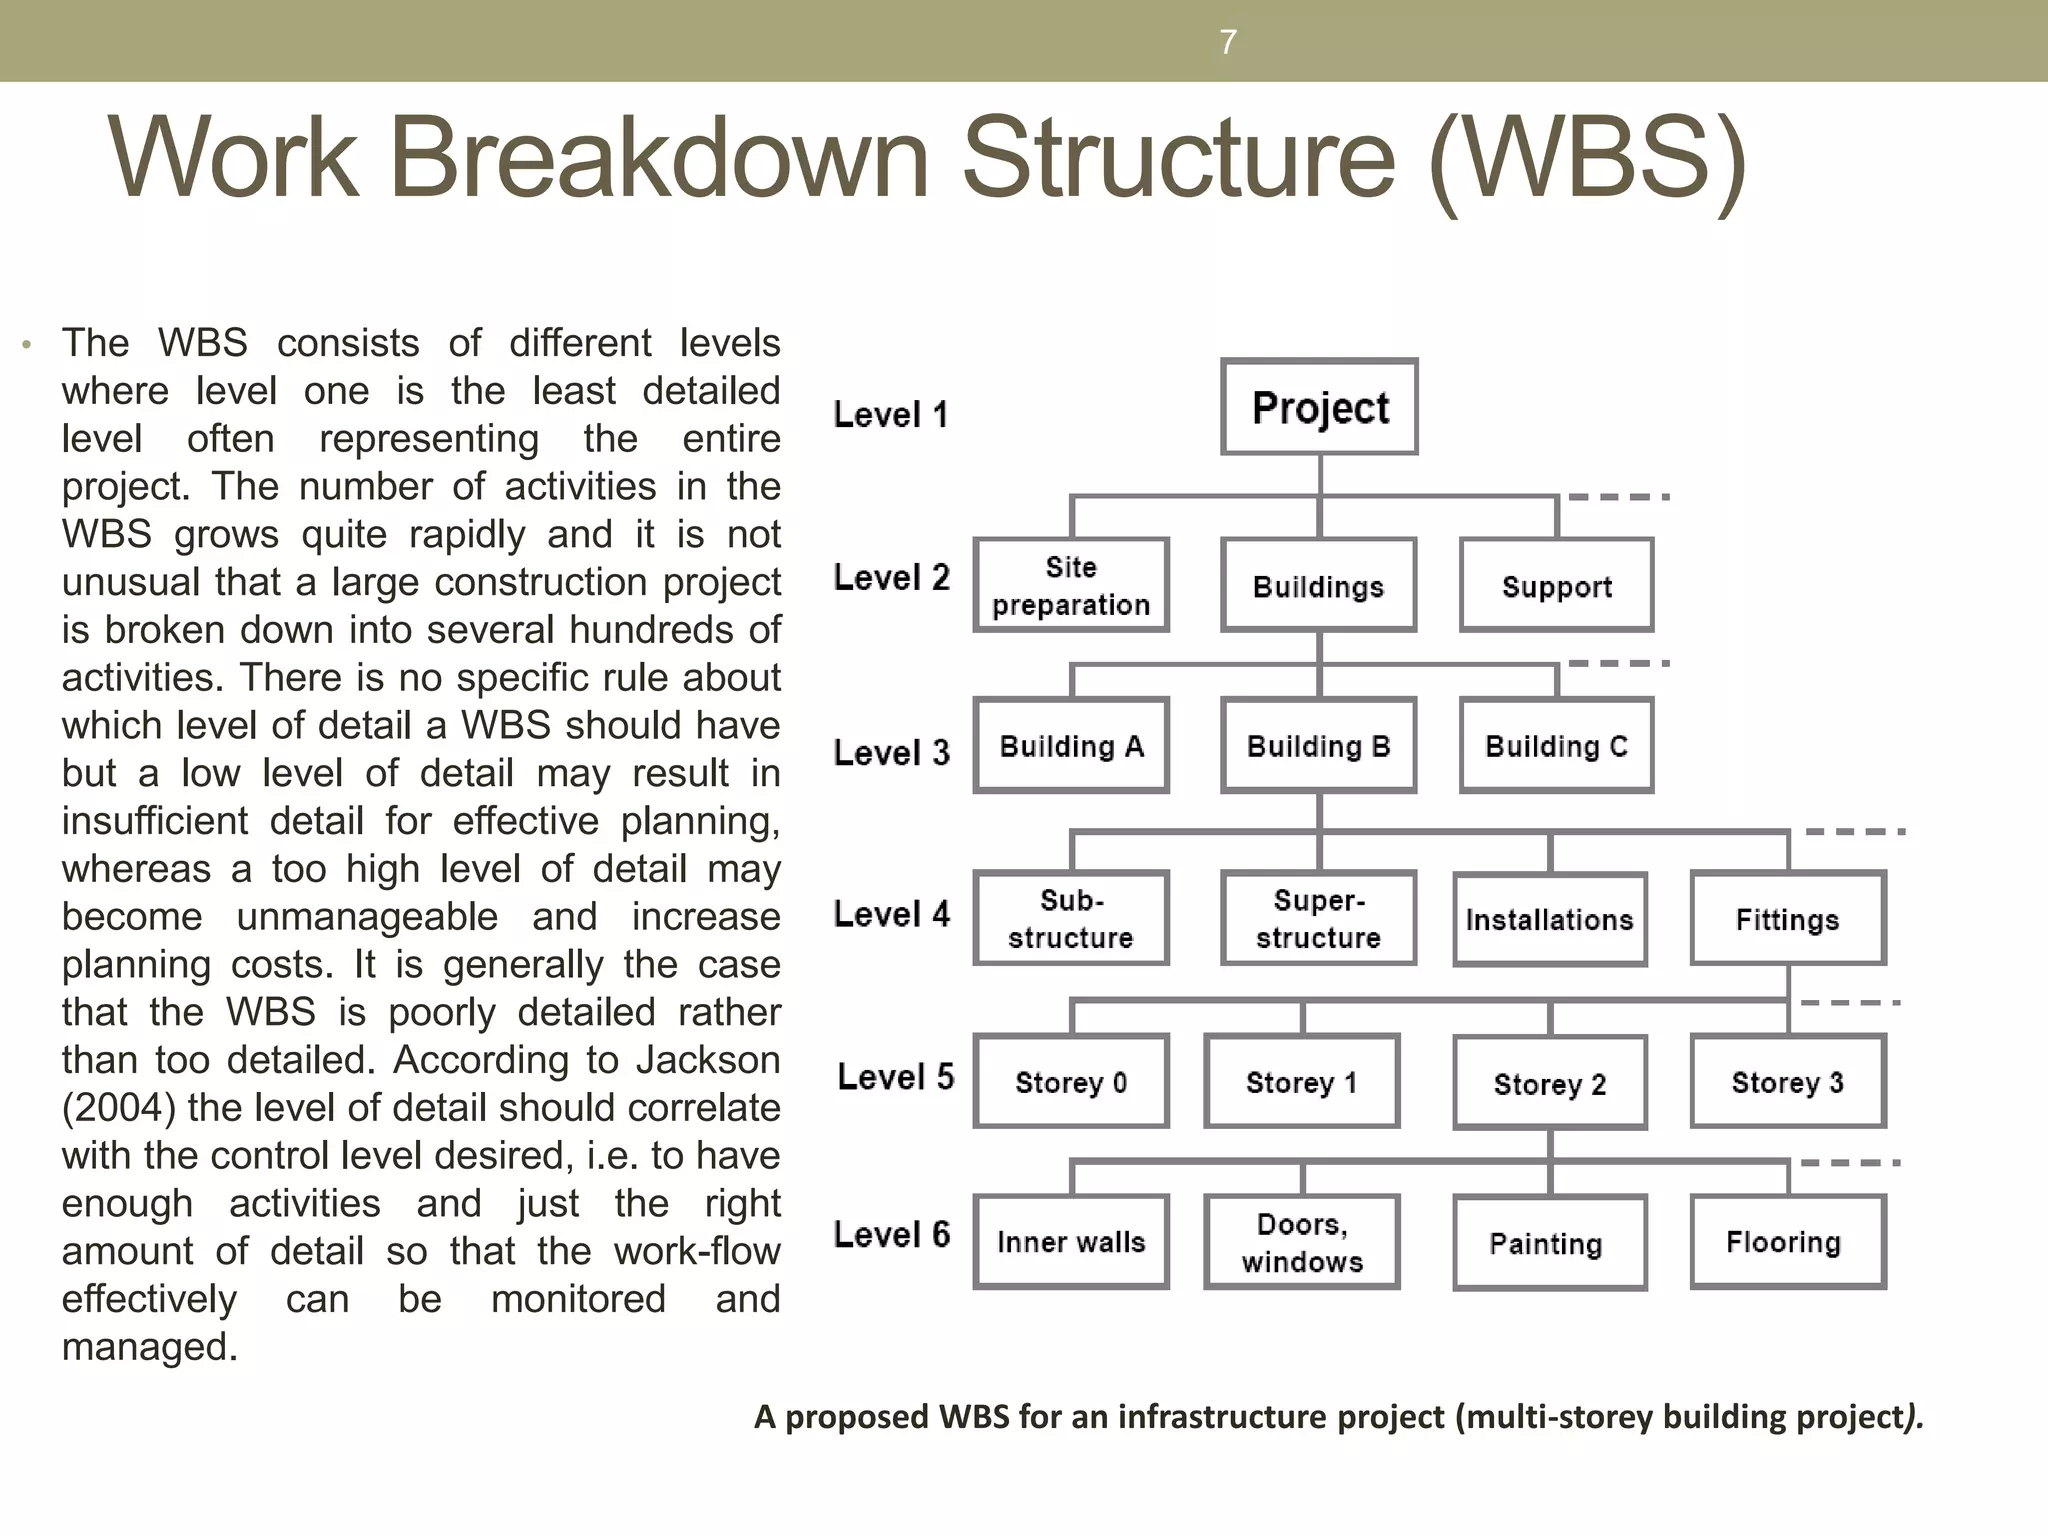
• The WBS consists of different levels
where level one is the least detailed
level often representing the entire
project. The number of activities in the
WBS grows quite rapidly and it is not
unusual that a large construction project
is broken down into several hundreds of
activities. There is no specific rule about
which level of detail a WBS should have
but a low level of detail may result in
insufficient detail for effective planning,
whereas a too high level of detail may
become unmanageable and increase
planning costs. It is generally the case
that the WBS is poorly detailed rather
than too detailed. According to Jackson
(2004) the level of detail should correlate
with the control level desired, i.e. to have
enough activities and just the right
amount of detail so that the work-flow
effectively can be monitored and
managed.
7
A proposed WBS for an infrastructure project (multi-storey building project).
8.
Creating the WorkBreakdown Structure
(WBS)
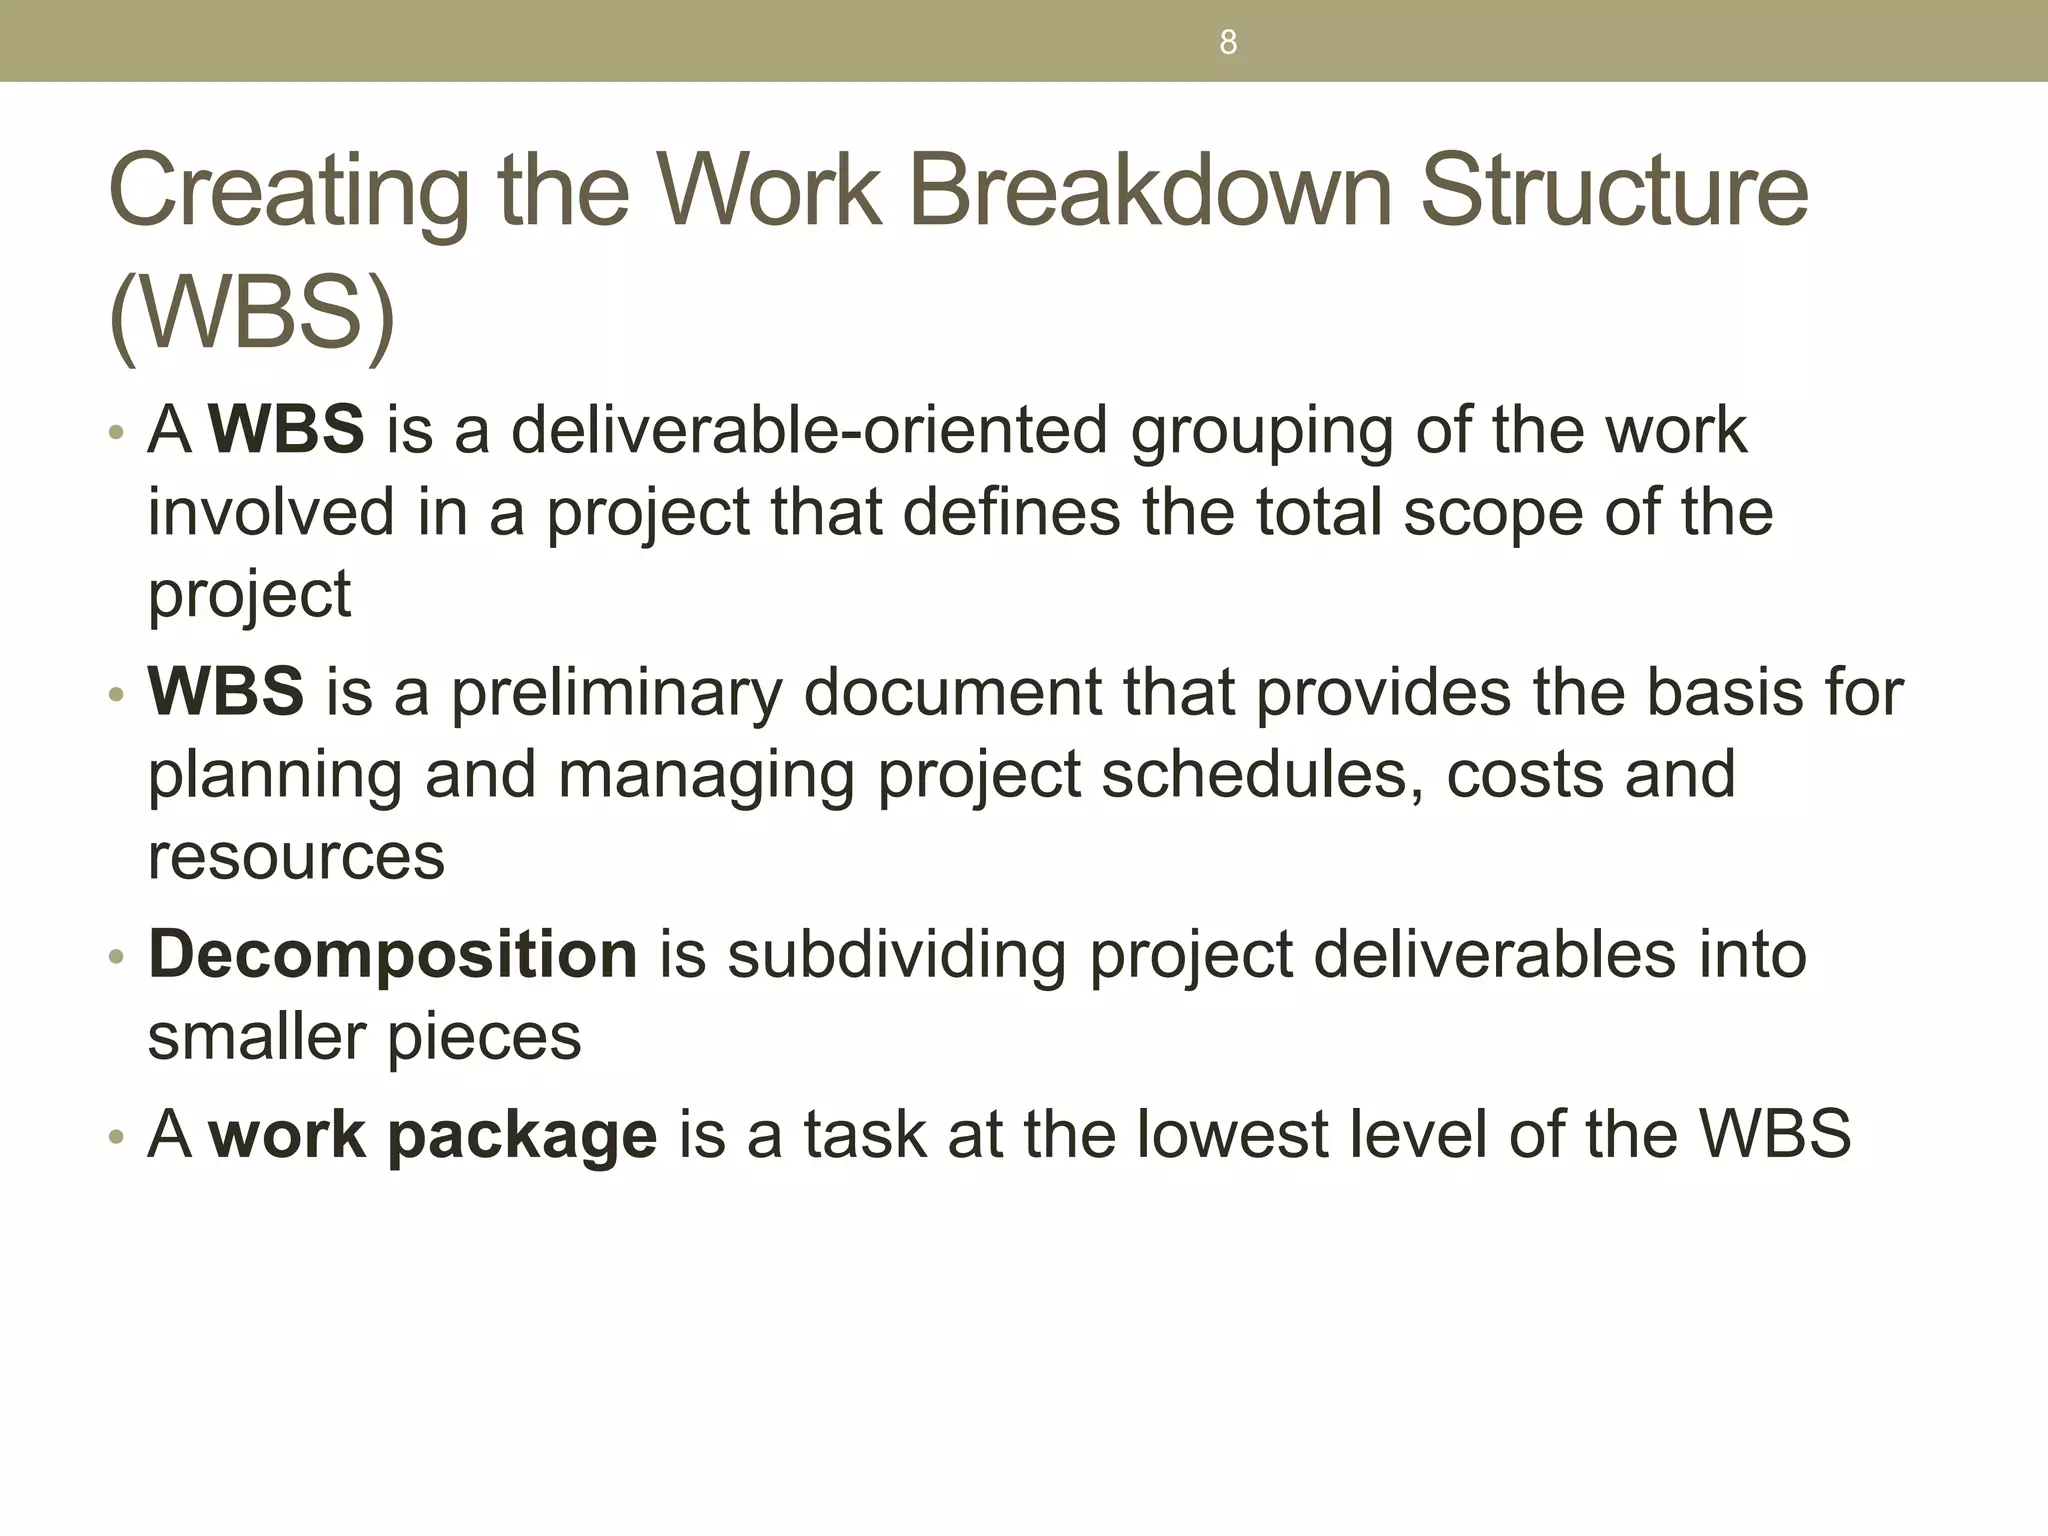
• A WBS is a deliverable-oriented grouping of the work
involved in a project that defines the total scope of the
project
• WBS is a preliminary document that provides the basis for
planning and managing project schedules, costs and
resources
• Decomposition is subdividing project deliverables into
smaller pieces
• A work package is a task at the lowest level of the WBS
8
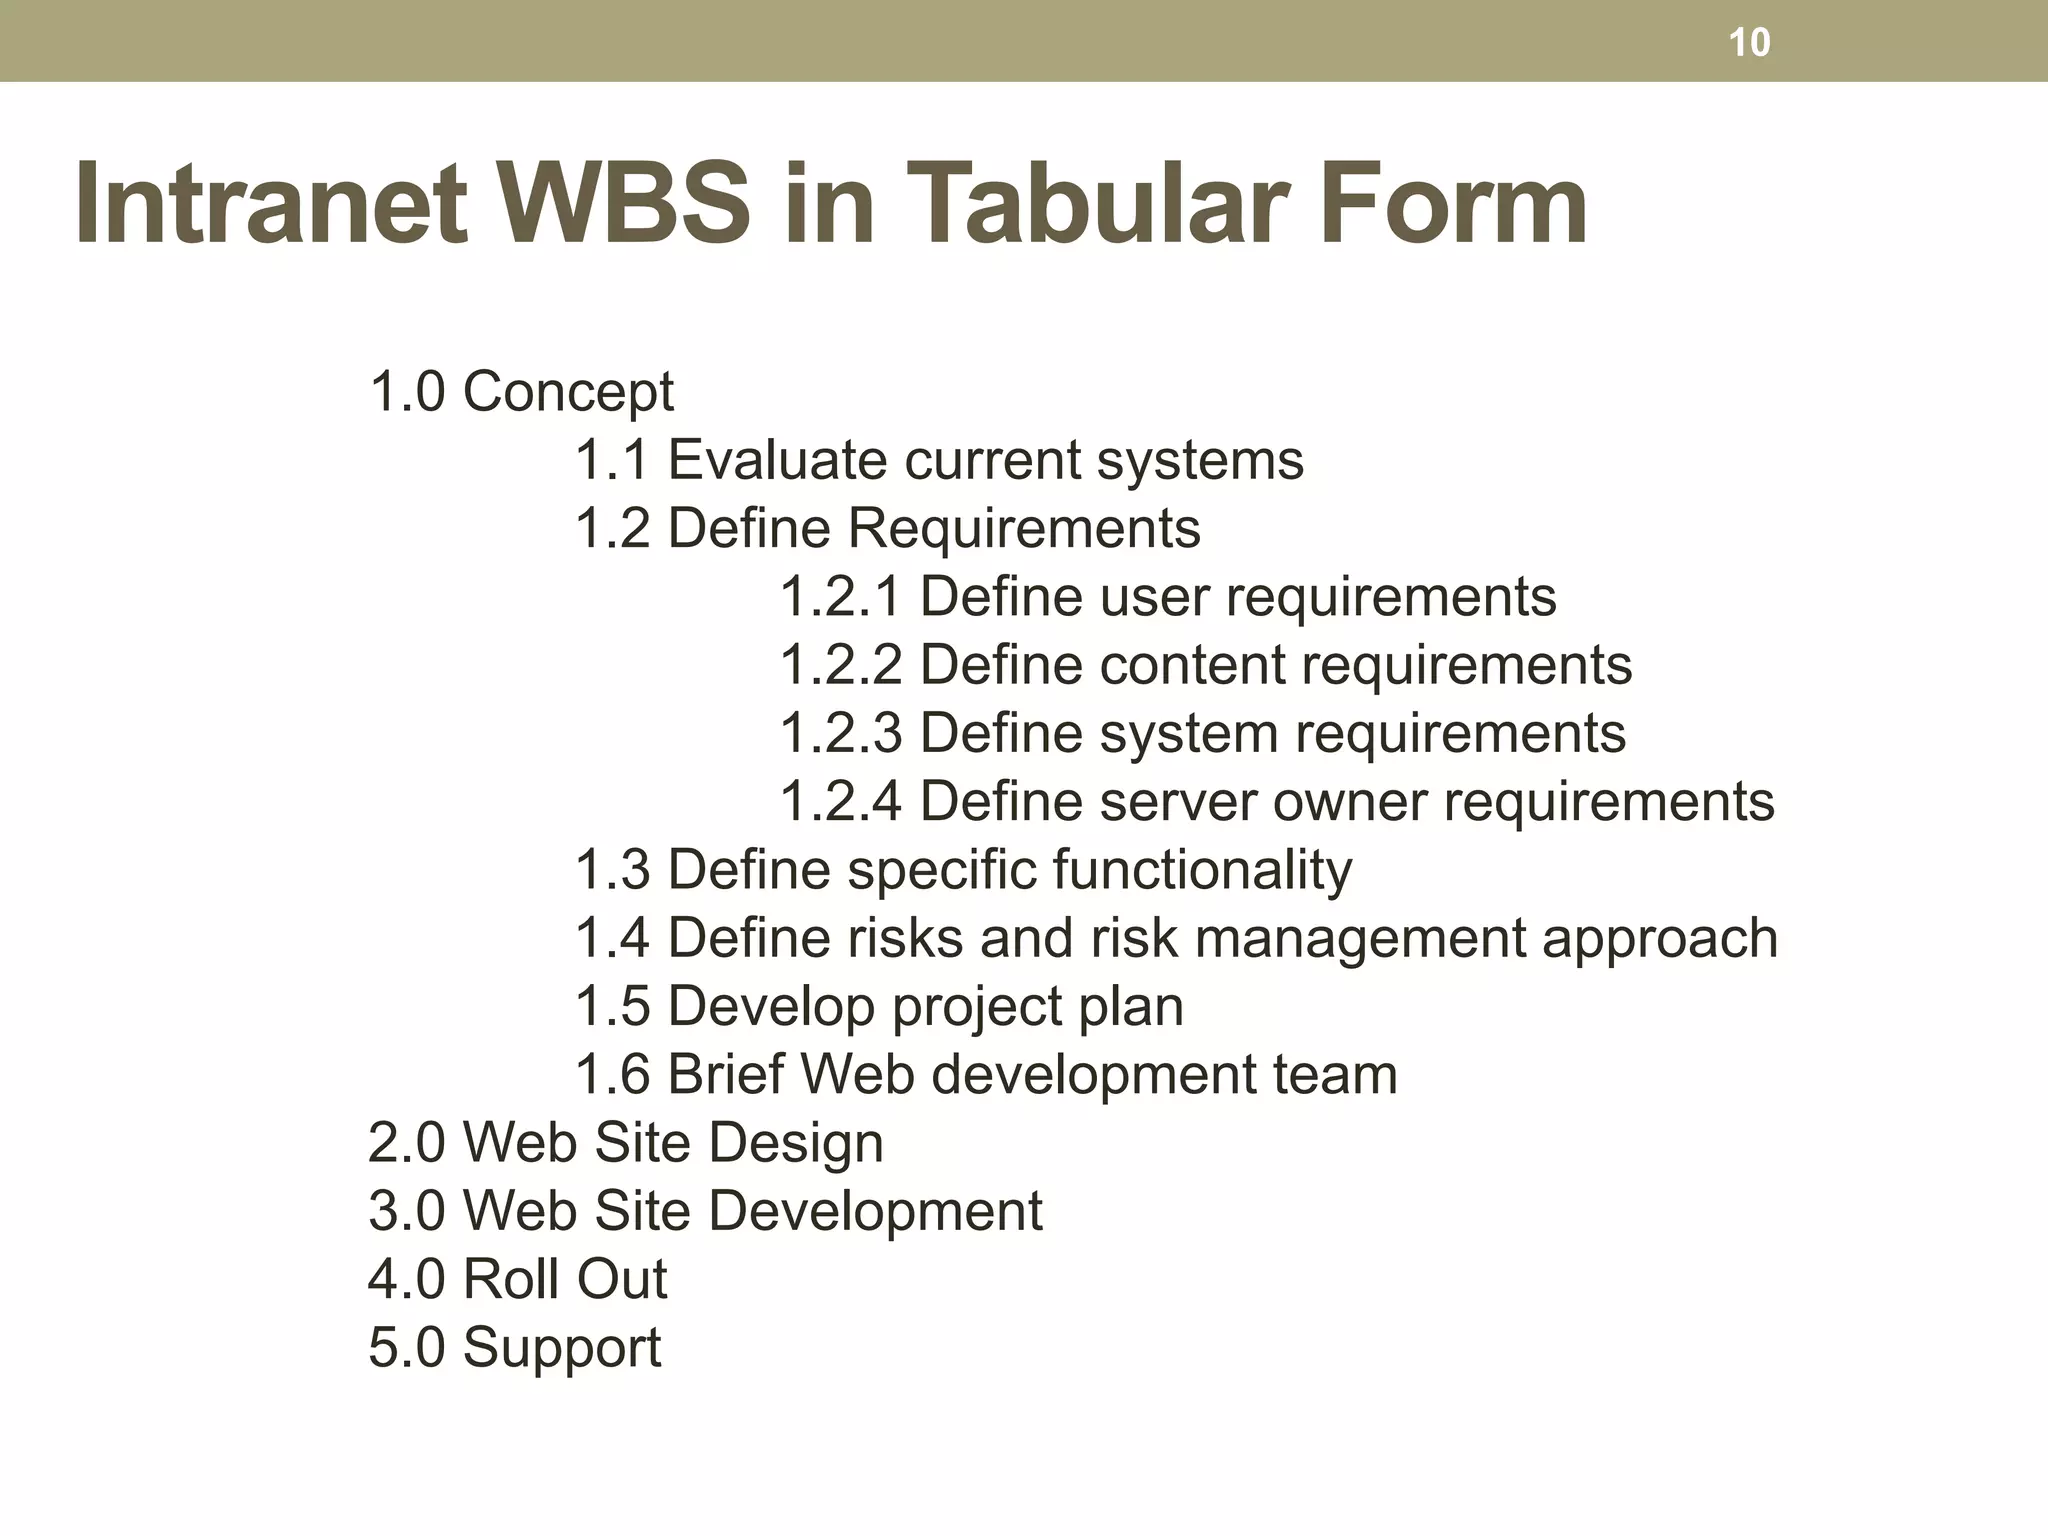
Intranet WBS inTabular Form
1.0 Concept
1.1 Evaluate current systems
1.2 Define Requirements
1.2.1 Define user requirements
1.2.2 Define content requirements
1.2.3 Define system requirements
1.2.4 Define server owner requirements
1.3 Define specific functionality
1.4 Define risks and risk management approach
1.5 Develop project plan
1.6 Brief Web development team
2.0 Web Site Design
3.0 Web Site Development
4.0 Roll Out
5.0 Support
10
Exercise: WBS
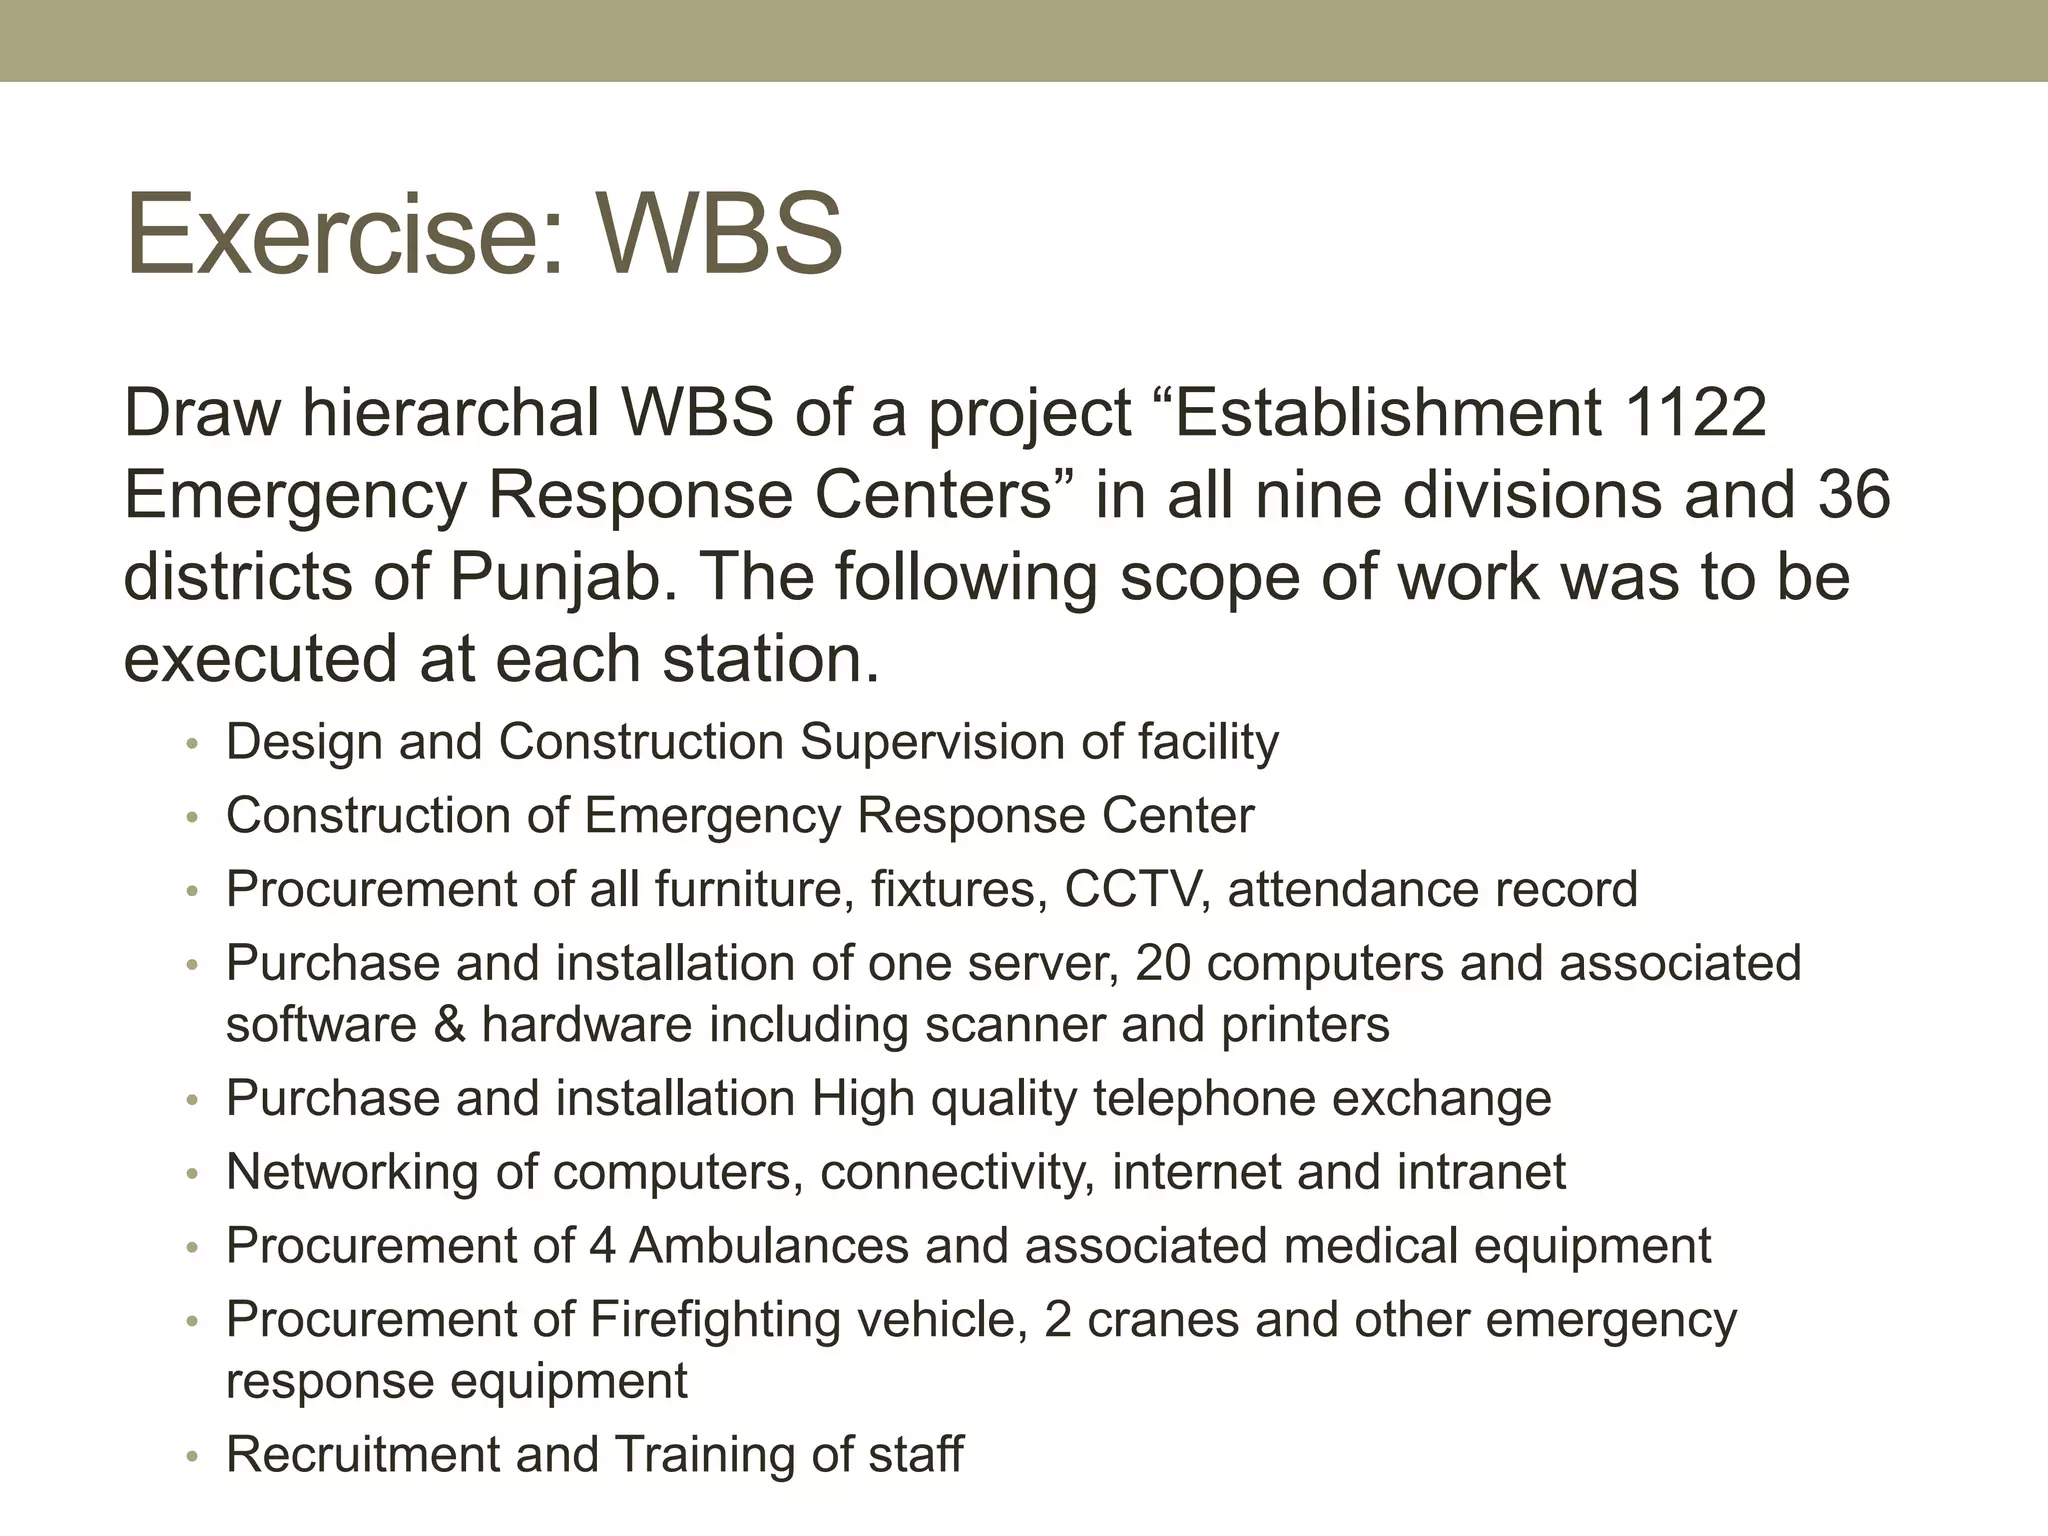
Draw hierarchalWBS of a project “Establishment 1122
Emergency Response Centers” in all nine divisions and 36
districts of Punjab. The following scope of work was to be
executed at each station.
• Design and Construction Supervision of facility
• Construction of Emergency Response Center
• Procurement of all furniture, fixtures, CCTV, attendance record
• Purchase and installation of one server, 20 computers and associated
software & hardware including scanner and printers
• Purchase and installation High quality telephone exchange
• Networking of computers, connectivity, internet and intranet
• Procurement of 4 Ambulances and associated medical equipment
• Procurement of Firefighting vehicle, 2 cranes and other emergency
response equipment
• Recruitment and Training of staff
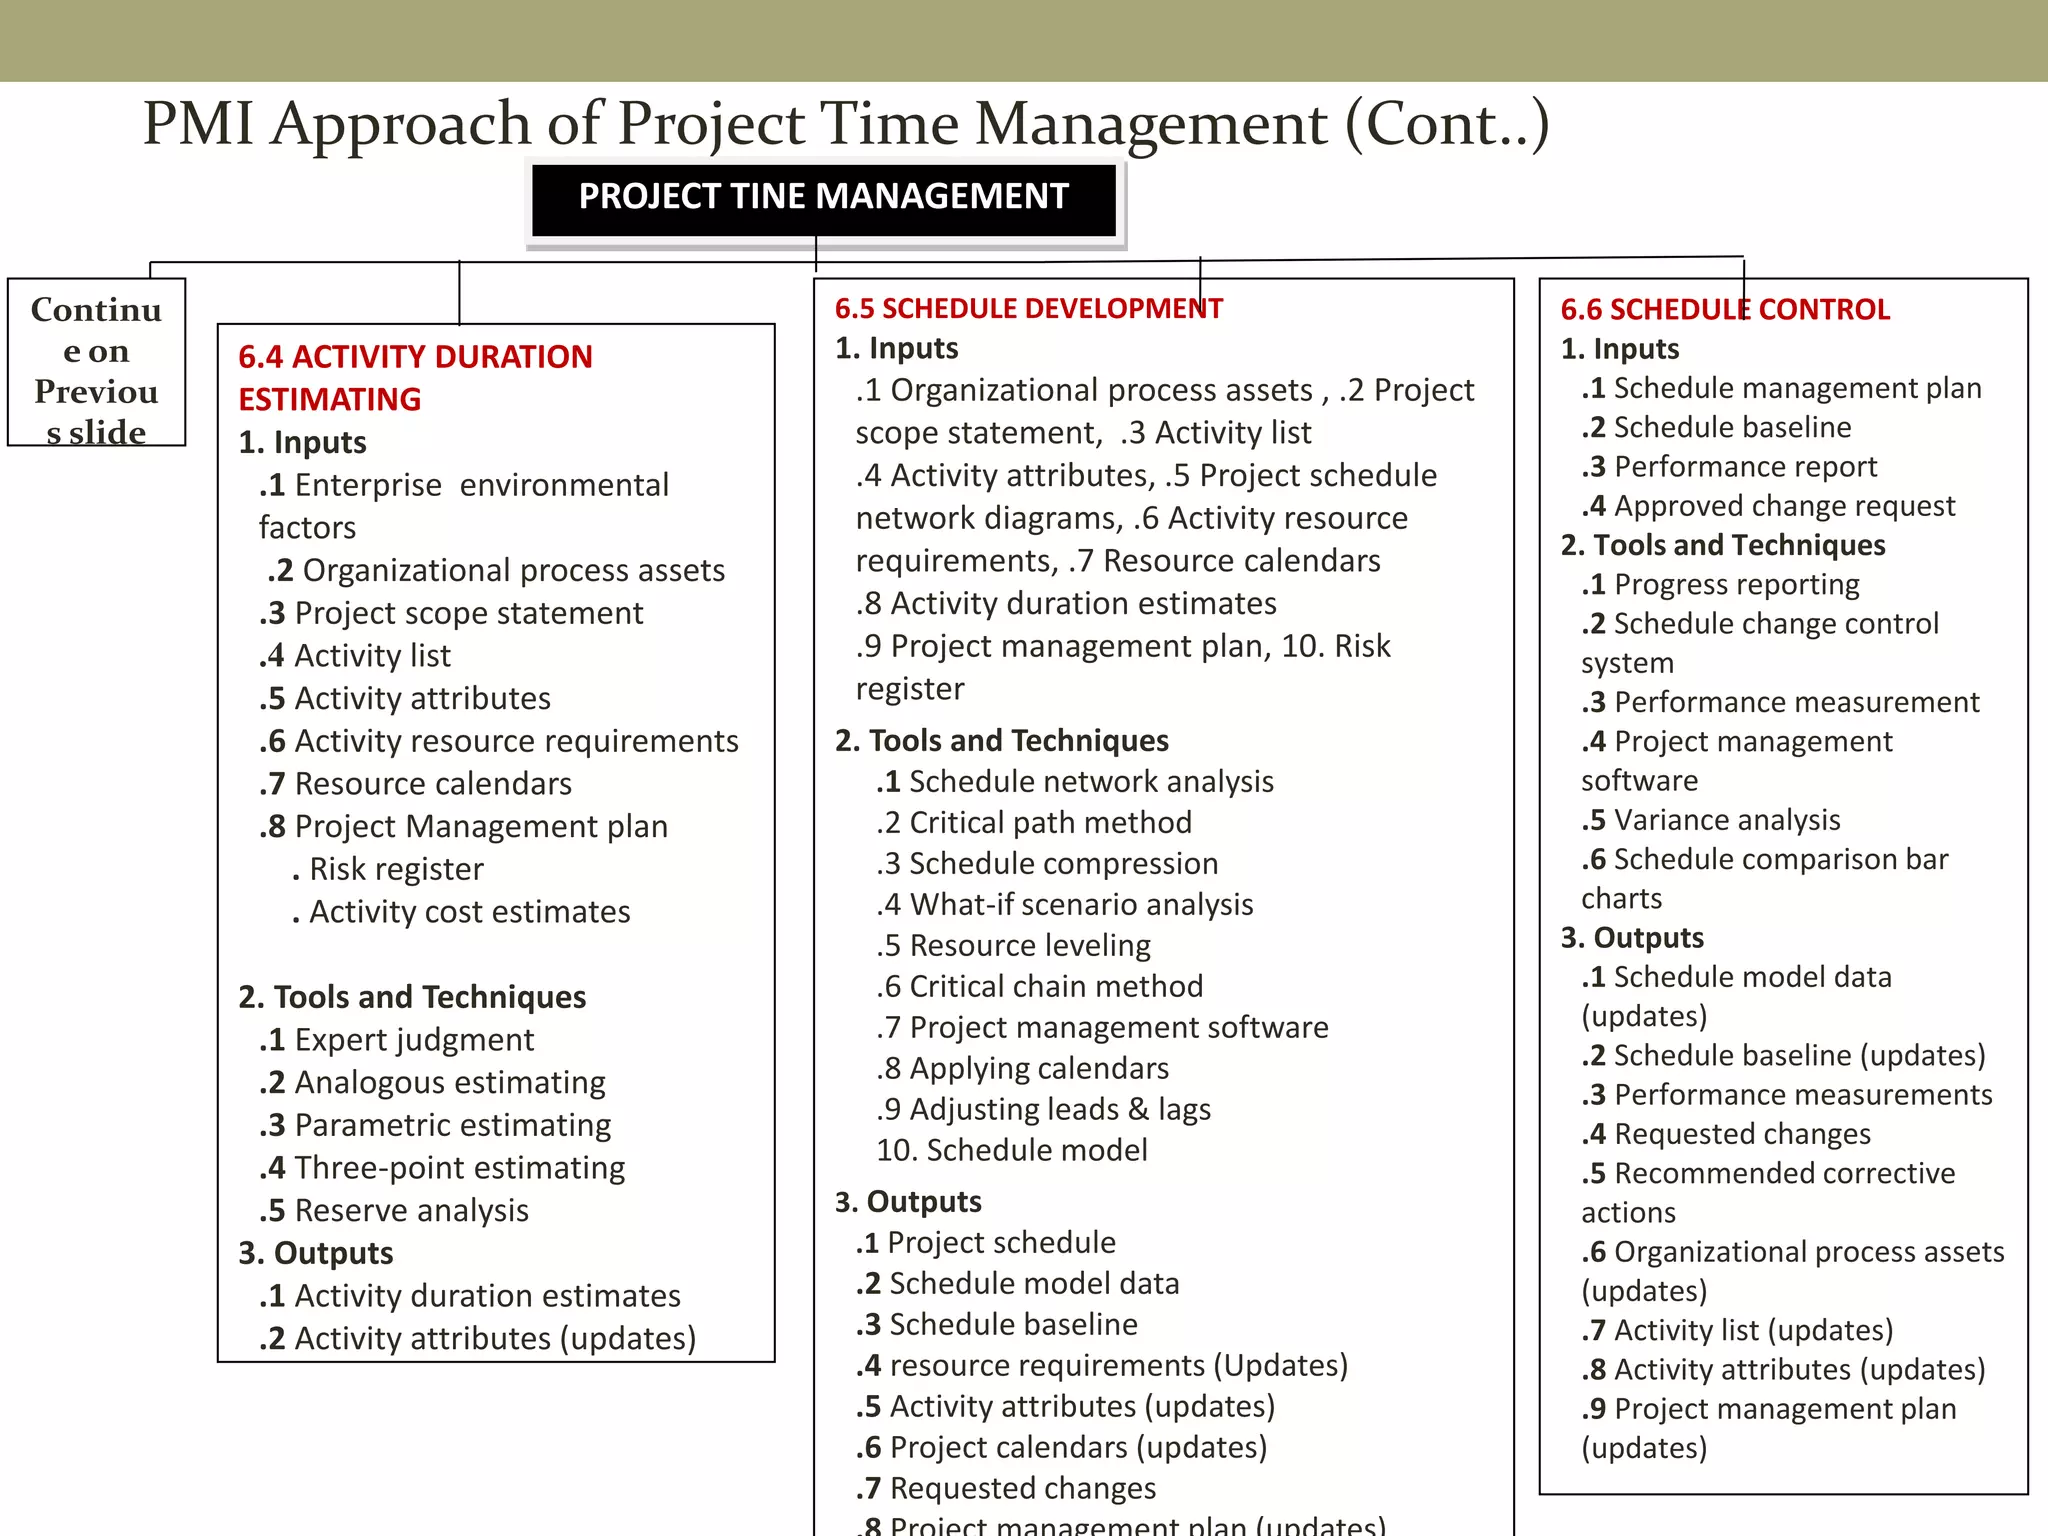
PROJECT SCHEDULING
• ProjectPlanning:
Process of identifying all the activities necessary to successfully
complete the project is called project planning.
• Project Scheduling:
Process of determining sequential order of planned activities,
assigning realistic duration, to each activity and determining start
and finish dates of each activity is called project scheduling.
Project planning is prerequisite to project scheduling because there
is no way to determine the sequential order of activities until they
are identified. However, the terms planning and scheduling are often
used synonymously because they are performed interactively. E.g.
when some schedule is reviewed, it may be decided that additional
activities may be added or rearranged in order to get the best
schedule of events of projects.
20.
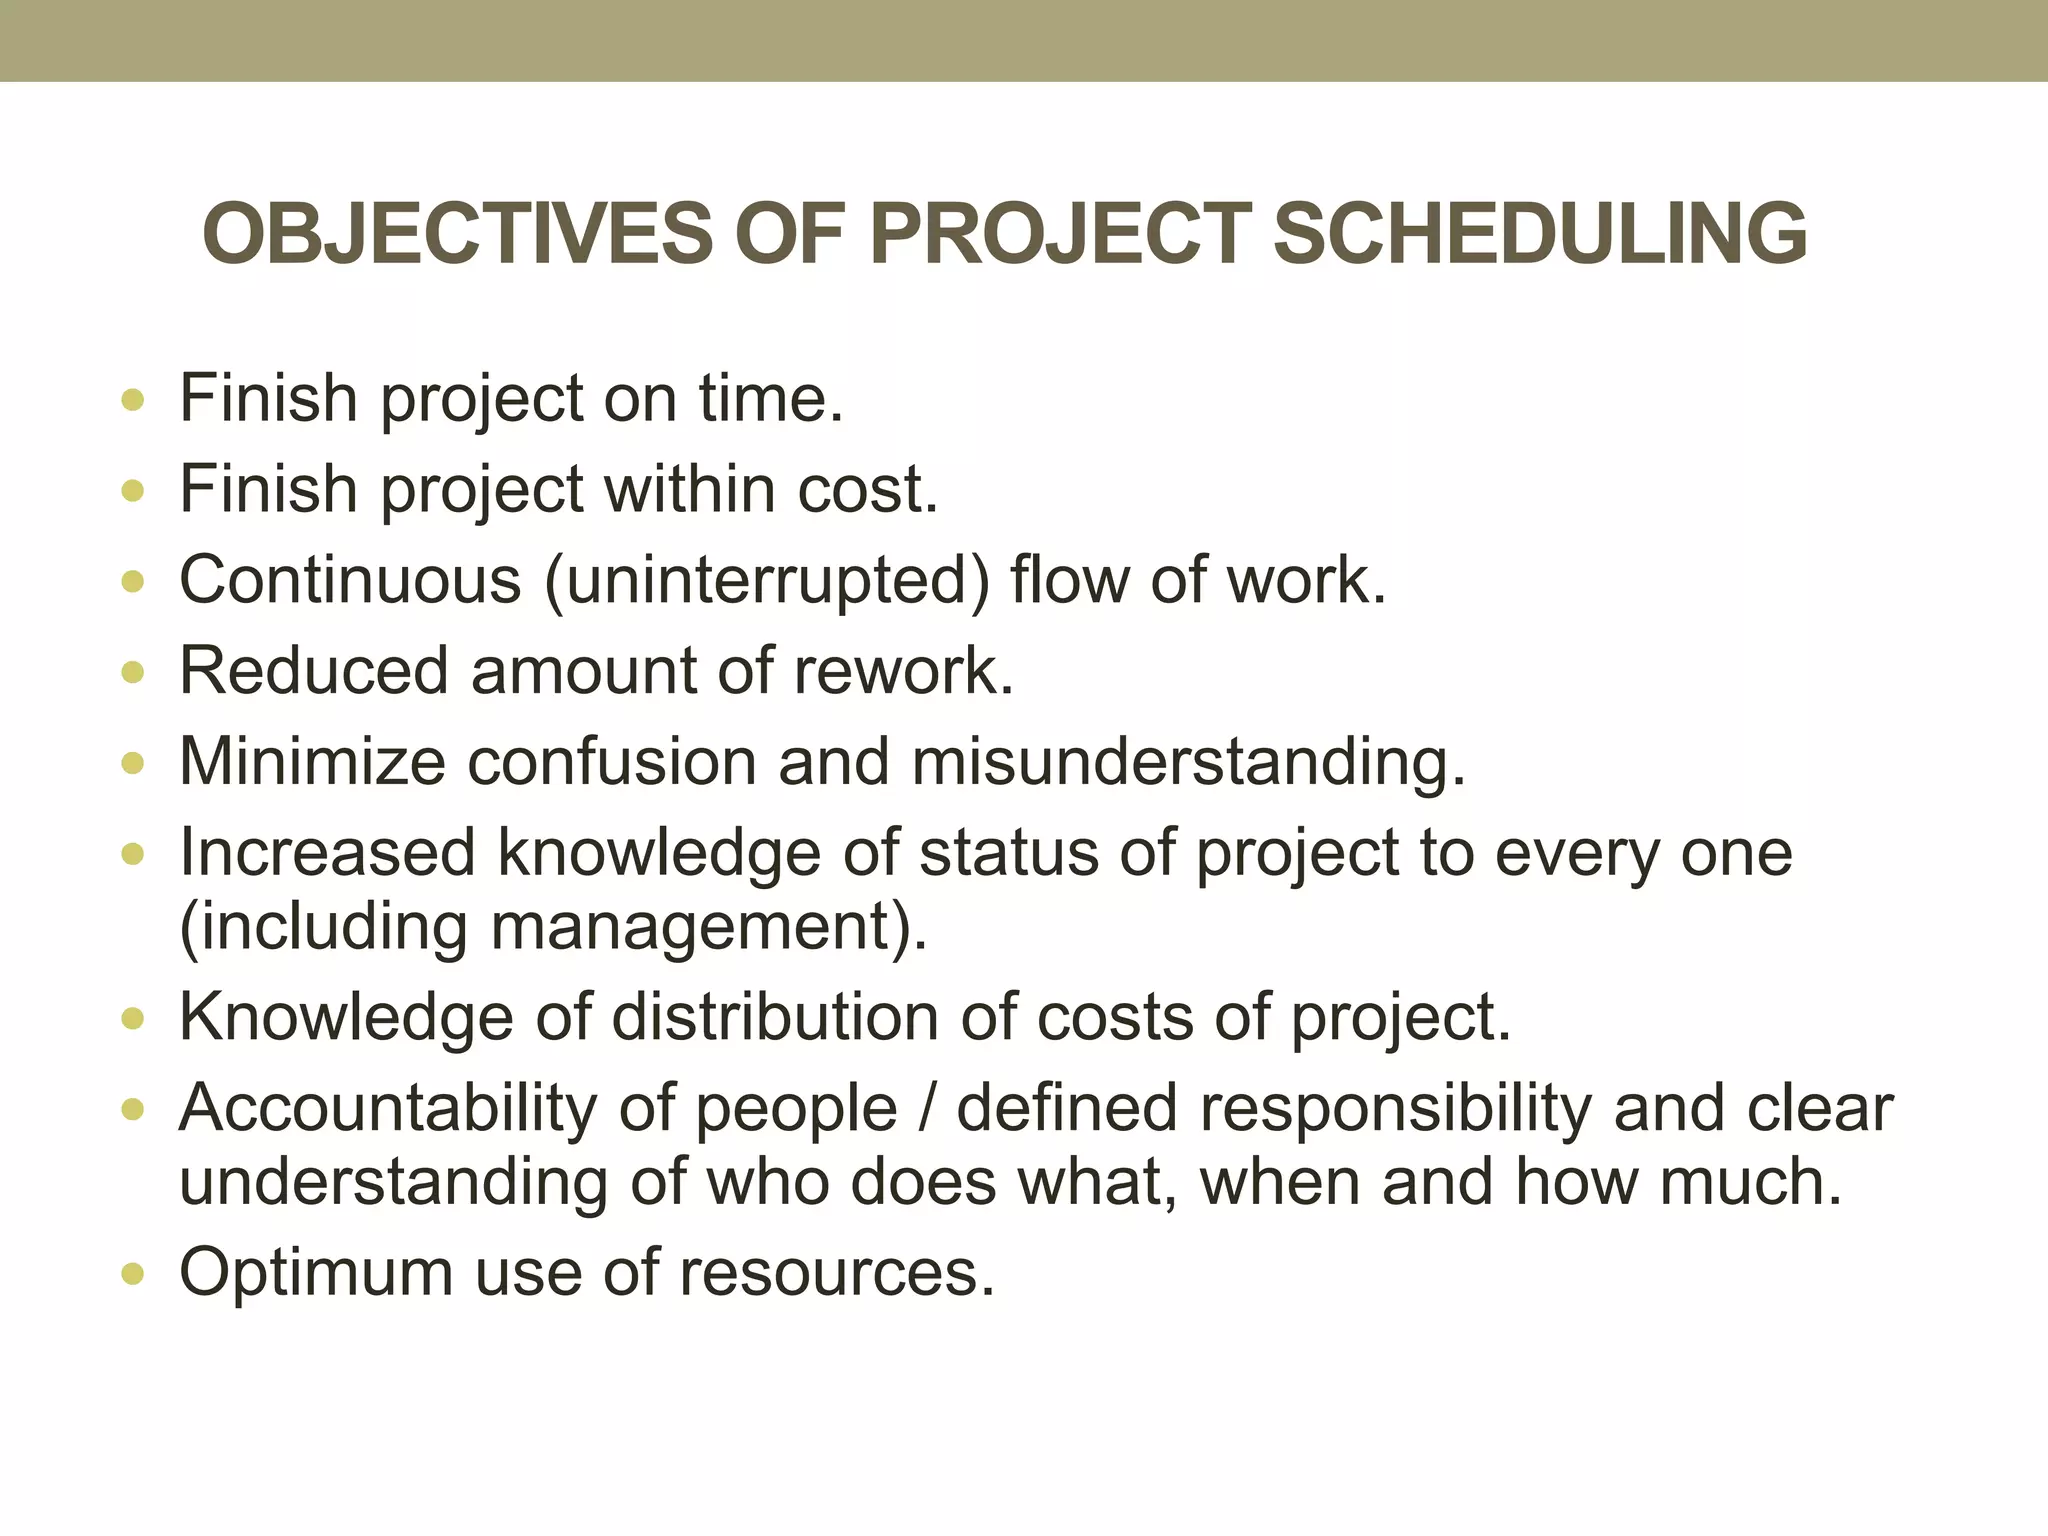
OBJECTIVES OF PROJECTSCHEDULING
Finish project on time.
Finish project within cost.
Continuous (uninterrupted) flow of work.
Reduced amount of rework.
Minimize confusion and misunderstanding.
Increased knowledge of status of project to every one
(including management).
Knowledge of distribution of costs of project.
Accountability of people / defined responsibility and clear
understanding of who does what, when and how much.
Optimum use of resources.
21.
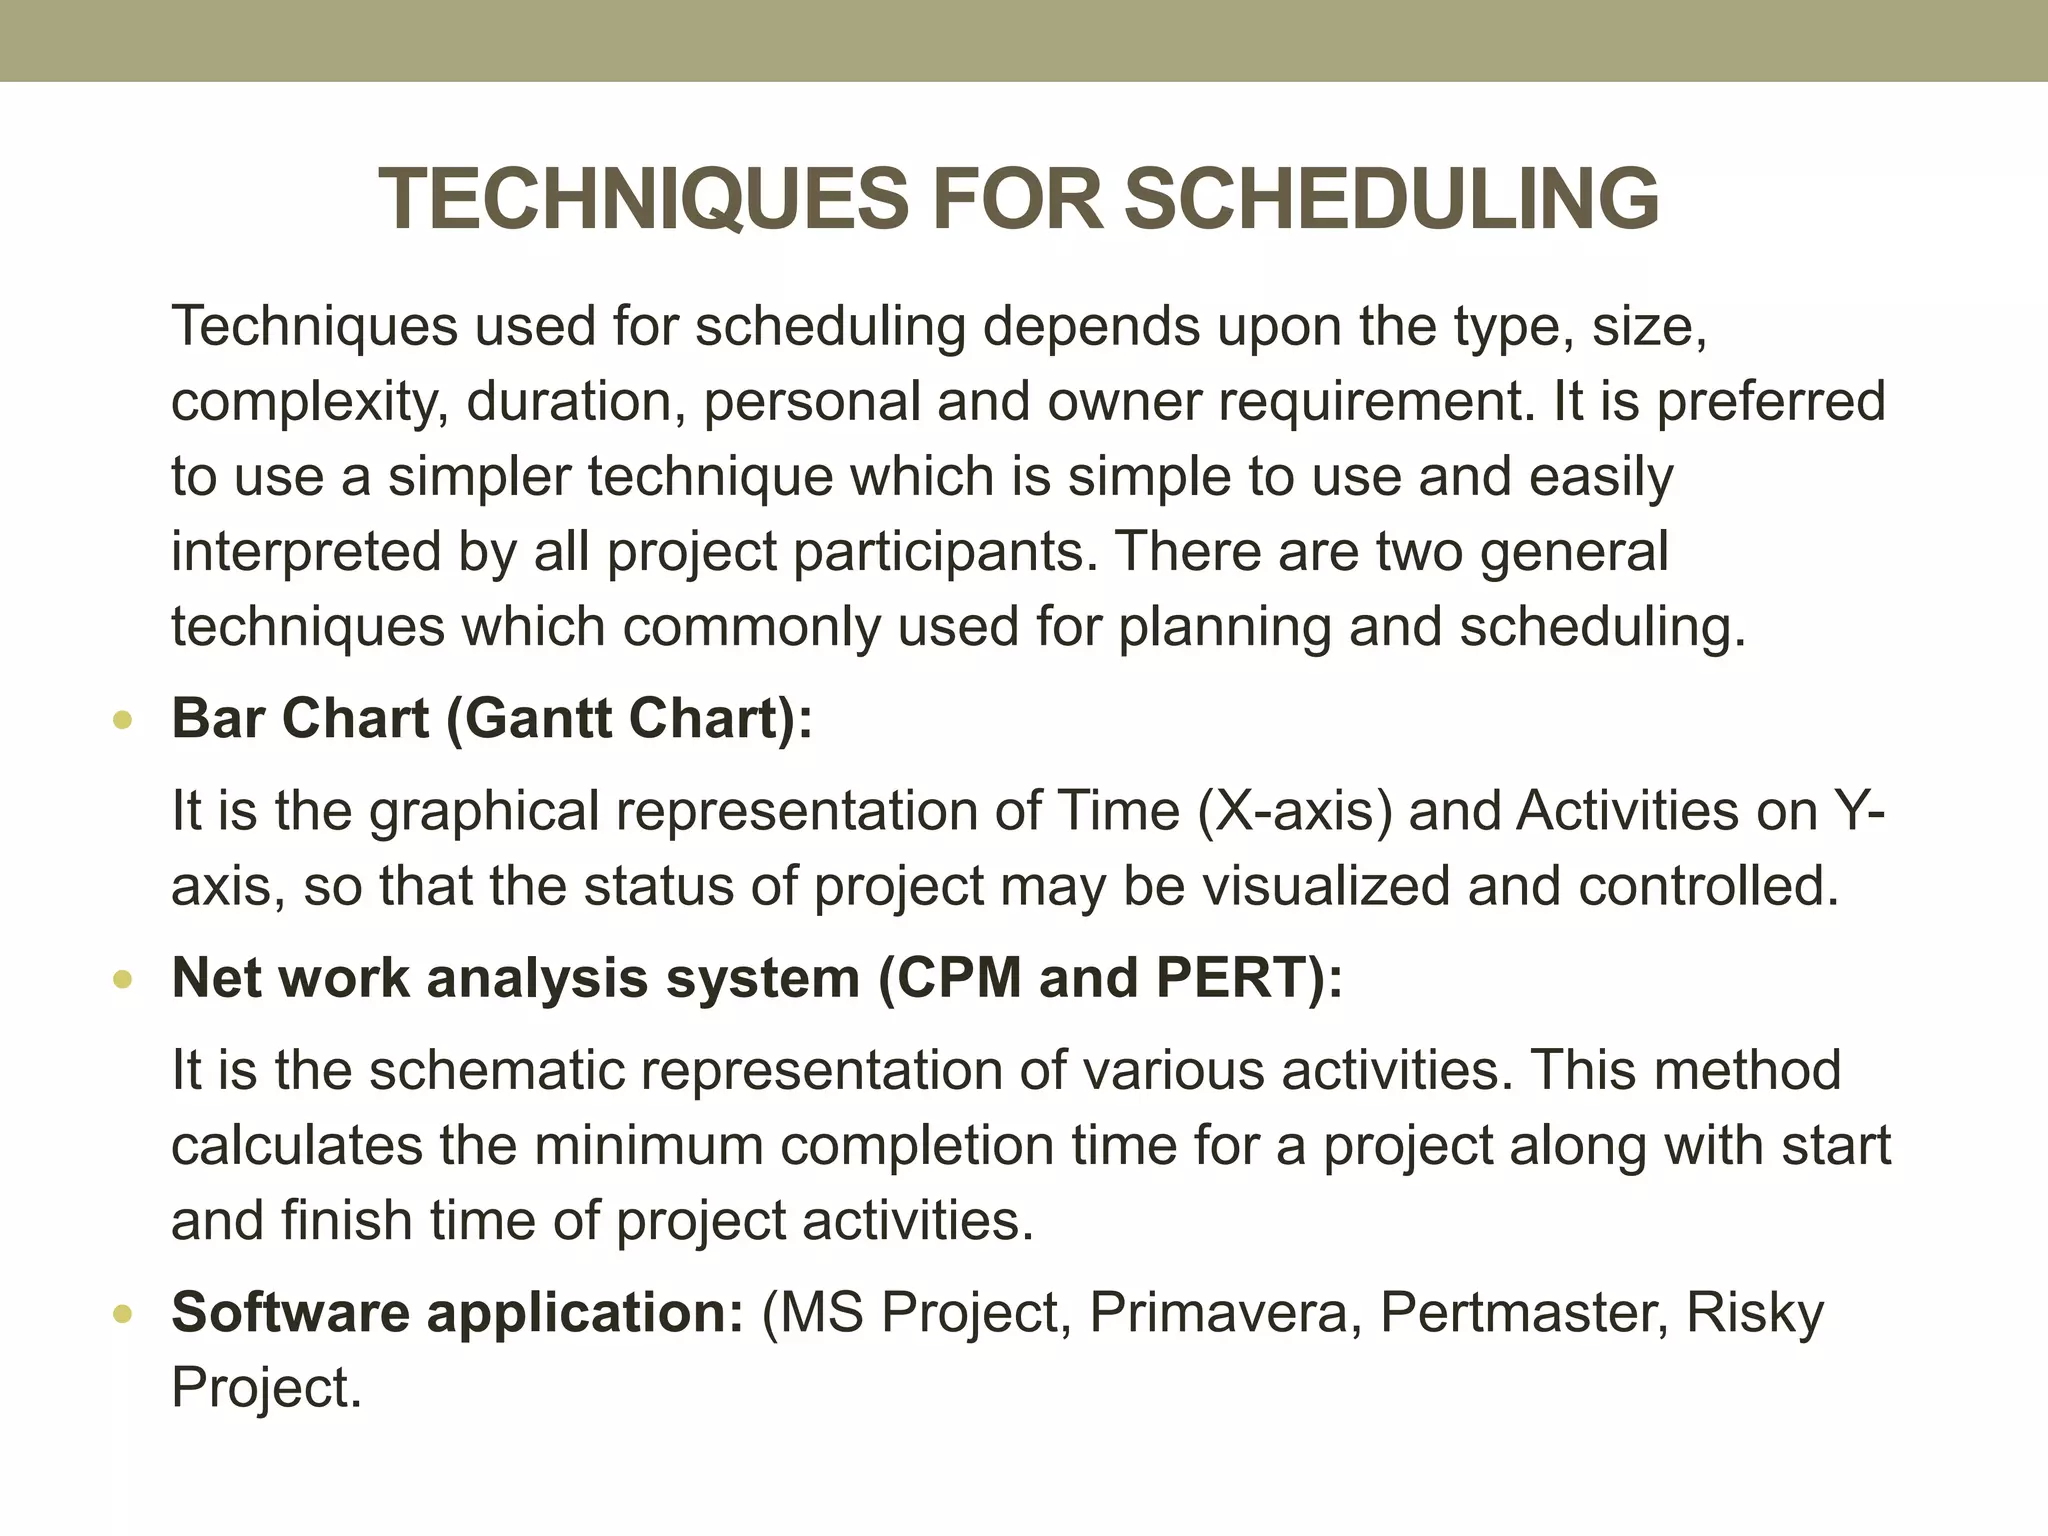
TECHNIQUES FOR SCHEDULING
Techniquesused for scheduling depends upon the type, size,
complexity, duration, personal and owner requirement. It is preferred
to use a simpler technique which is simple to use and easily
interpreted by all project participants. There are two general
techniques which commonly used for planning and scheduling.
Bar Chart (Gantt Chart):
It is the graphical representation of Time (X-axis) and Activities on Y-
axis, so that the status of project may be visualized and controlled.
Net work analysis system (CPM and PERT):
It is the schematic representation of various activities. This method
calculates the minimum completion time for a project along with start
and finish time of project activities.
Software application: (MS Project, Primavera, Pertmaster, Risky
Project.
22.
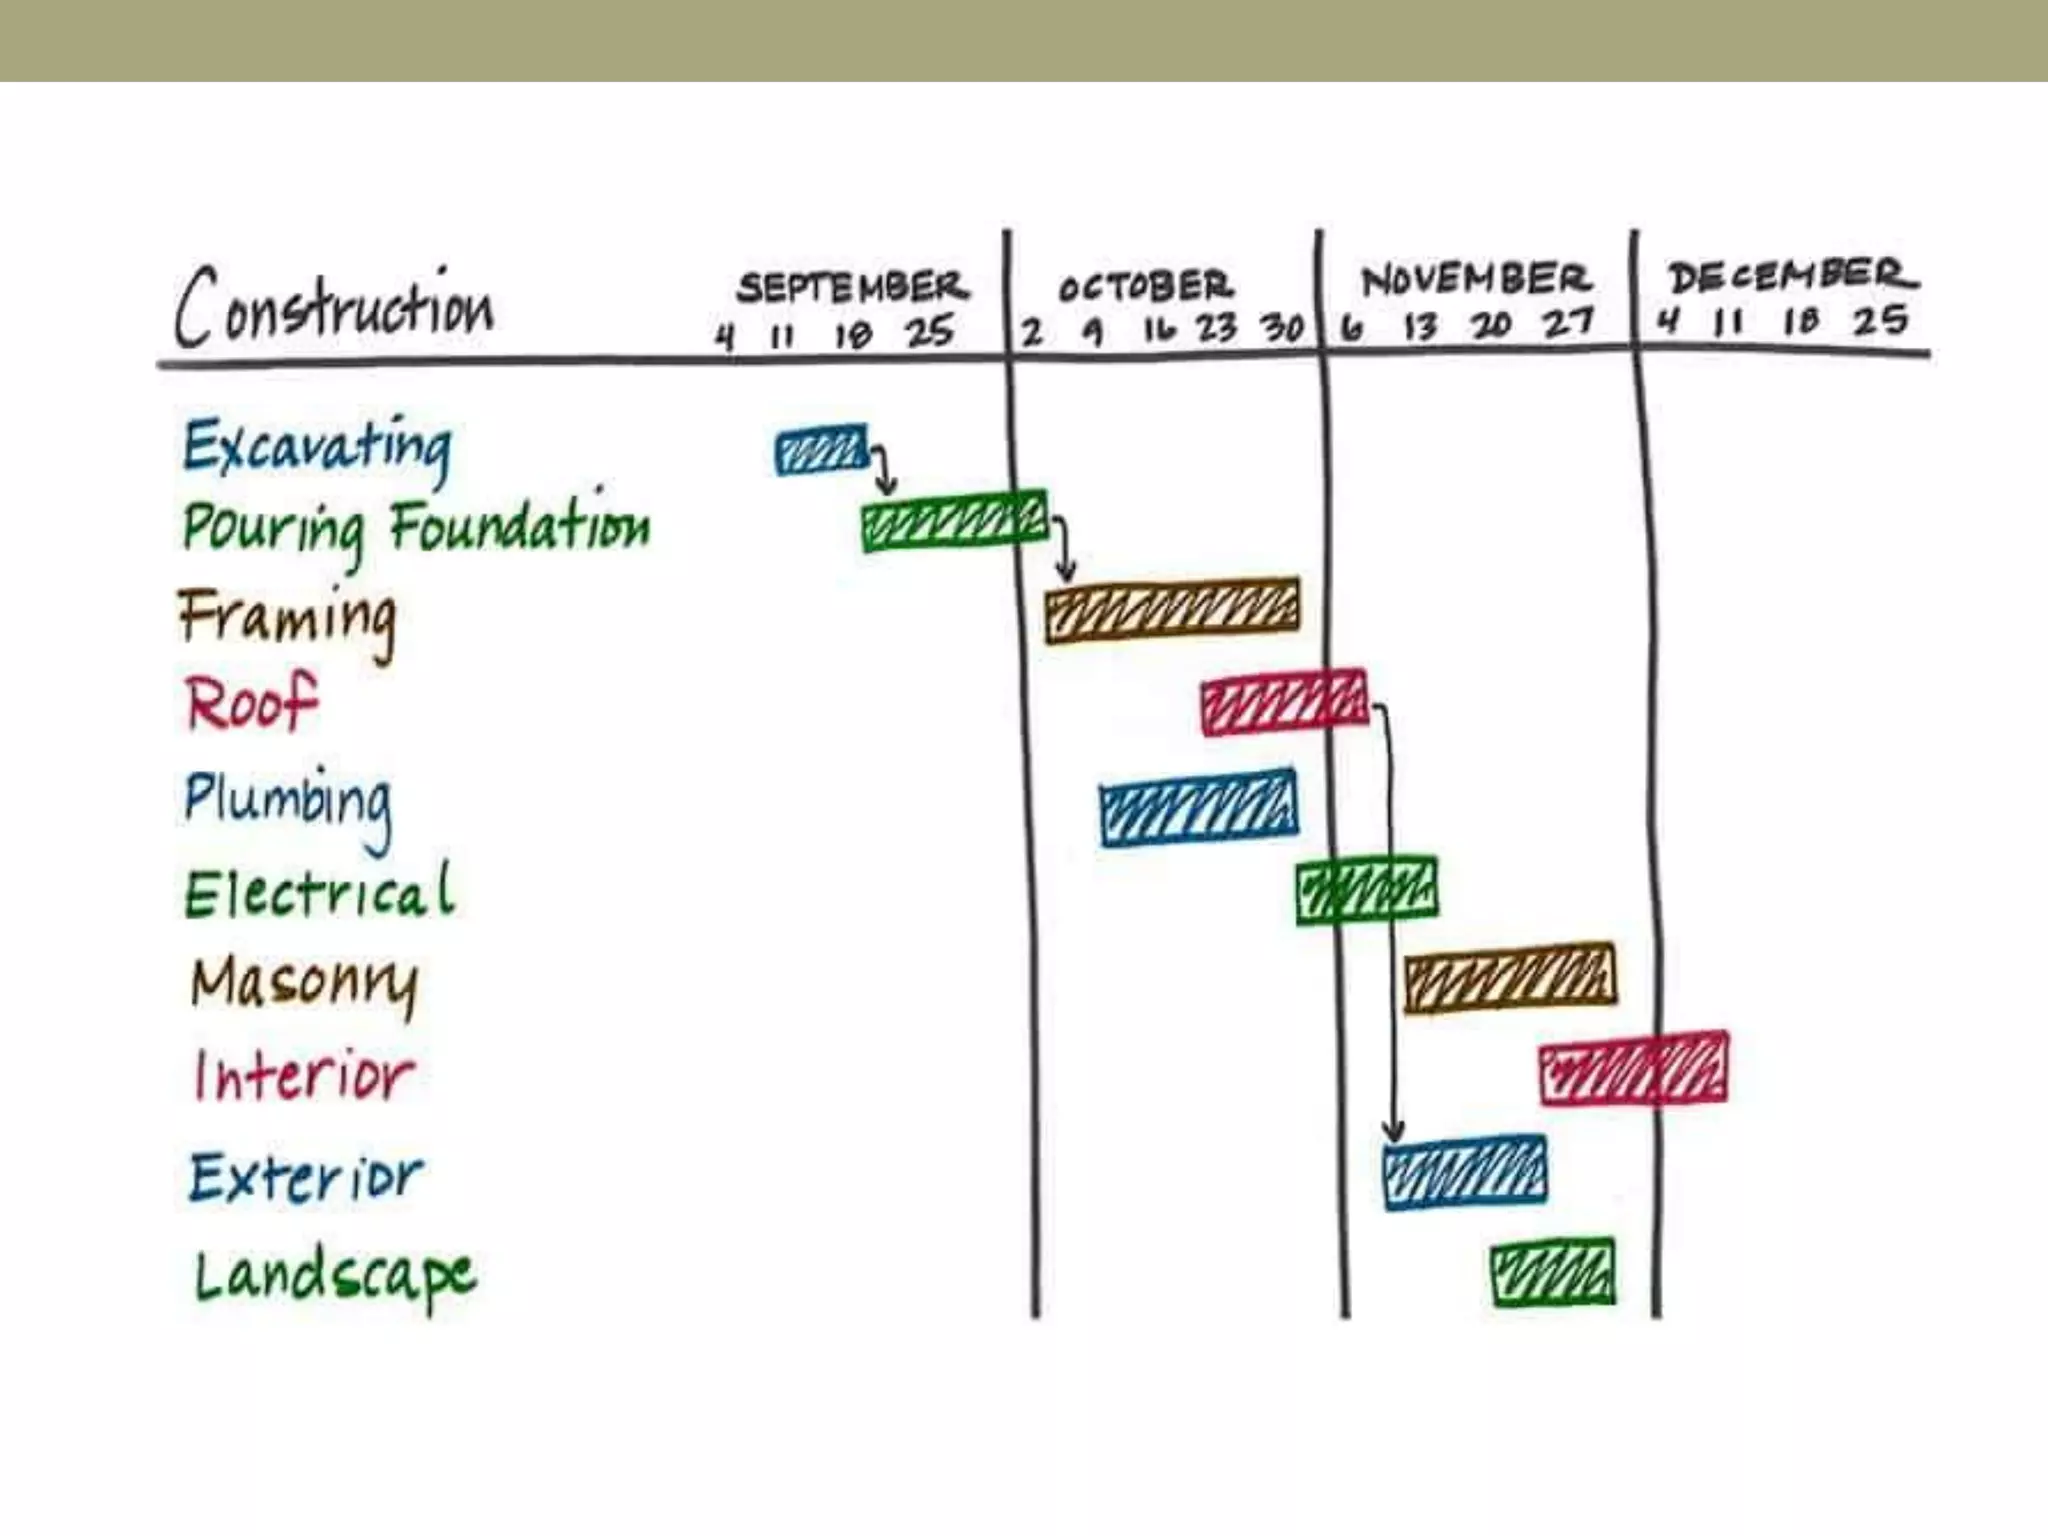
BAR CHART
BarChart was developed by Henery L. Gantt in 1917, which is the most
common planning tool even today, which provided basis for developing
planning and scheduling software.
Bar Charts are the easiest and most widely used form of scheduling in
project management. Even with other scheduling techniques, the eventual
schedule is presented the form of a bar chart. The level of detail of the
activities depends on the intended use of the schedule. The most
commonly used bar chart for engineering works is called Gantt chart.
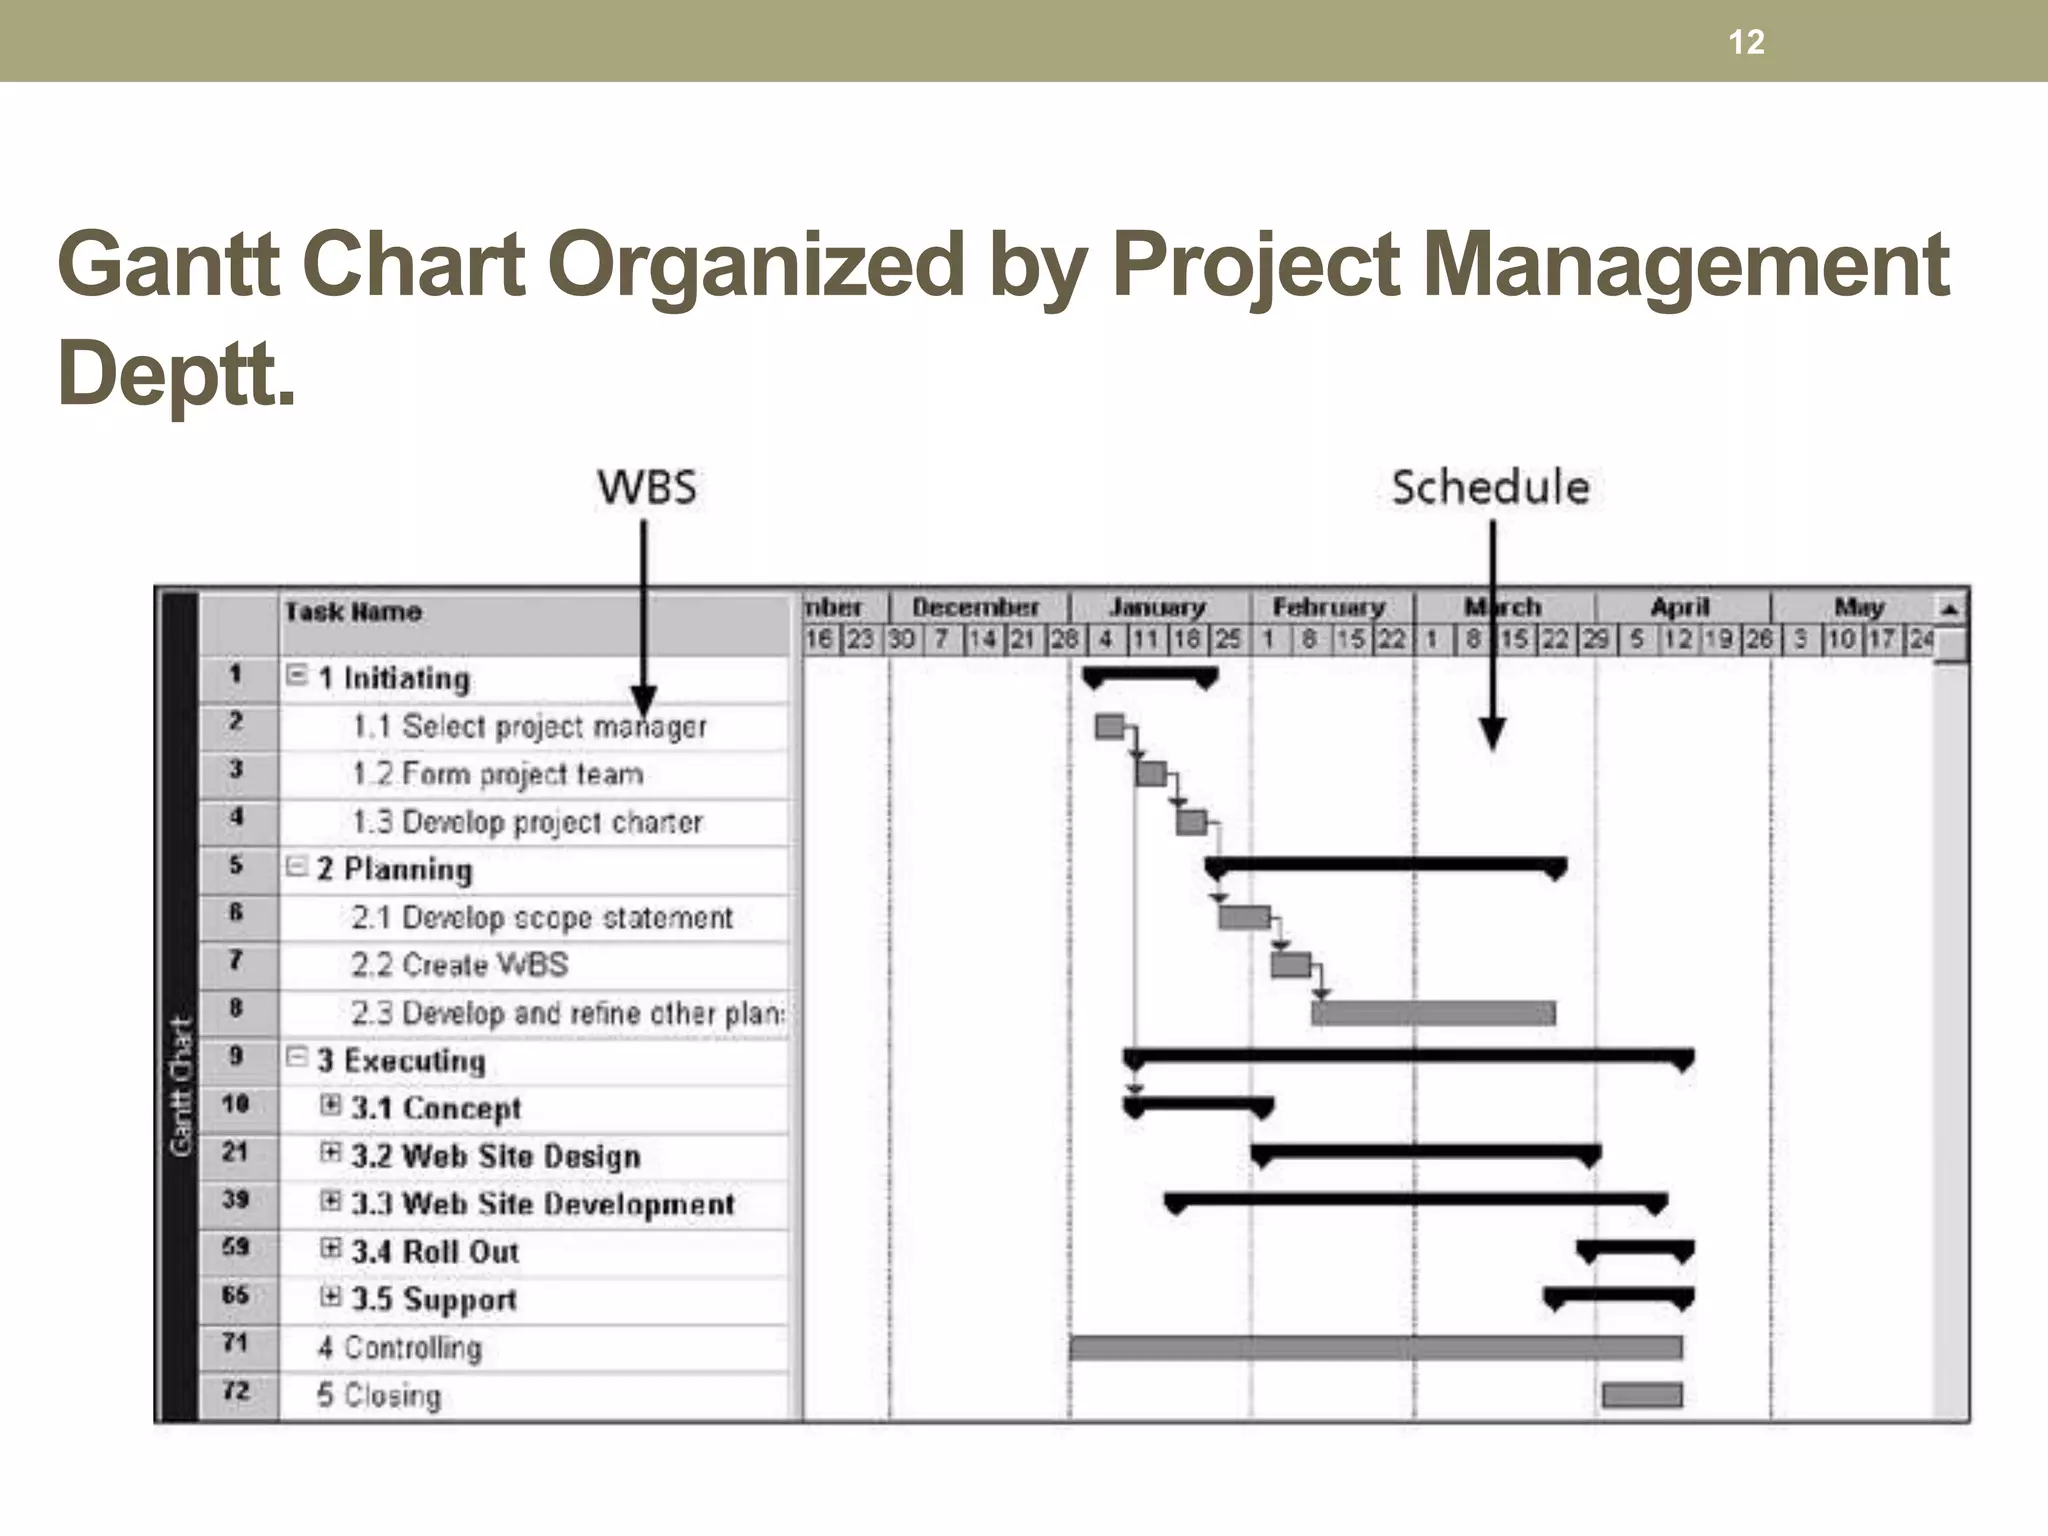
A Gantt chart is a type of bar chart that illustrates a project schedule, start
and finish dates of the terminal elements and summary elements of civil
engineering project. Terminal elements and summary elements comprise
the work breakdown structure of the project. Some Gantt charts also show
the dependency (i.e. precedence network) relationships between activities.
Gantt charts can be used to show current schedule status using percent-
complete shadings.
Gantt charts have become a common technique for representing the
phases and activities of a project work breakdown (WBS), so they can be
understood by a wide audience all over the world.
24.
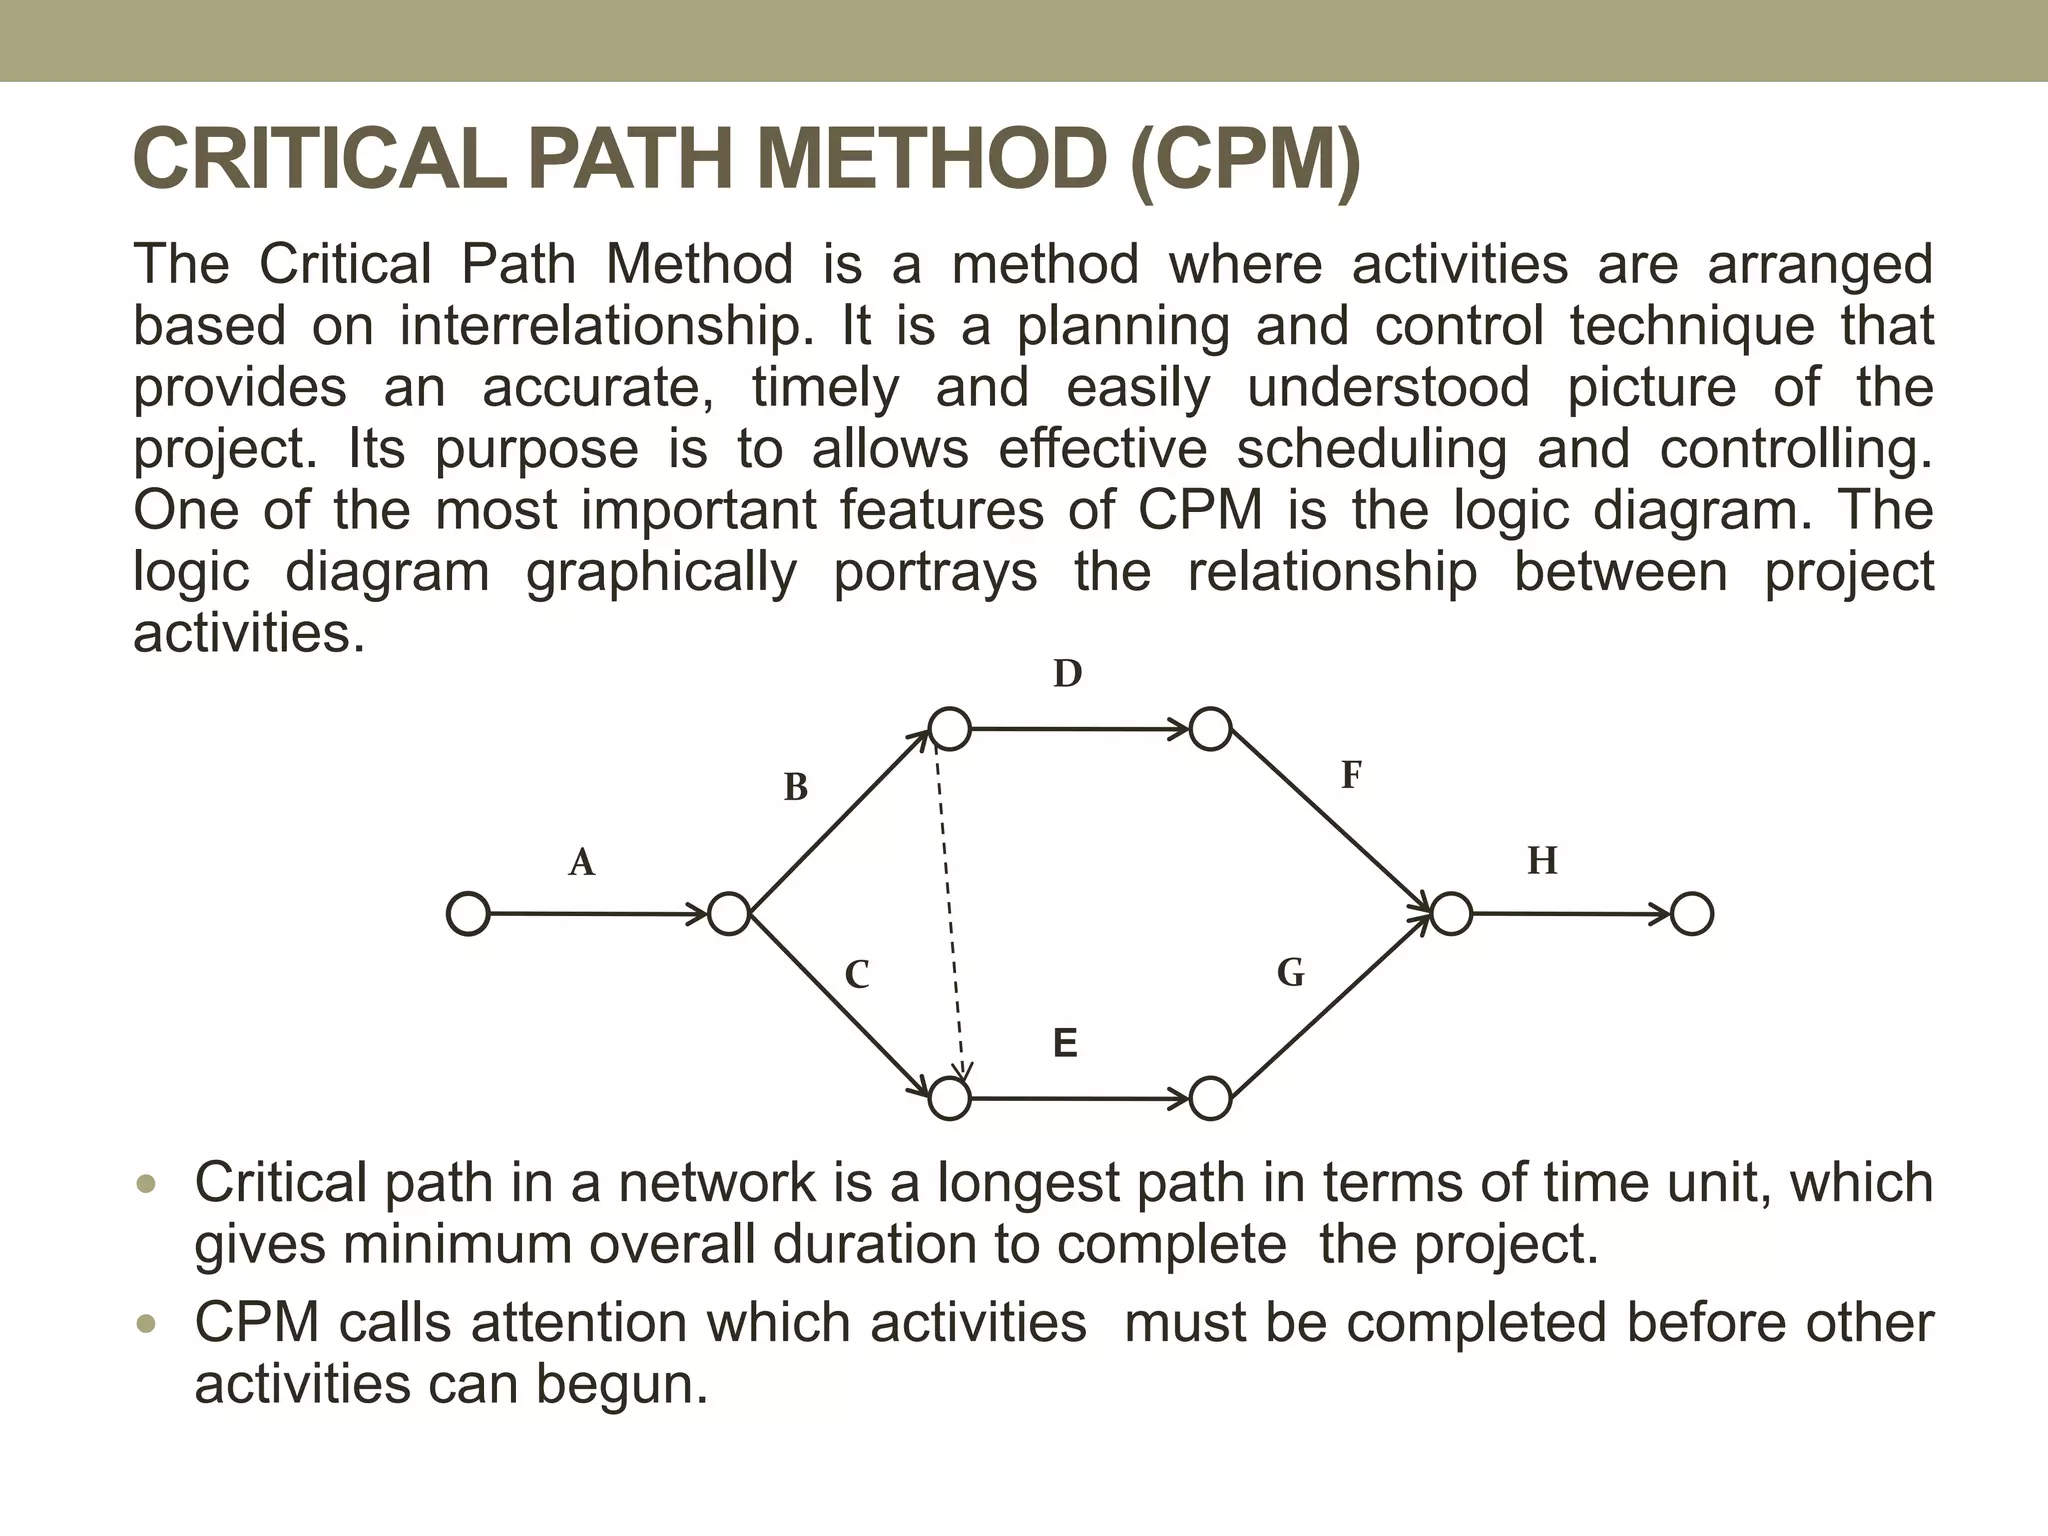
CRITICAL PATH METHOD(CPM)
The Critical Path Method is a method where activities are arranged
based on interrelationship. It is a planning and control technique that
provides an accurate, timely and easily understood picture of the
project. Its purpose is to allows effective scheduling and controlling.
One of the most important features of CPM is the logic diagram. The
logic diagram graphically portrays the relationship between project
activities.
Critical path in a network is a longest path in terms of time unit, which
gives minimum overall duration to complete the project.
CPM calls attention which activities must be completed before other
activities can begun.
A
B
D
F
G
E
C
H
25.
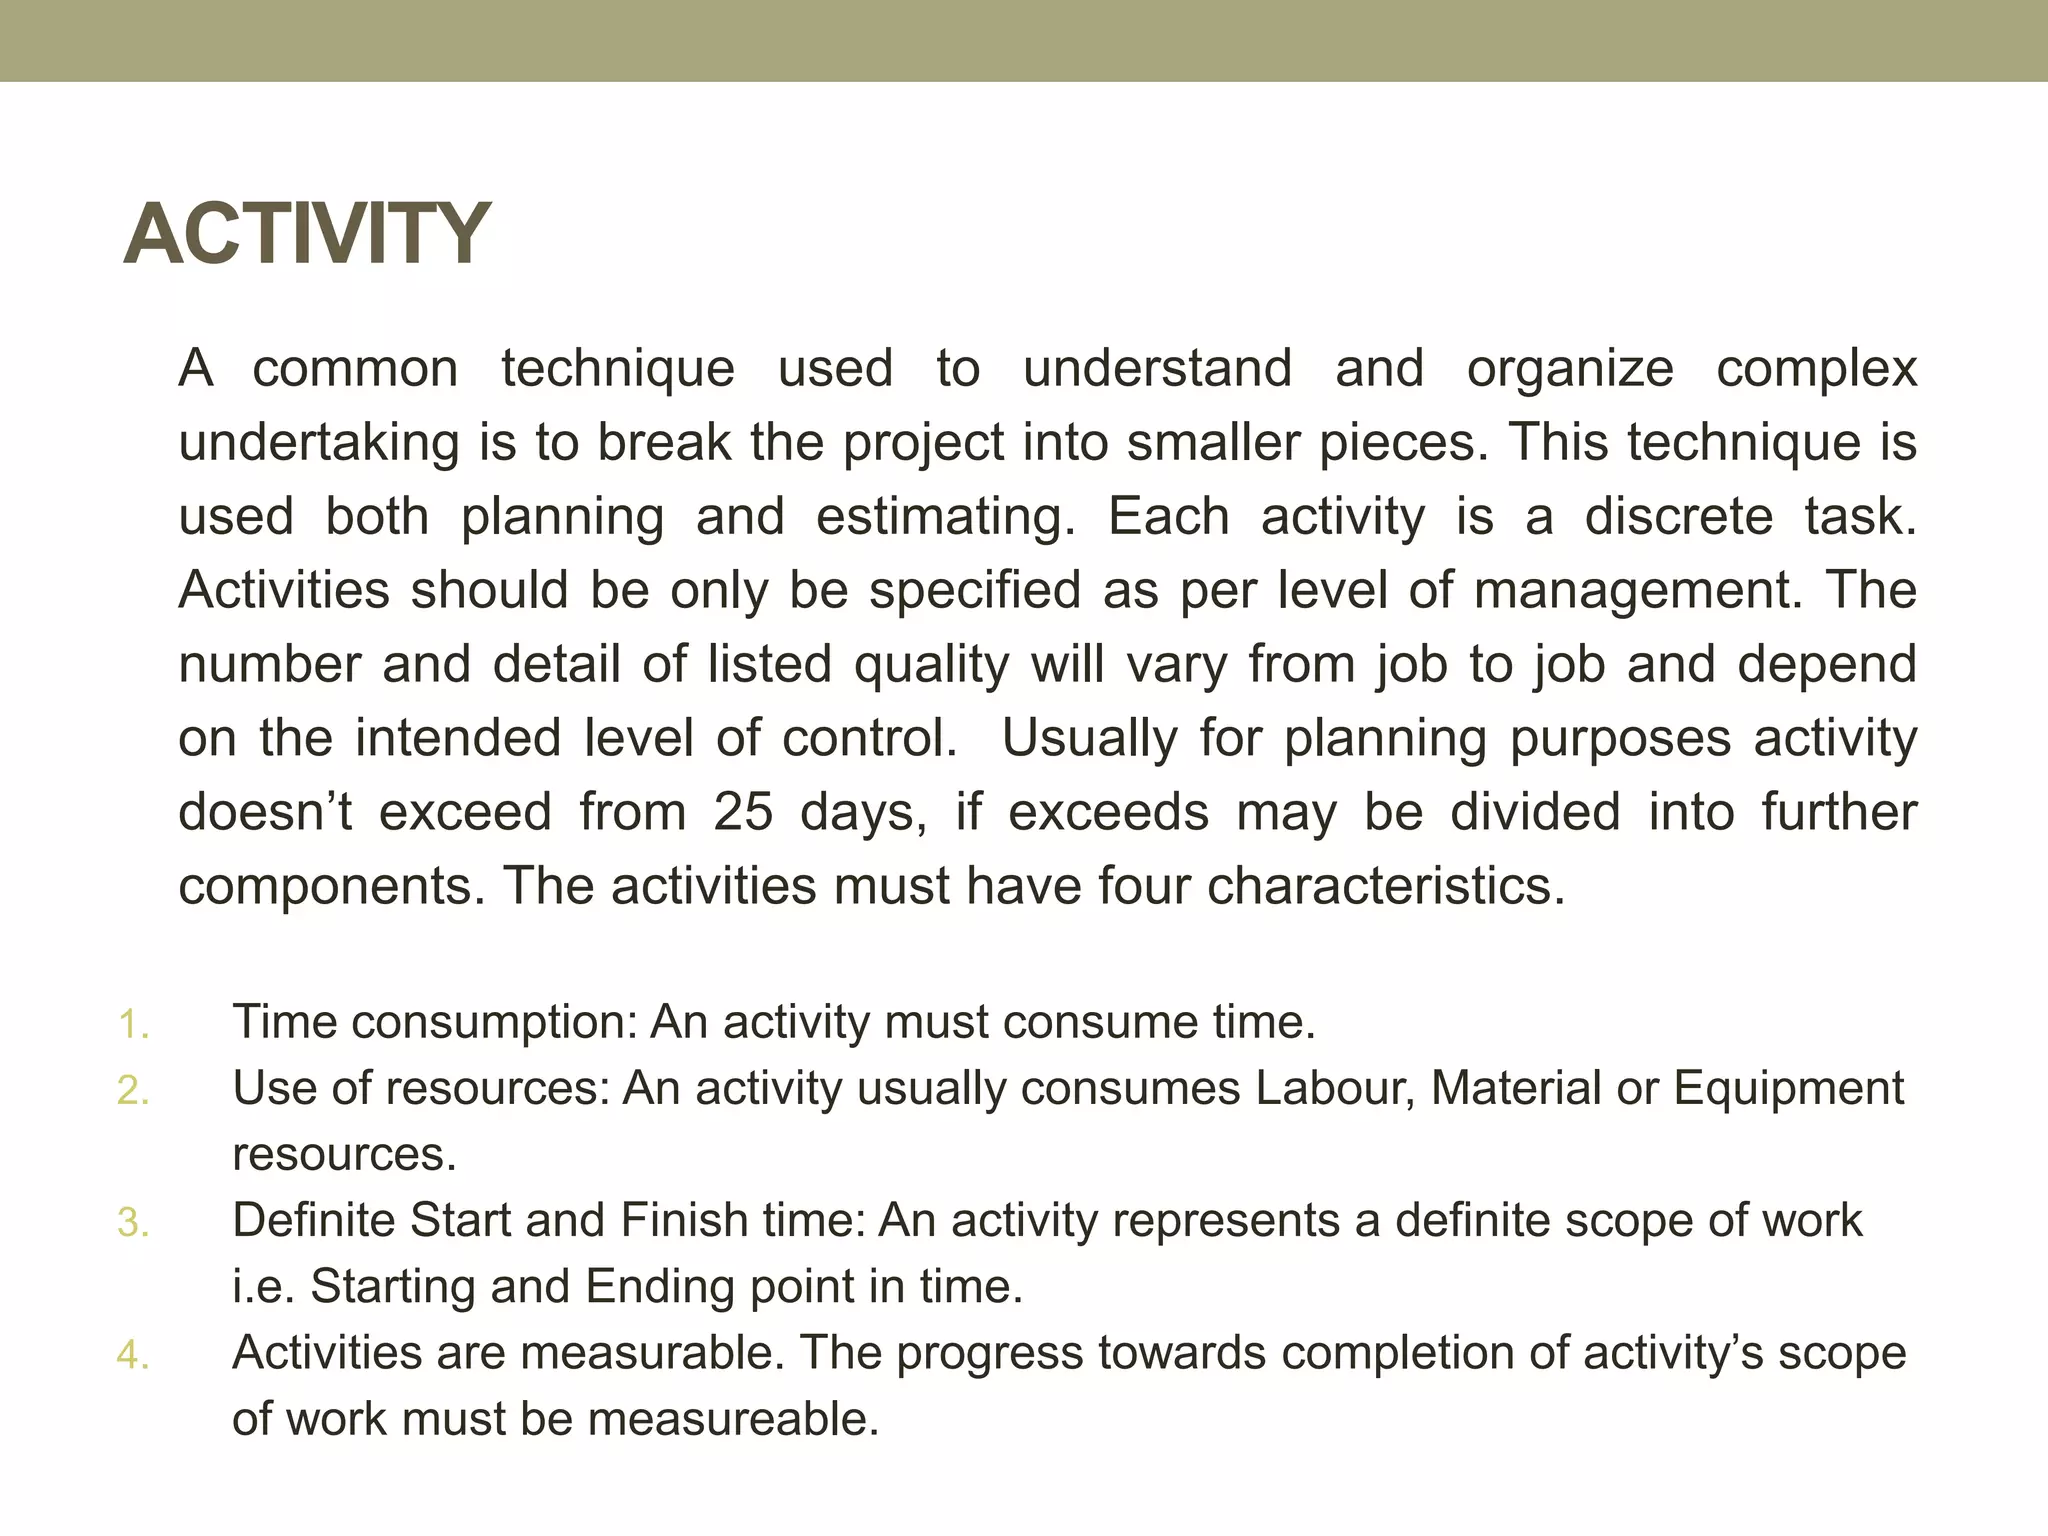
ACTIVITY
A common techniqueused to understand and organize complex
undertaking is to break the project into smaller pieces. This technique is
used both planning and estimating. Each activity is a discrete task.
Activities should be only be specified as per level of management. The
number and detail of listed quality will vary from job to job and depend
on the intended level of control. Usually for planning purposes activity
doesn’t exceed from 25 days, if exceeds may be divided into further
components. The activities must have four characteristics.
1. Time consumption: An activity must consume time.
2. Use of resources: An activity usually consumes Labour, Material or Equipment
resources.
3. Definite Start and Finish time: An activity represents a definite scope of work
i.e. Starting and Ending point in time.
4. Activities are measurable. The progress towards completion of activity’s scope
of work must be measureable.
26.
ACTIVITY DURATION
• Oneof the most important steps in planning a project is estimating the
time required to complete each activity. The duration of each activity
is a function of quantity of work and work production rate. Work
production rates are based on planned composition of labor and
equipment used to perform the task. Careless estimates of production
rates may cause un economical use of personnel, materials,
equipment and time.
• When the project bid estimate is prepared, the estimator calculates
the quantity of material that must be put in place and assumes a
production rate to get the cost of each work, which is based
construction method and technique. The bid preparation information
can be served as the tool for calculating g an activity duration.
• All Activities in a schedule should have same unit of time, which may
be in months, weeks, days and hours.
27.
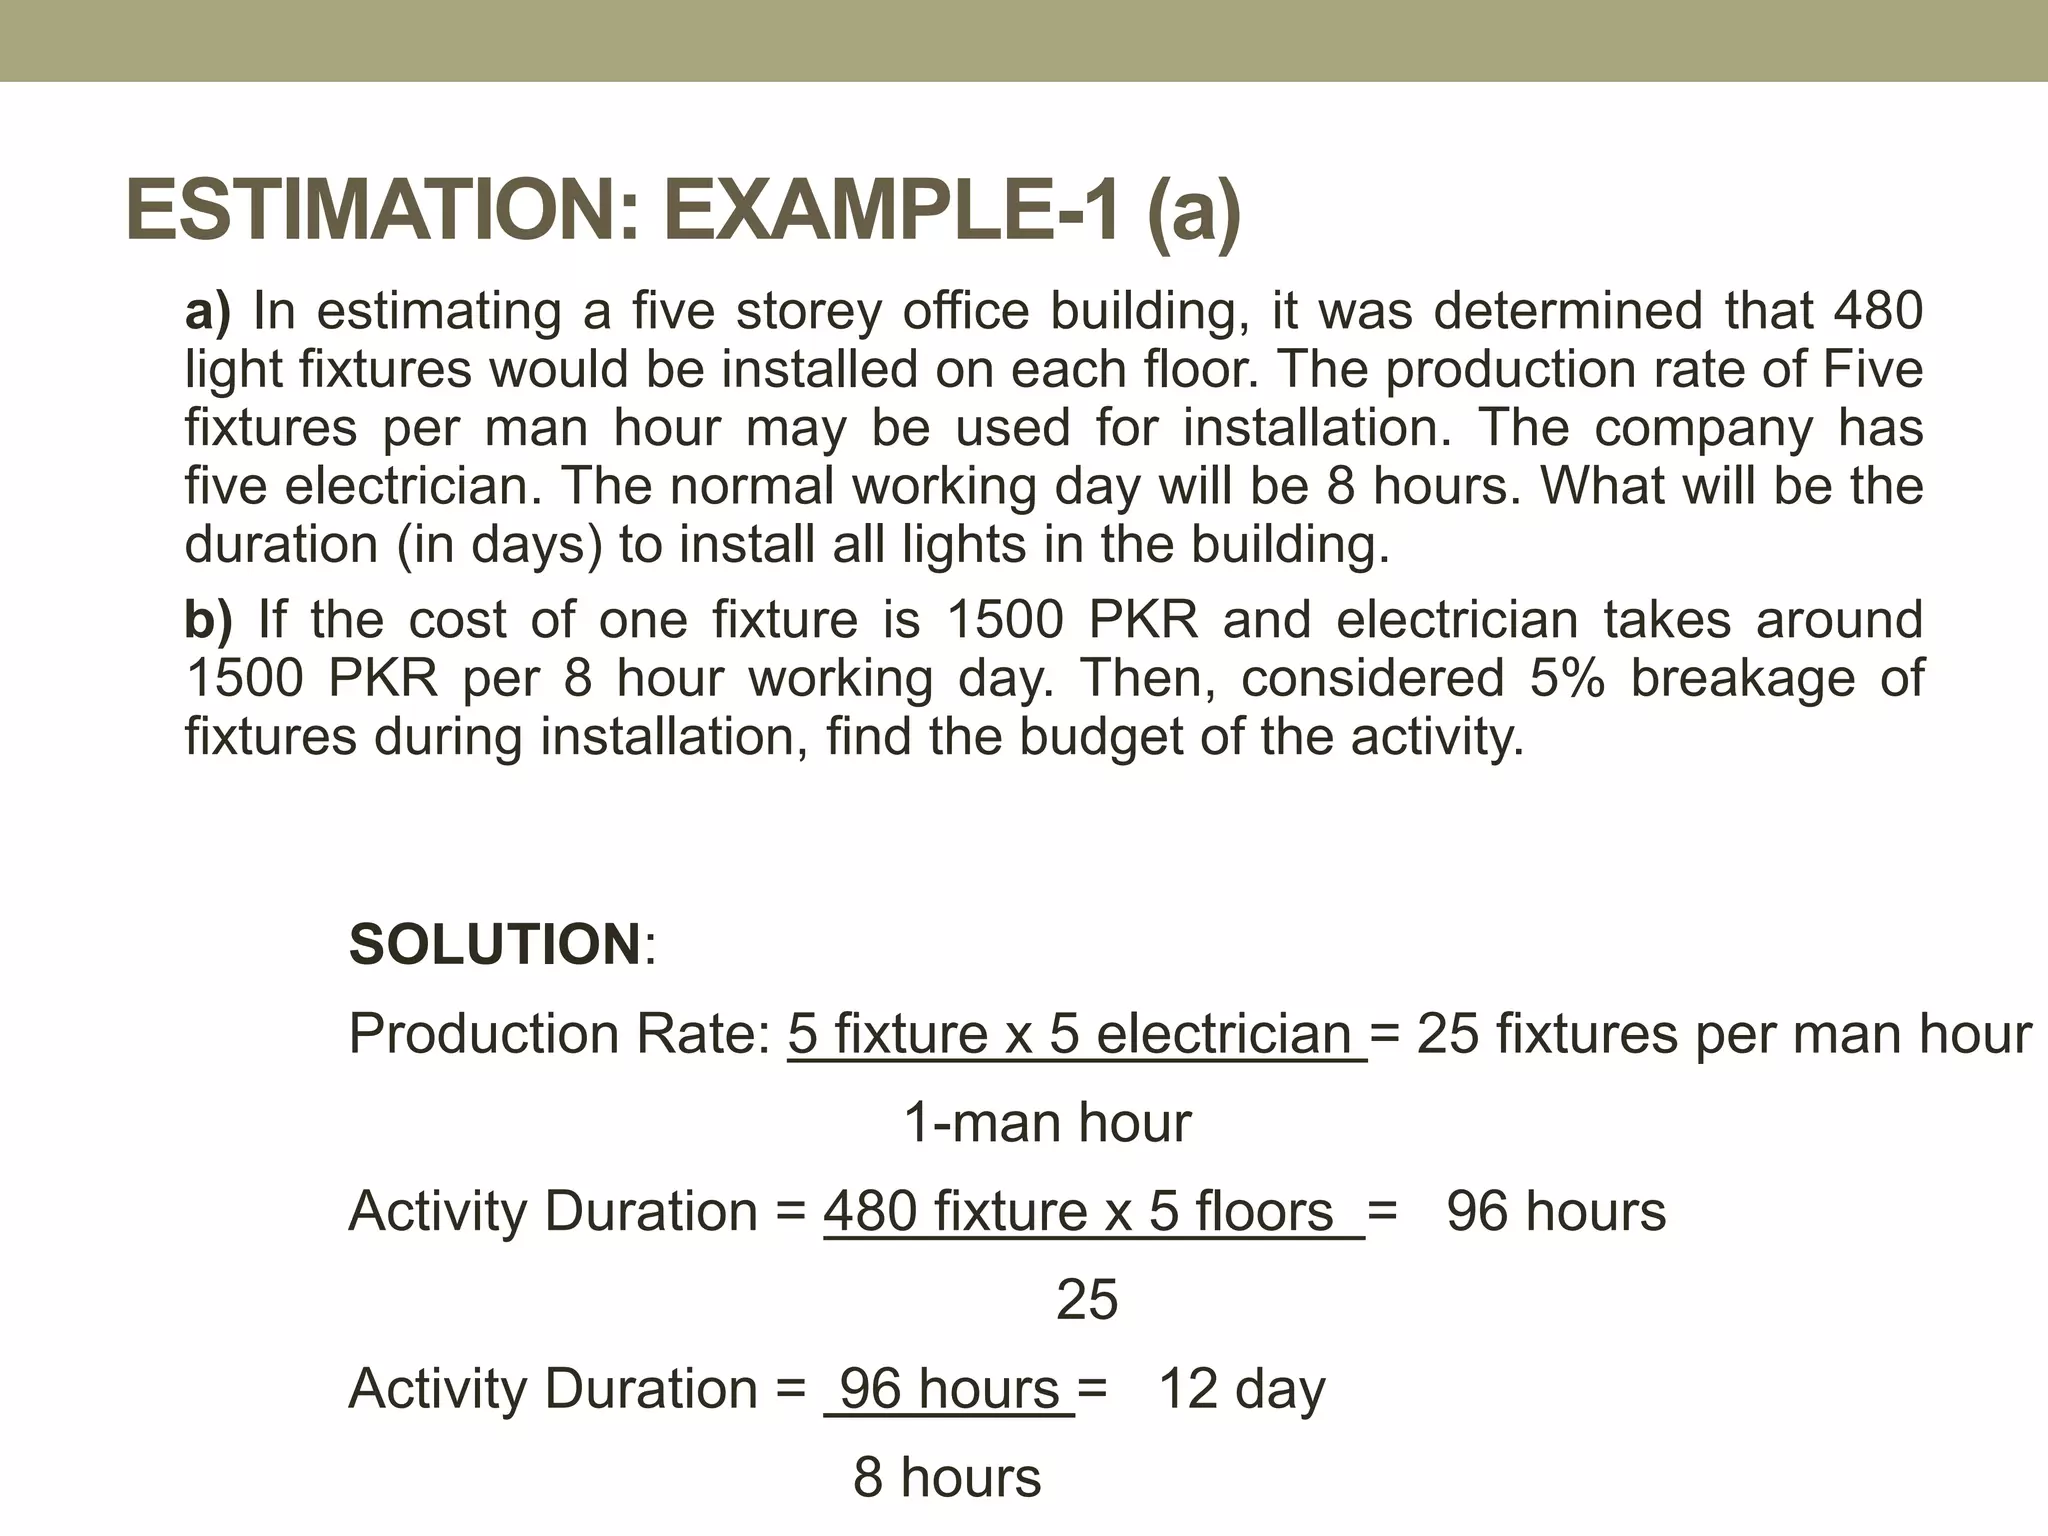
ESTIMATION: EXAMPLE-1 (a)
a)In estimating a five storey office building, it was determined that 480
light fixtures would be installed on each floor. The production rate of Five
fixtures per man hour may be used for installation. The company has
five electrician. The normal working day will be 8 hours. What will be the
duration (in days) to install all lights in the building.
b) If the cost of one fixture is 1500 PKR and electrician takes around
1500 PKR per 8 hour working day. Then, considered 5% breakage of
fixtures during installation, find the budget of the activity.
SOLUTION:
Production Rate: 5 fixture x 5 electrician = 25 fixtures per man hour
1-man hour
Activity Duration = 480 fixture x 5 floors = 96 hours
25
Activity Duration = 96 hours = 12 day
8 hours
28.
ESTIMATION: EXAMPLE-1 (b)
Thefollowing items of works were to be conducted in a
project;
1. Excavation of 4768 cubic meter
2. Driving of RCC Piles (48 Nos.) Dia 2ft. 200 ft deep.
Find Duration and Budget of Project. Assume missing data.
SOLUTION:
29.
IMPORTANCE OF ACCURATEESTIMATES
29
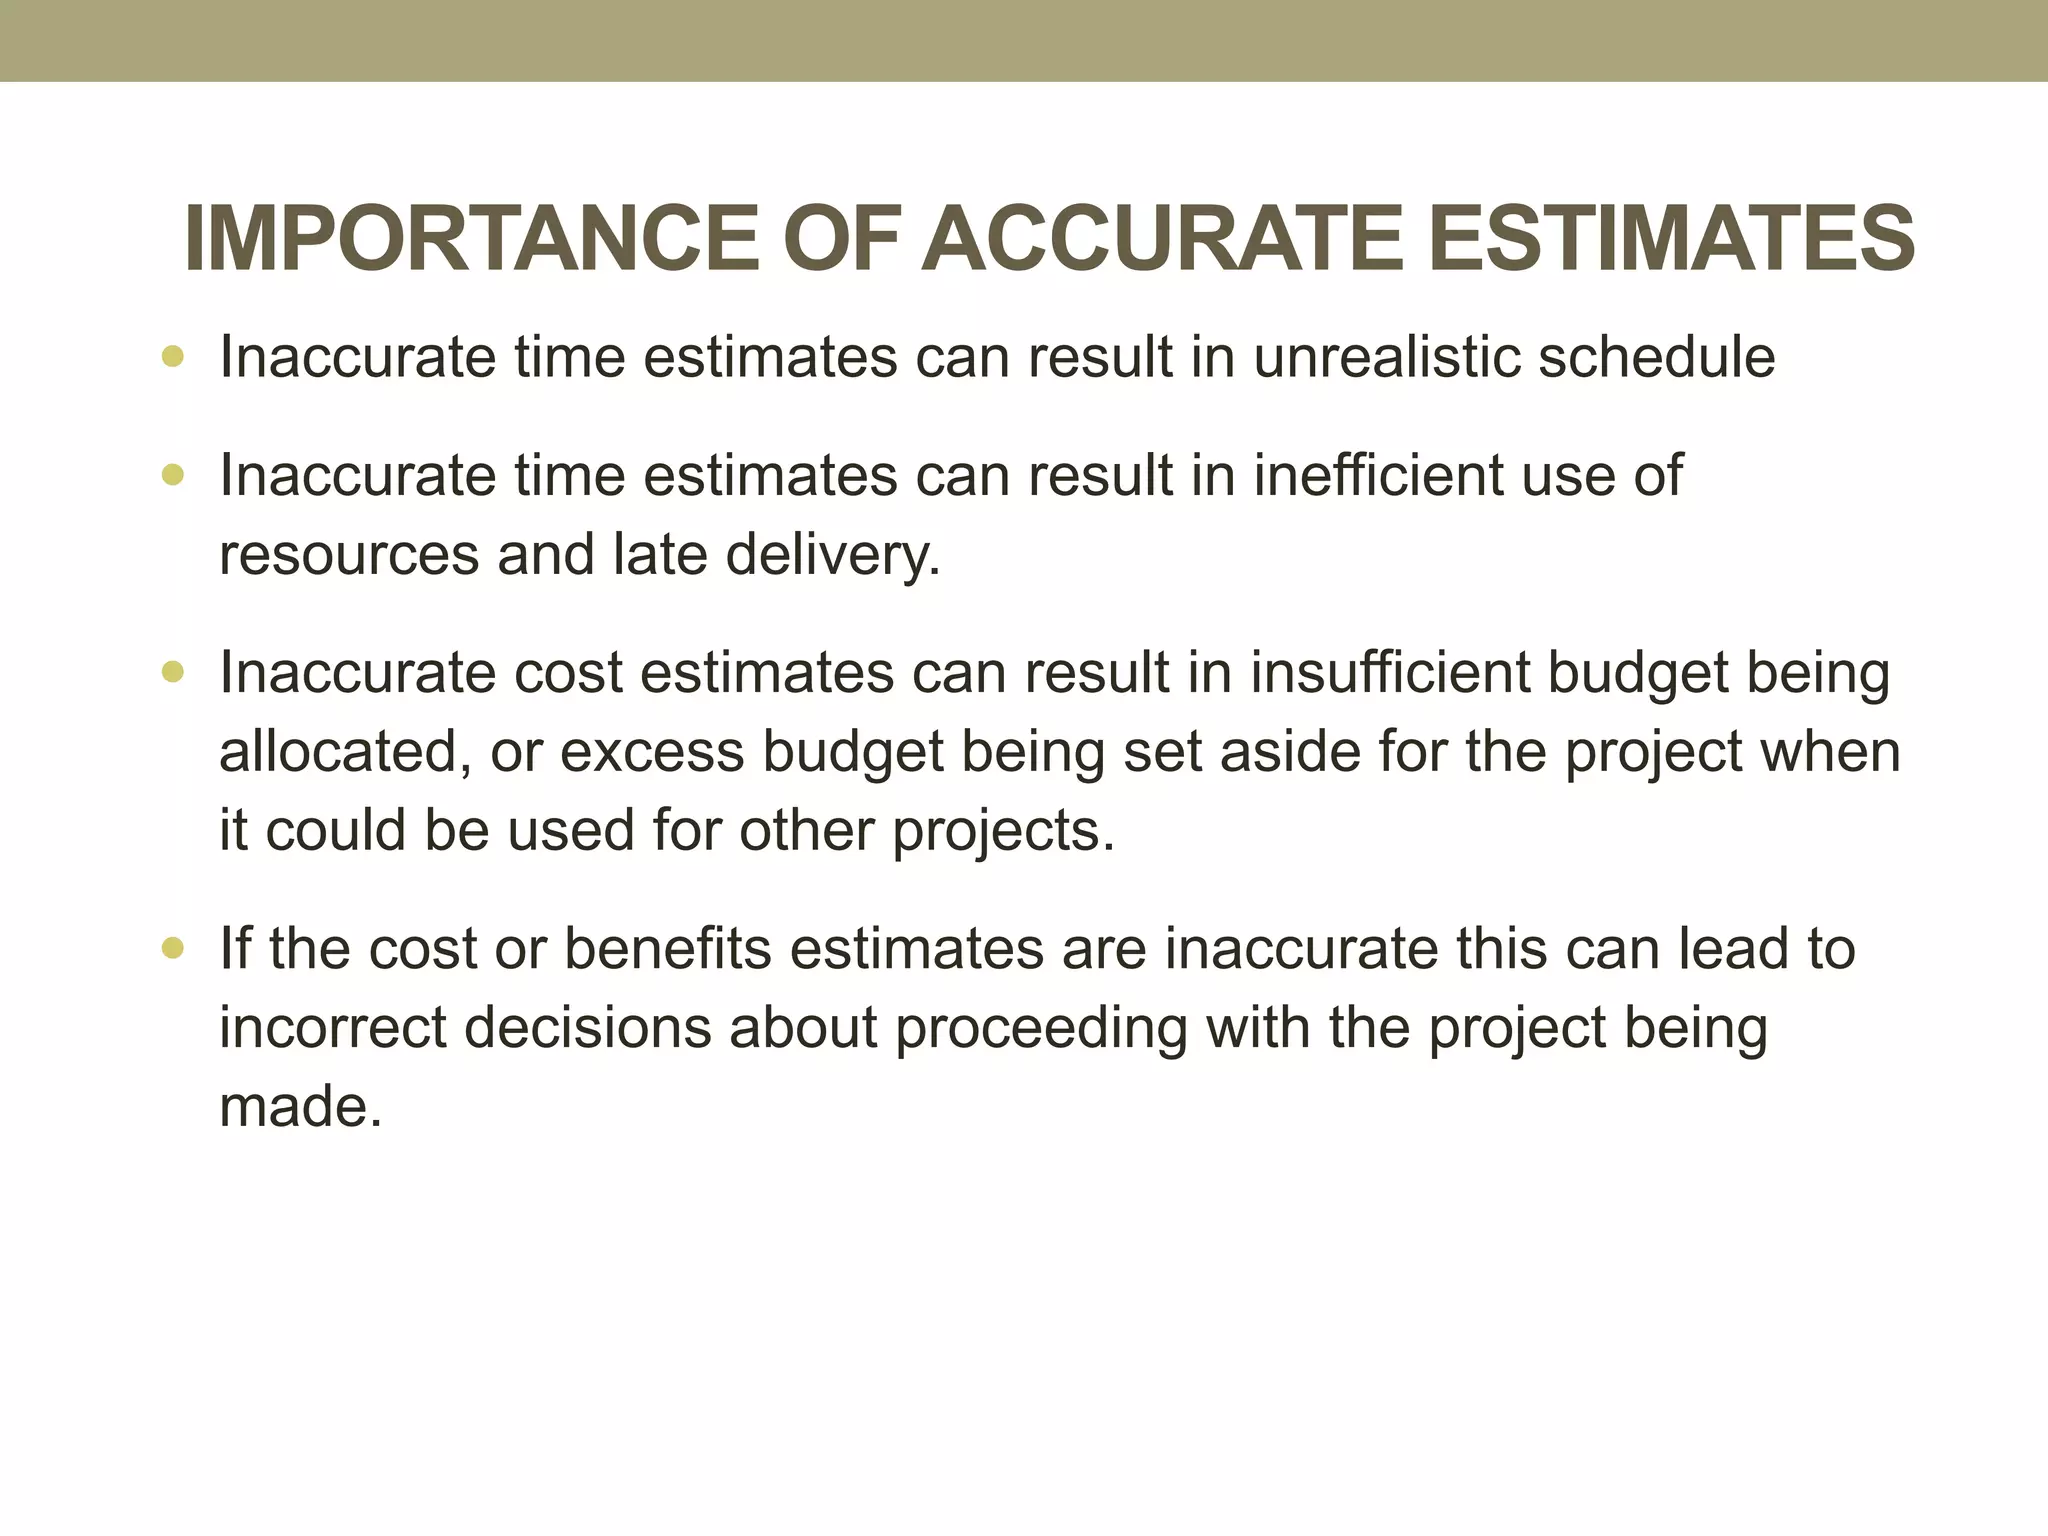
Inaccurate time estimates can result in unrealistic schedule
Inaccurate time estimates can result in inefficient use of
resources and late delivery.
Inaccurate cost estimates can result in insufficient budget being
allocated, or excess budget being set aside for the project when
it could be used for other projects.
If the cost or benefits estimates are inaccurate this can lead to
incorrect decisions about proceeding with the project being
made.
30.
BASIC DEFINITIONS OFCPM TERMS
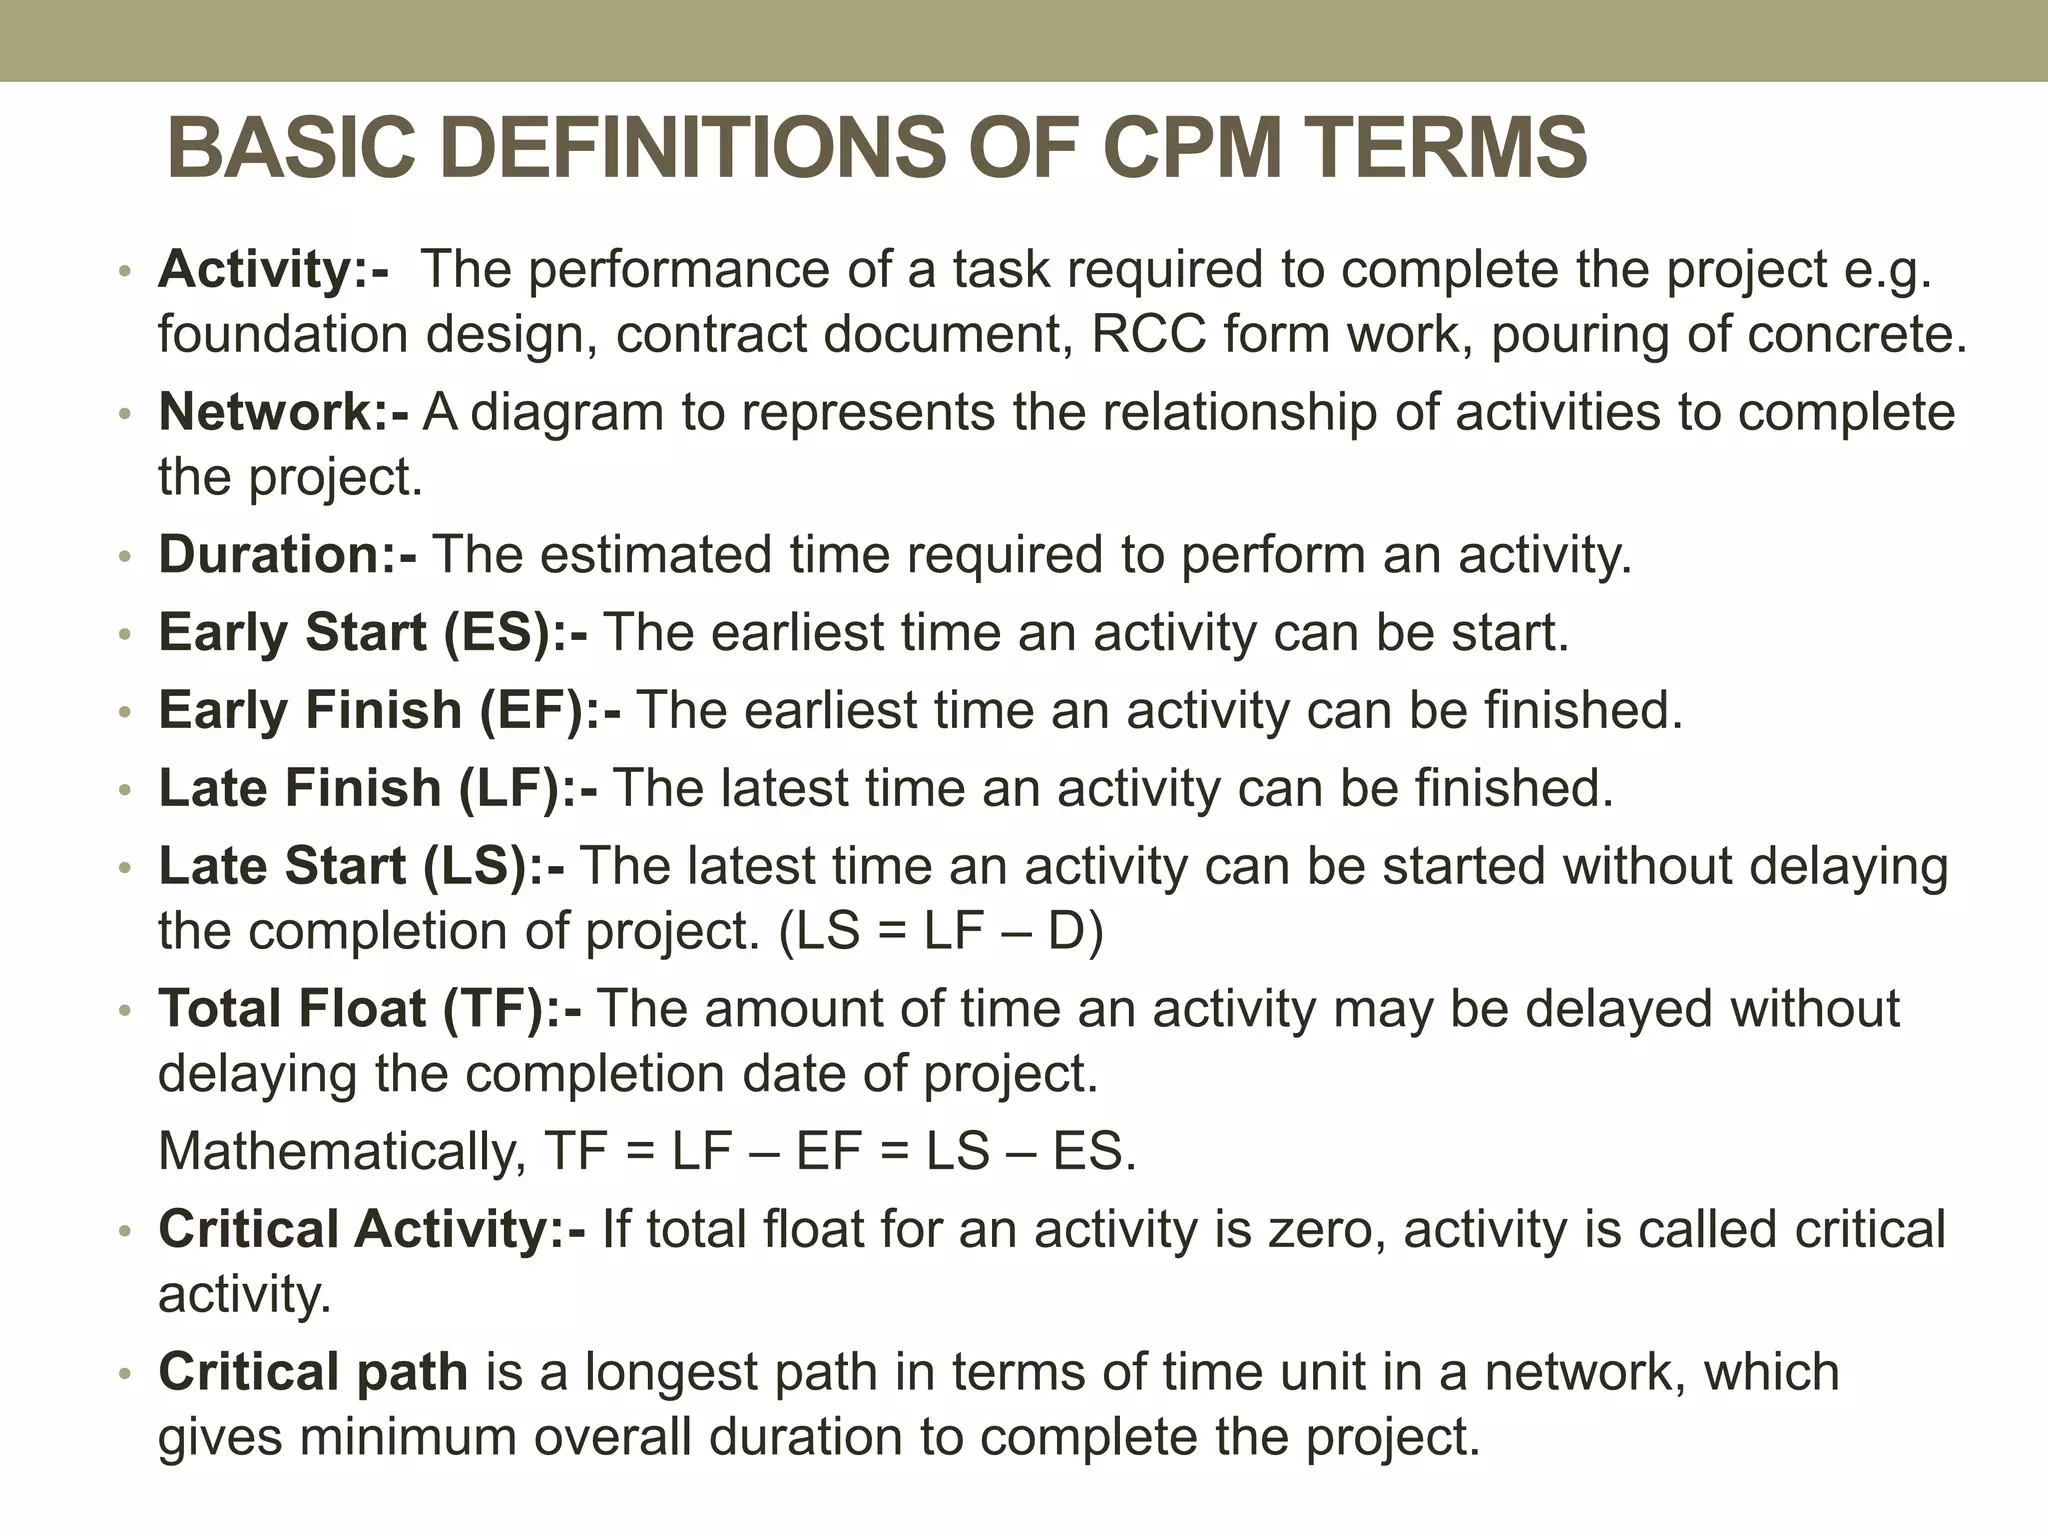
• Activity:- The performance of a task required to complete the project e.g.
foundation design, contract document, RCC form work, pouring of concrete.
• Network:- A diagram to represents the relationship of activities to complete
the project.
• Duration:- The estimated time required to perform an activity.
• Early Start (ES):- The earliest time an activity can be start.
• Early Finish (EF):- The earliest time an activity can be finished.
• Late Finish (LF):- The latest time an activity can be finished.
• Late Start (LS):- The latest time an activity can be started without delaying
the completion of project. (LS = LF – D)
• Total Float (TF):- The amount of time an activity may be delayed without
delaying the completion date of project.
Mathematically, TF = LF – EF = LS – ES.
• Critical Activity:- If total float for an activity is zero, activity is called critical
activity.
• Critical path is a longest path in terms of time unit in a network, which
gives minimum overall duration to complete the project.
31.
NETWORK CONSTRUCTION
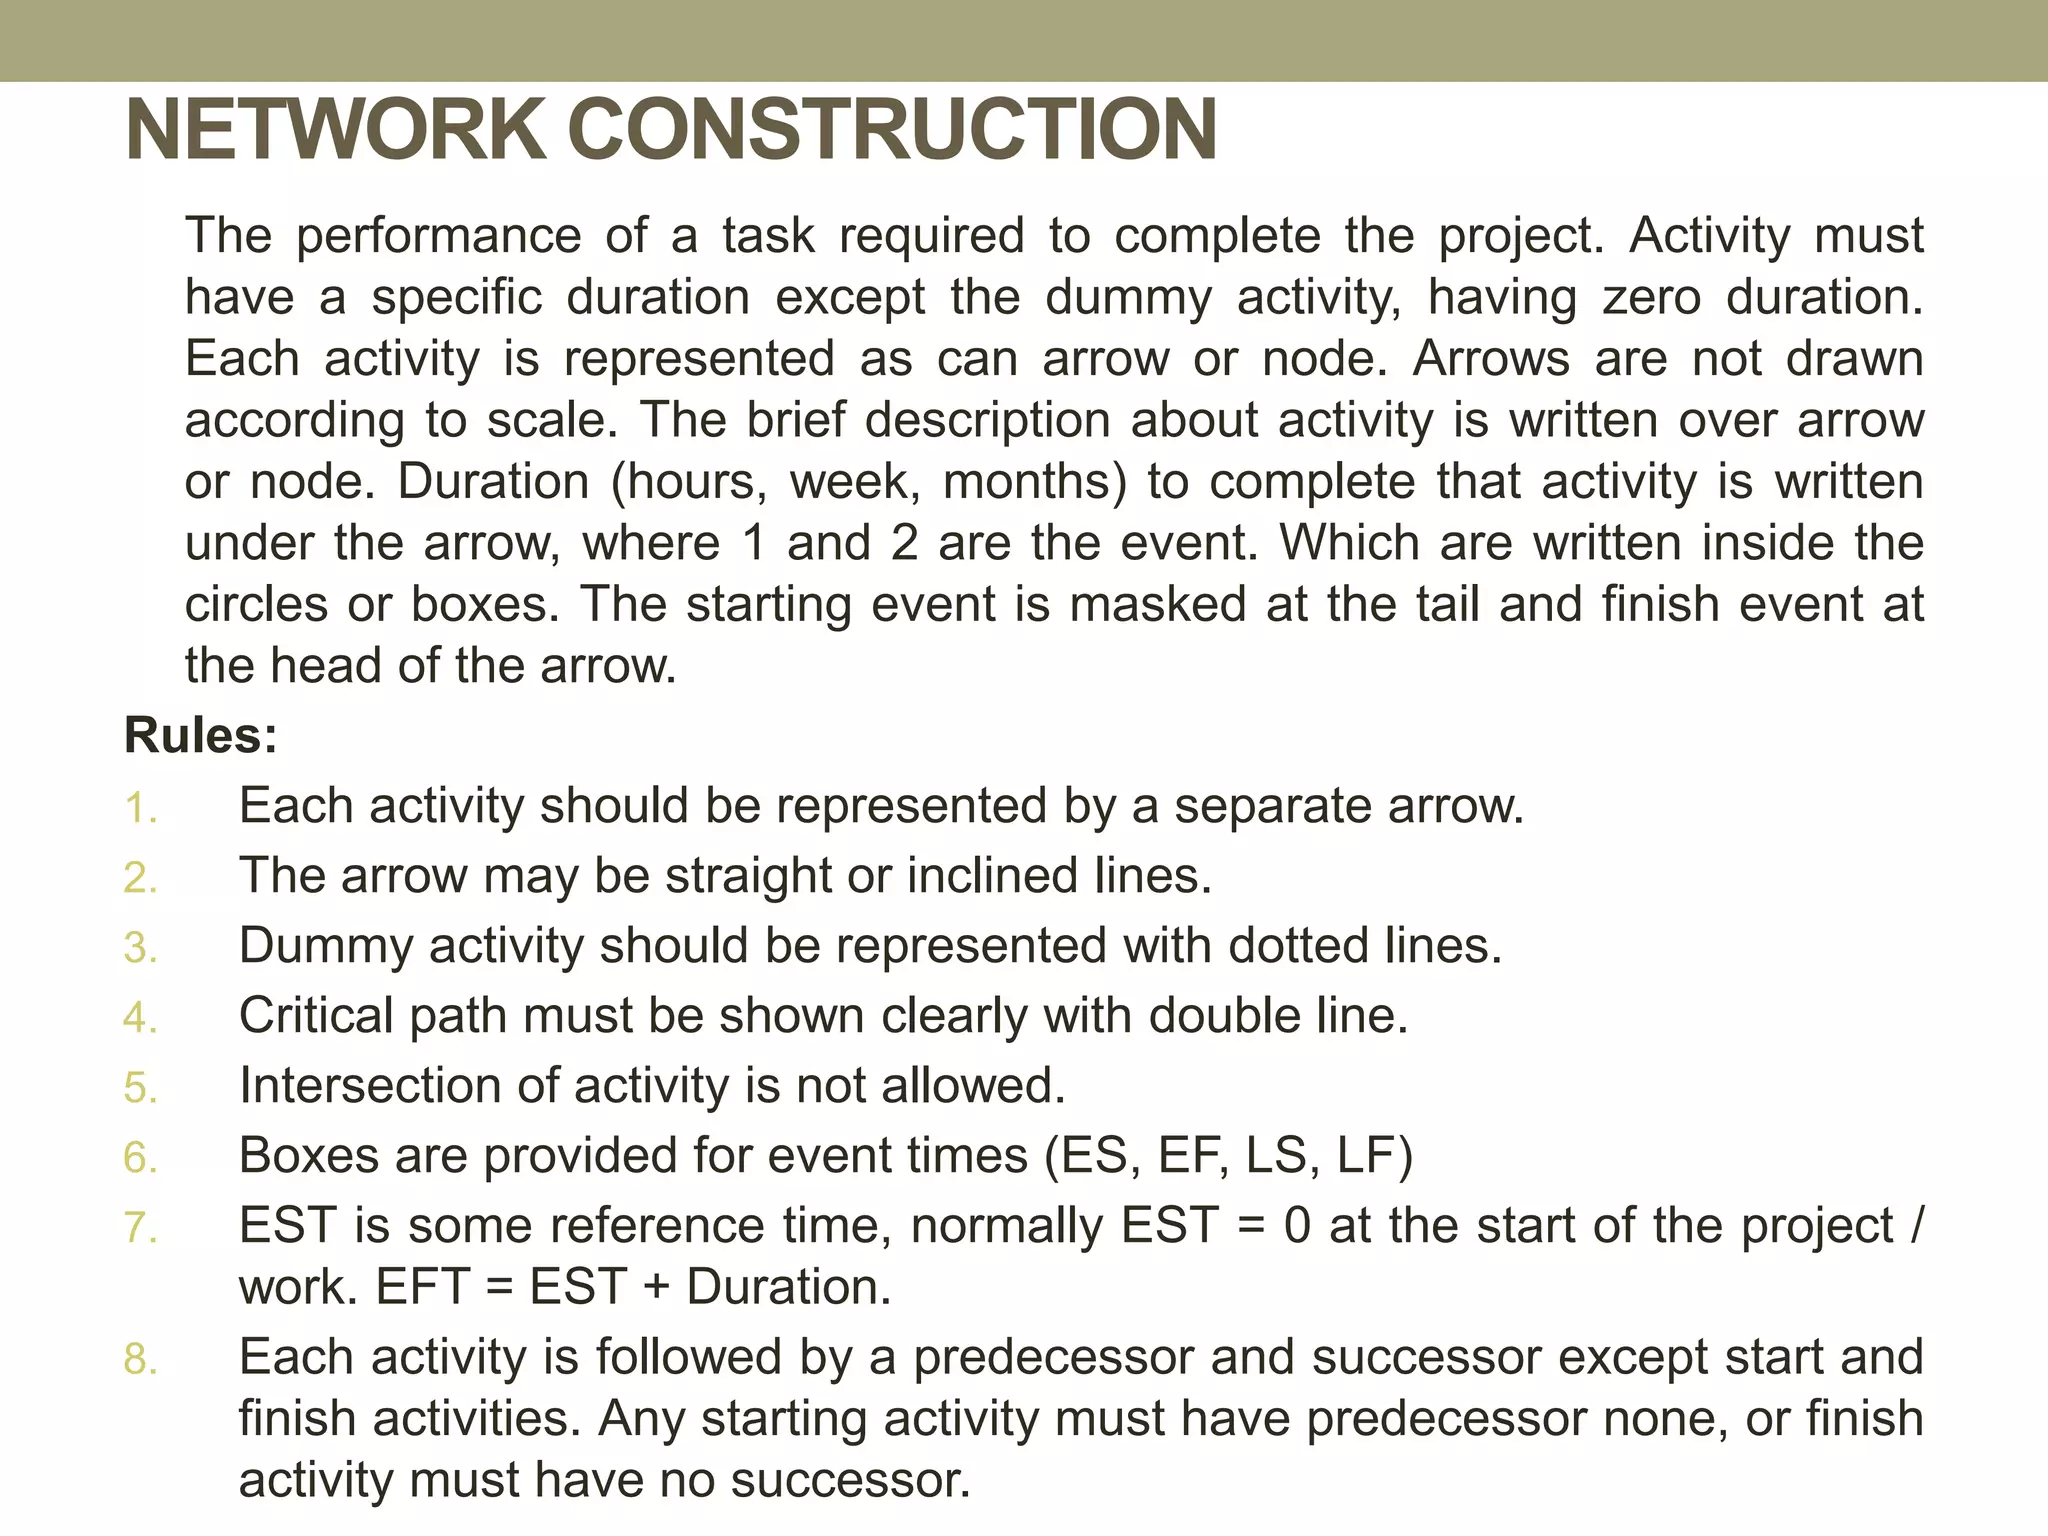
The performanceof a task required to complete the project. Activity must
have a specific duration except the dummy activity, having zero duration.
Each activity is represented as can arrow or node. Arrows are not drawn
according to scale. The brief description about activity is written over arrow
or node. Duration (hours, week, months) to complete that activity is written
under the arrow, where 1 and 2 are the event. Which are written inside the
circles or boxes. The starting event is masked at the tail and finish event at
the head of the arrow.
Rules:
1. Each activity should be represented by a separate arrow.
2. The arrow may be straight or inclined lines.
3. Dummy activity should be represented with dotted lines.
4. Critical path must be shown clearly with double line.
5. Intersection of activity is not allowed.
6. Boxes are provided for event times (ES, EF, LS, LF)
7. EST is some reference time, normally EST = 0 at the start of the project /
work. EFT = EST + Duration.
8. Each activity is followed by a predecessor and successor except start and
finish activities. Any starting activity must have predecessor none, or finish
activity must have no successor.
33.
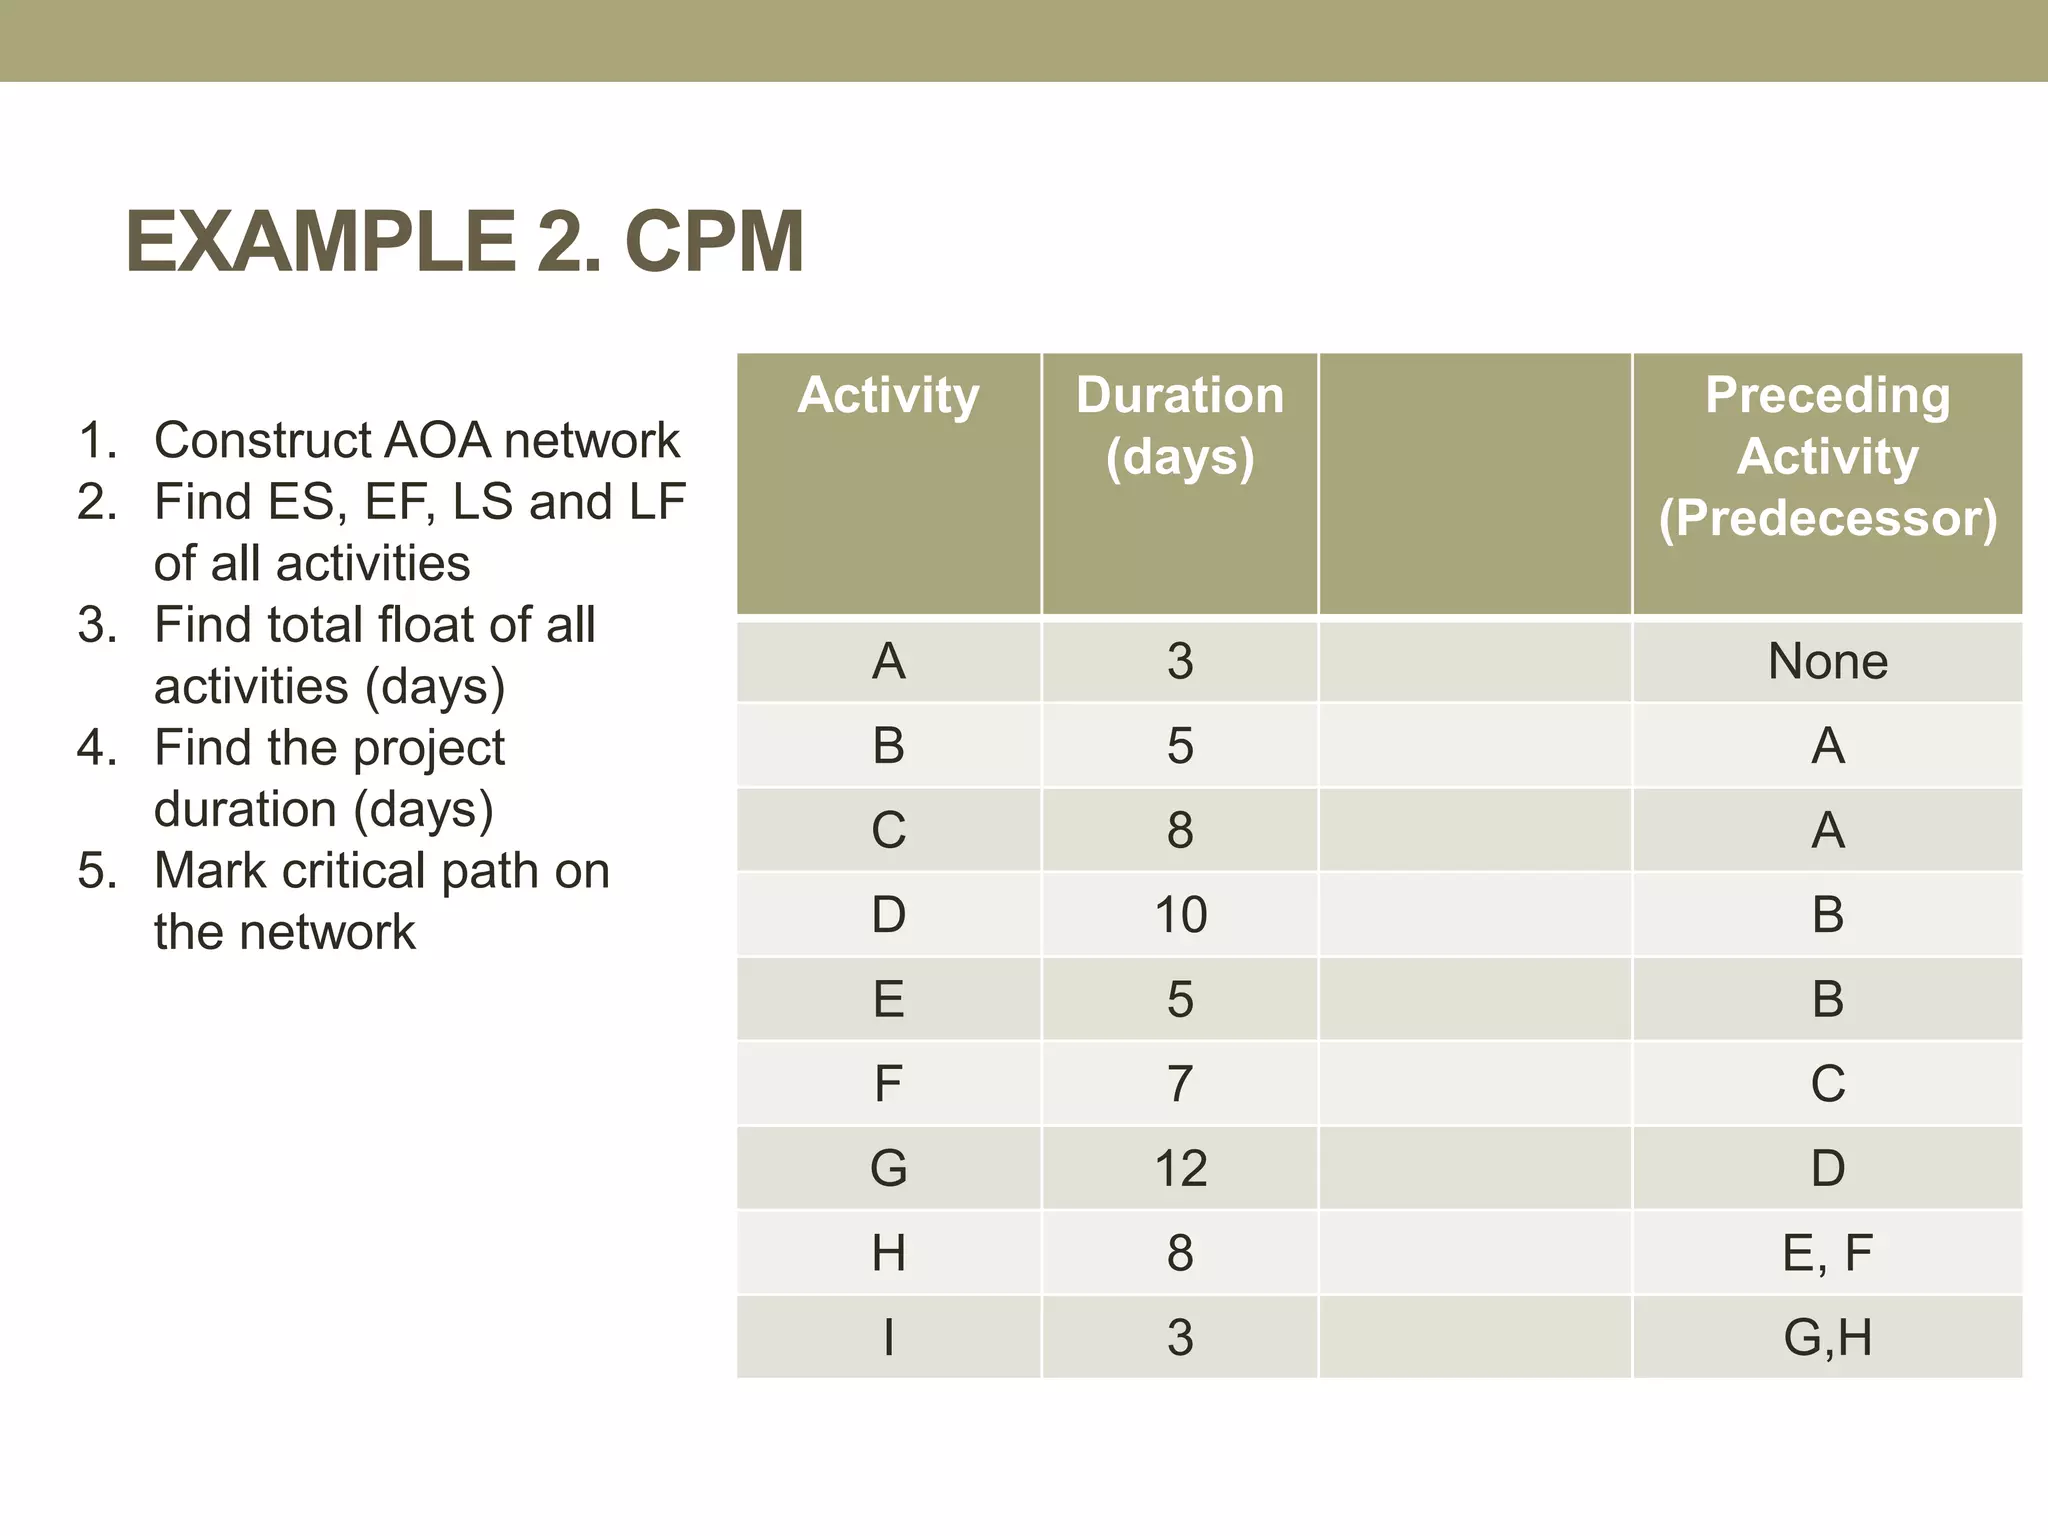
EXAMPLE 2. CPM
ActivityDuration
(days)
Preceding
Activity
(Predecessor)
A 3 None
B 5 A
C 8 A
D 10 B
E 5 B
F 7 C
G 12 D
H 8 E, F
I 3 G,H
1. Construct AOA network
2. Find ES, EF, LS and LF
of all activities
3. Find total float of all
activities (days)
4. Find the project
duration (days)
5. Mark critical path on
the network
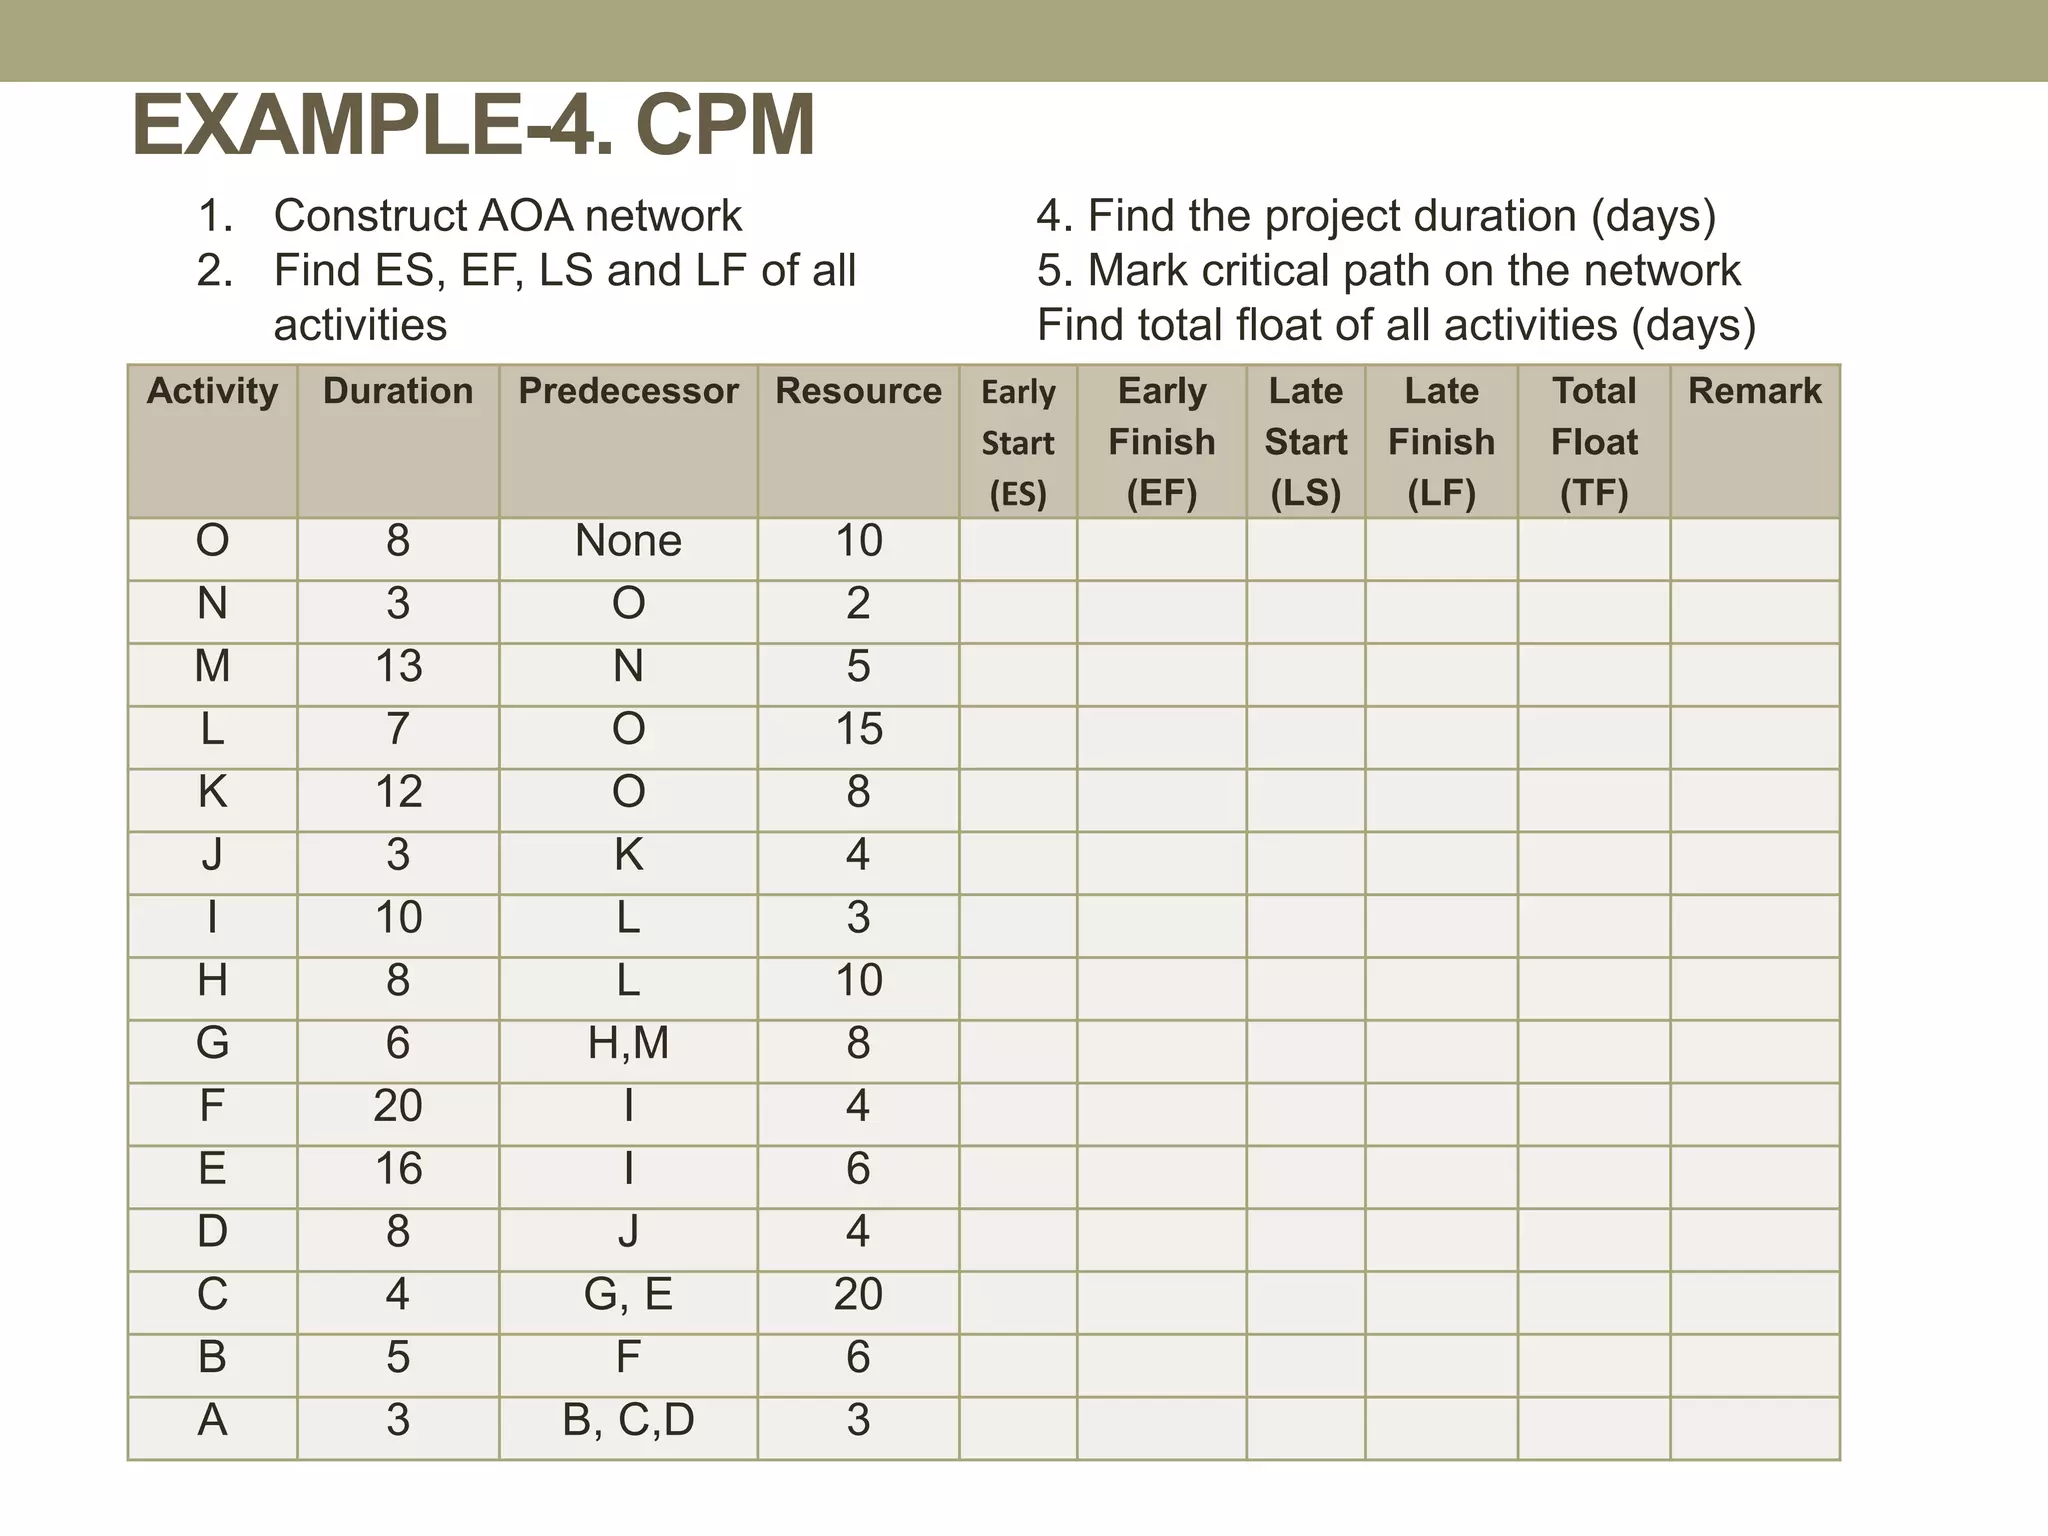
EXAMPLE-4. CPM
Activity DurationPredecessor Resource Early
Start
(ES)
Early
Finish
(EF)
Late
Start
(LS)
Late
Finish
(LF)
Total
Float
(TF)
Remark
O 8 None 10
N 3 O 2
M 13 N 5
L 7 O 15
K 12 O 8
J 3 K 4
I 10 L 3
H 8 L 10
G 6 H,M 8
F 20 I 4
E 16 I 6
D 8 J 4
C 4 G, E 20
B 5 F 6
A 3 B, C,D 3
1. Construct AOA network
2. Find ES, EF, LS and LF of all
activities
4. Find the project duration (days)
5. Mark critical path on the network
Find total float of all activities (days)
36.
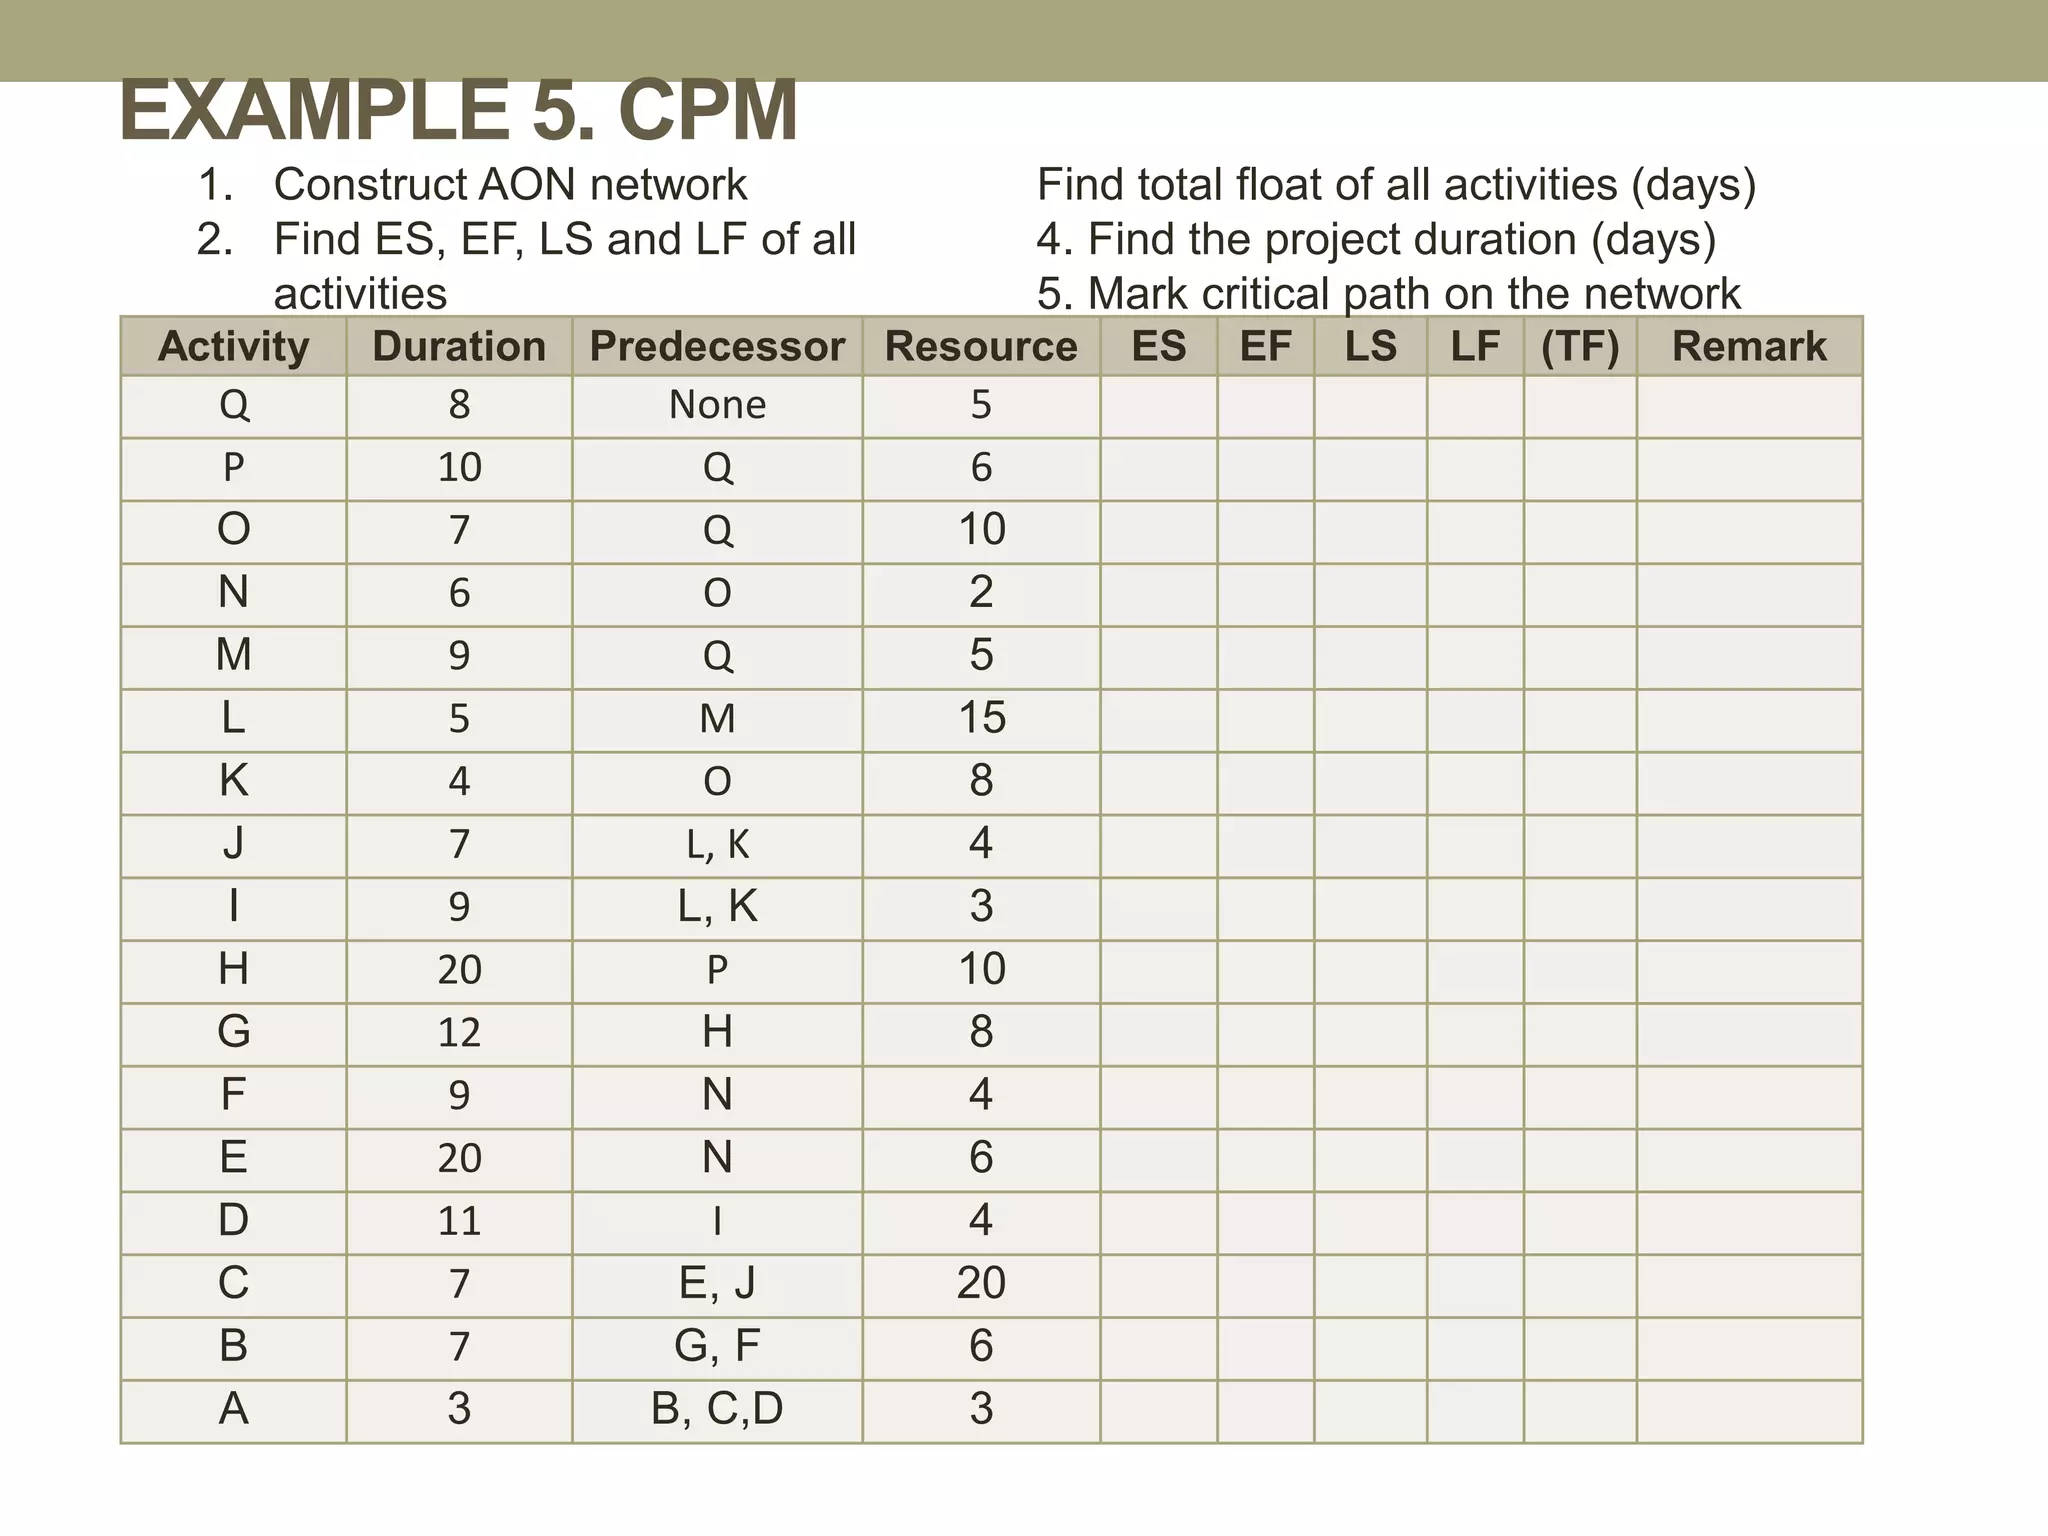
EXAMPLE 5. CPM
ActivityDuration Predecessor Resource ES EF LS LF (TF) Remark
Q 8 None 5
P 10 Q 6
O 7 Q 10
N 6 O 2
M 9 Q 5
L 5 M 15
K 4 O 8
J 7 L, K 4
I 9 L, K 3
H 20 P 10
G 12 H 8
F 9 N 4
E 20 N 6
D 11 I 4
C 7 E, J 20
B 7 G, F 6
A 3 B, C,D 3
1. Construct AON network
2. Find ES, EF, LS and LF of all
activities
Find total float of all activities (days)
4. Find the project duration (days)
5. Mark critical path on the network
37.
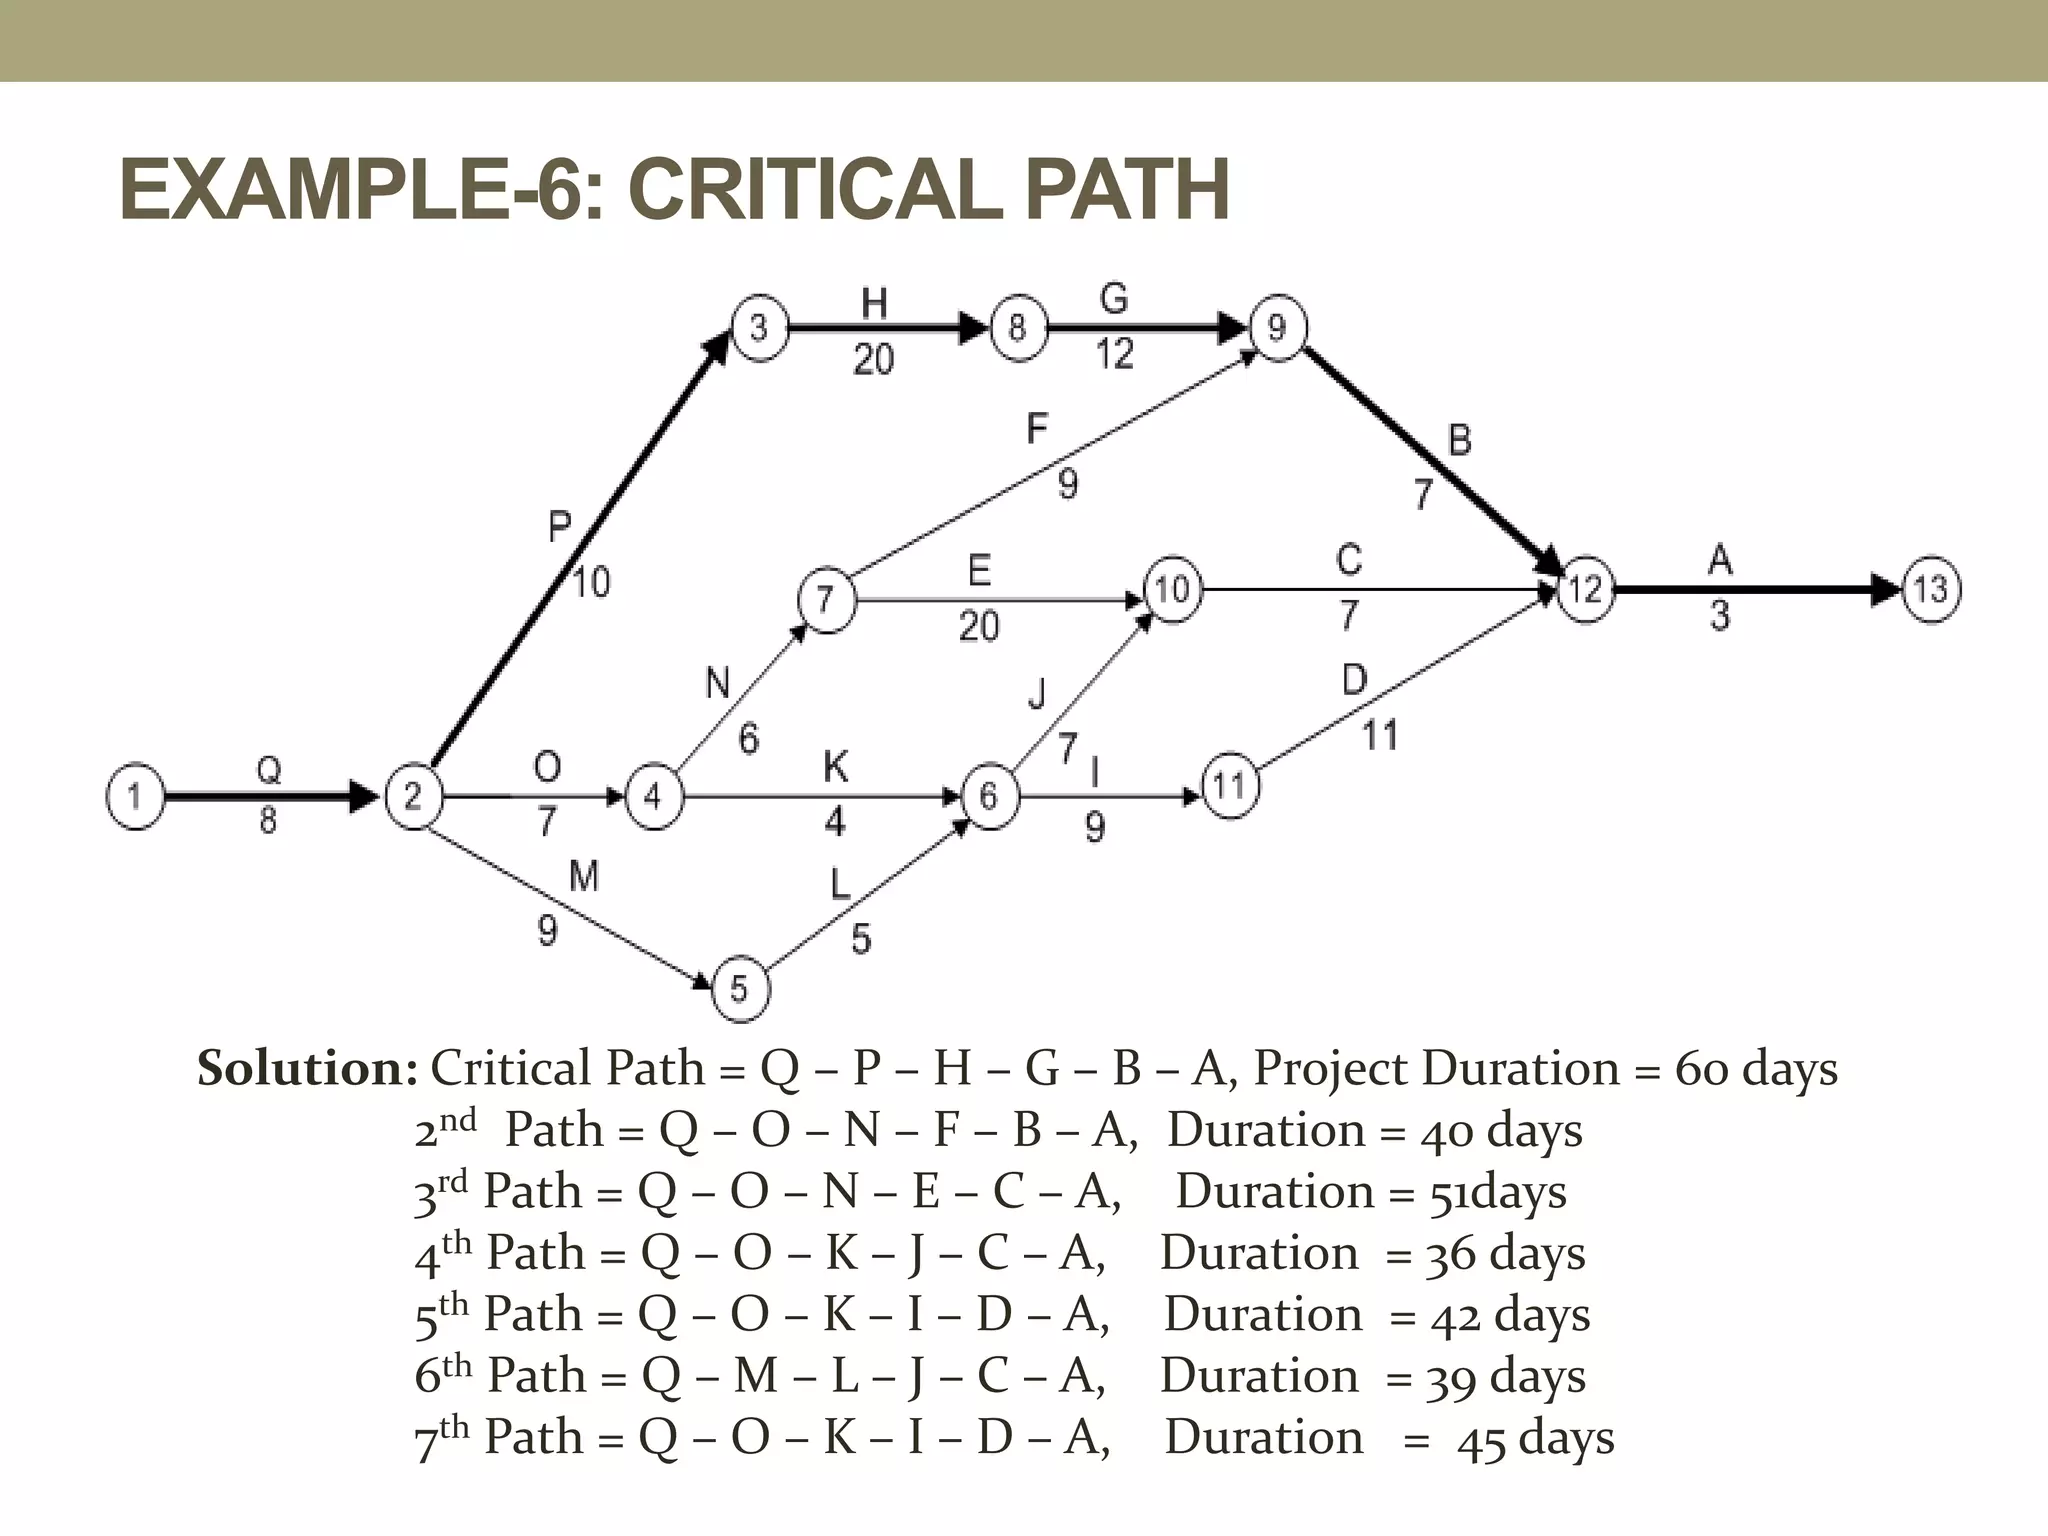
EXAMPLE-6: CRITICAL PATH
Solution:Critical Path = Q – P – H – G – B – A, Project Duration = 60 days
2nd Path = Q – O – N – F – B – A, Duration = 40 days
3rd Path = Q – O – N – E – C – A, Duration = 51days
4th Path = Q – O – K – J – C – A, Duration = 36 days
5th Path = Q – O – K – I – D – A, Duration = 42 days
6th Path = Q – M – L – J – C – A, Duration = 39 days
7th Path = Q – O – K – I – D – A, Duration = 45 days
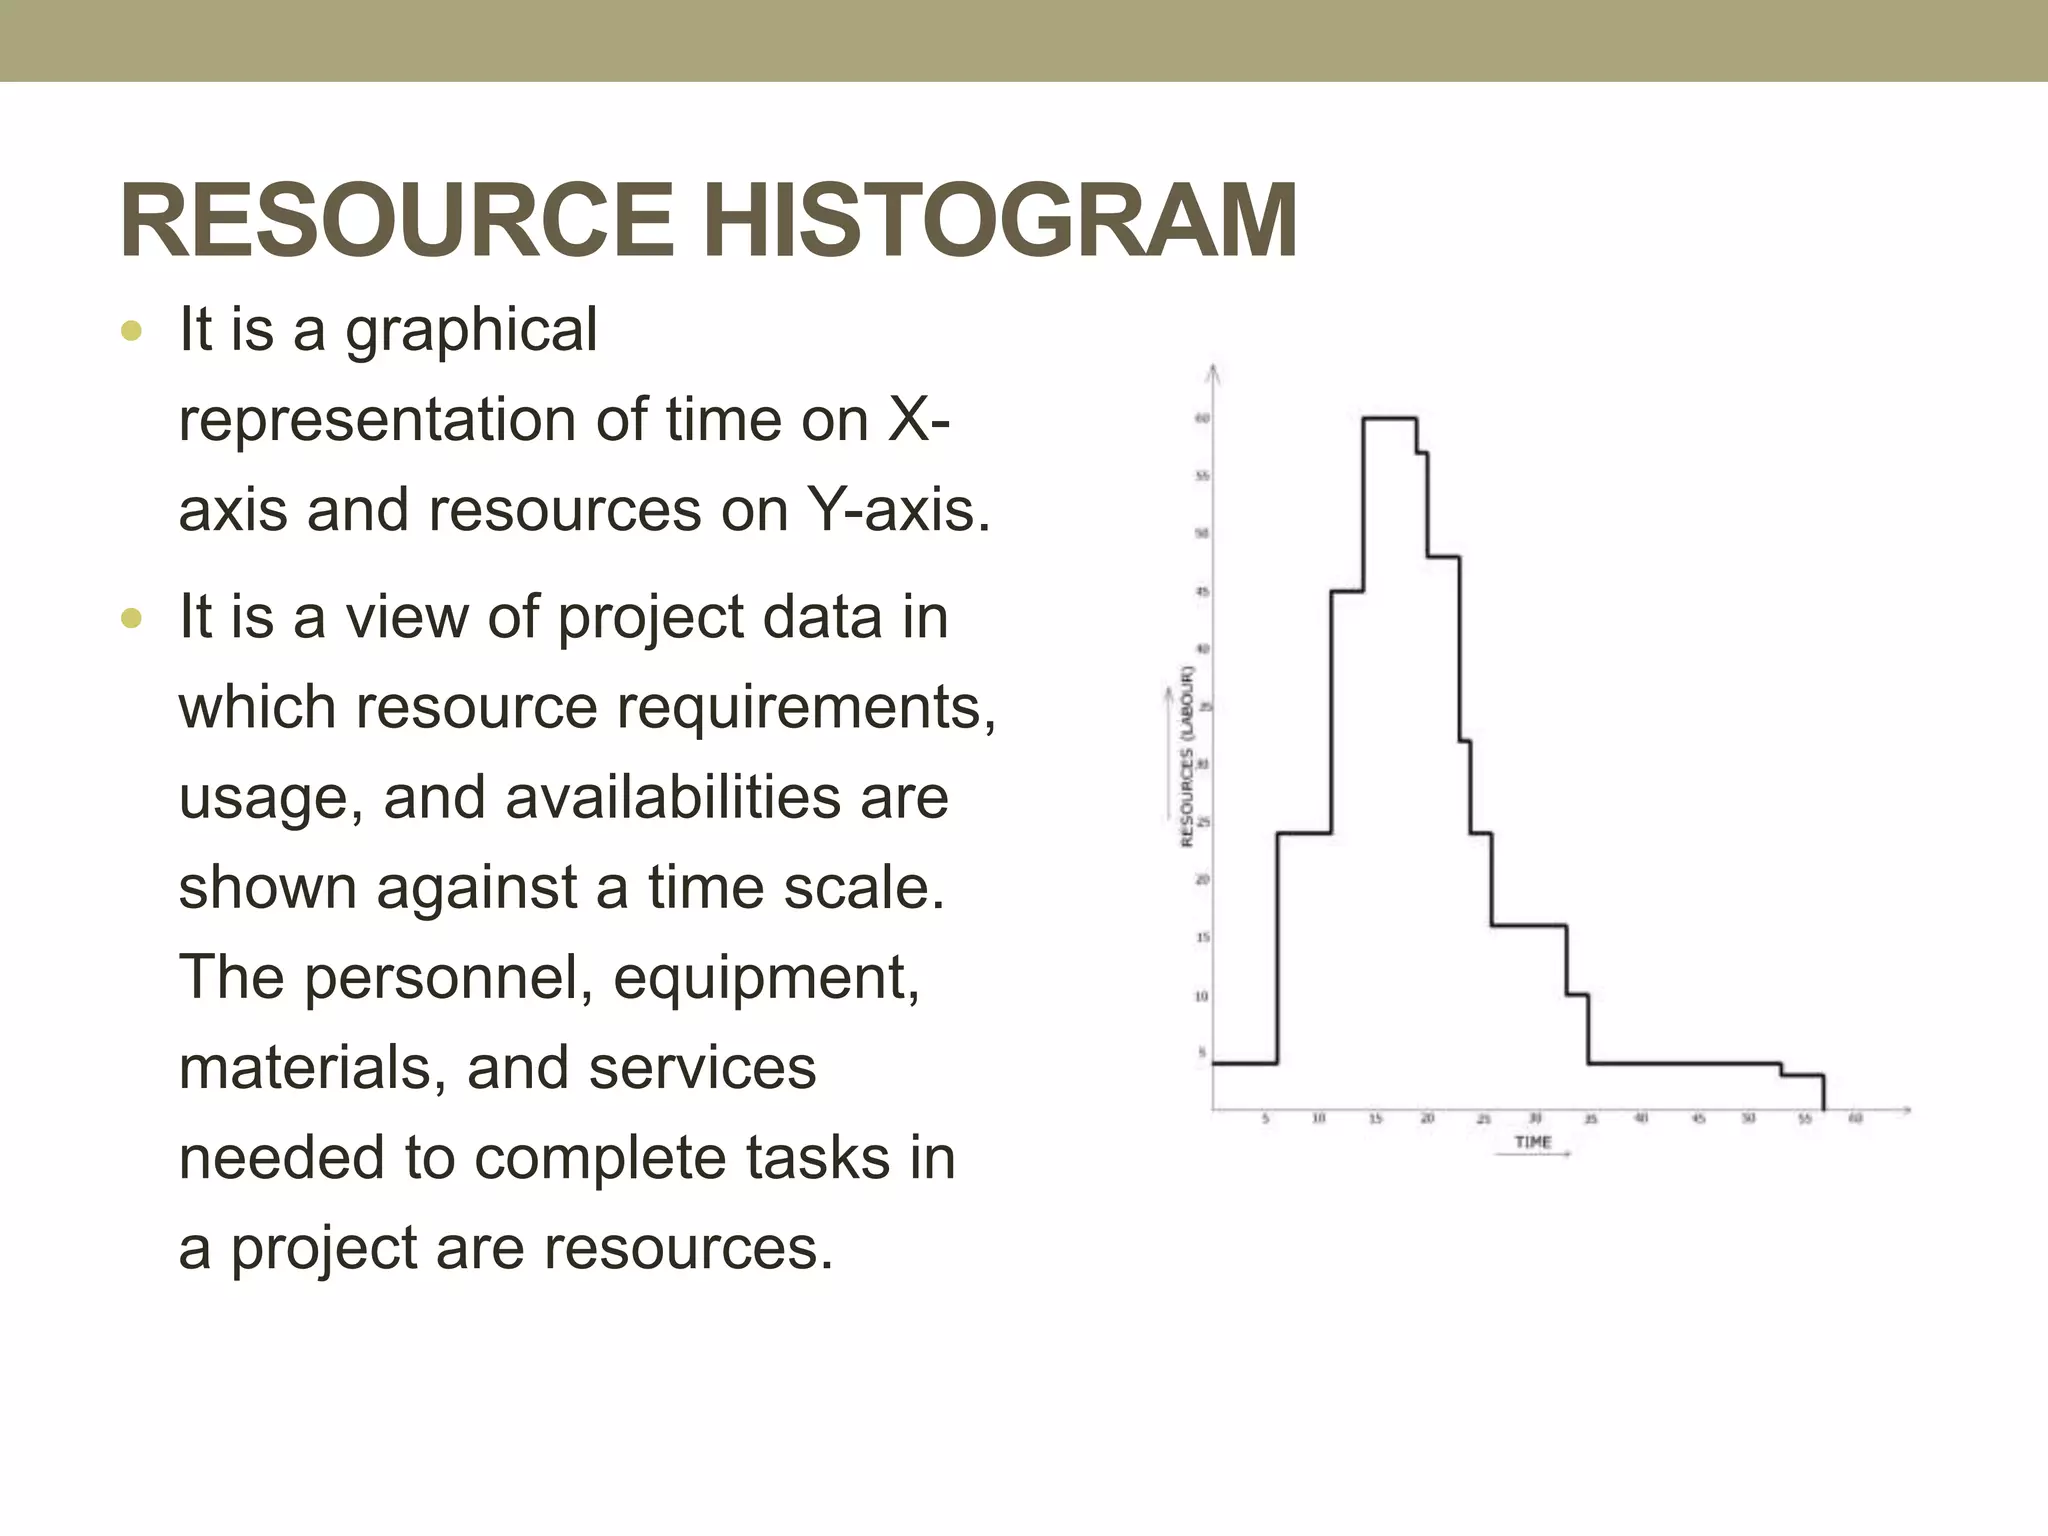
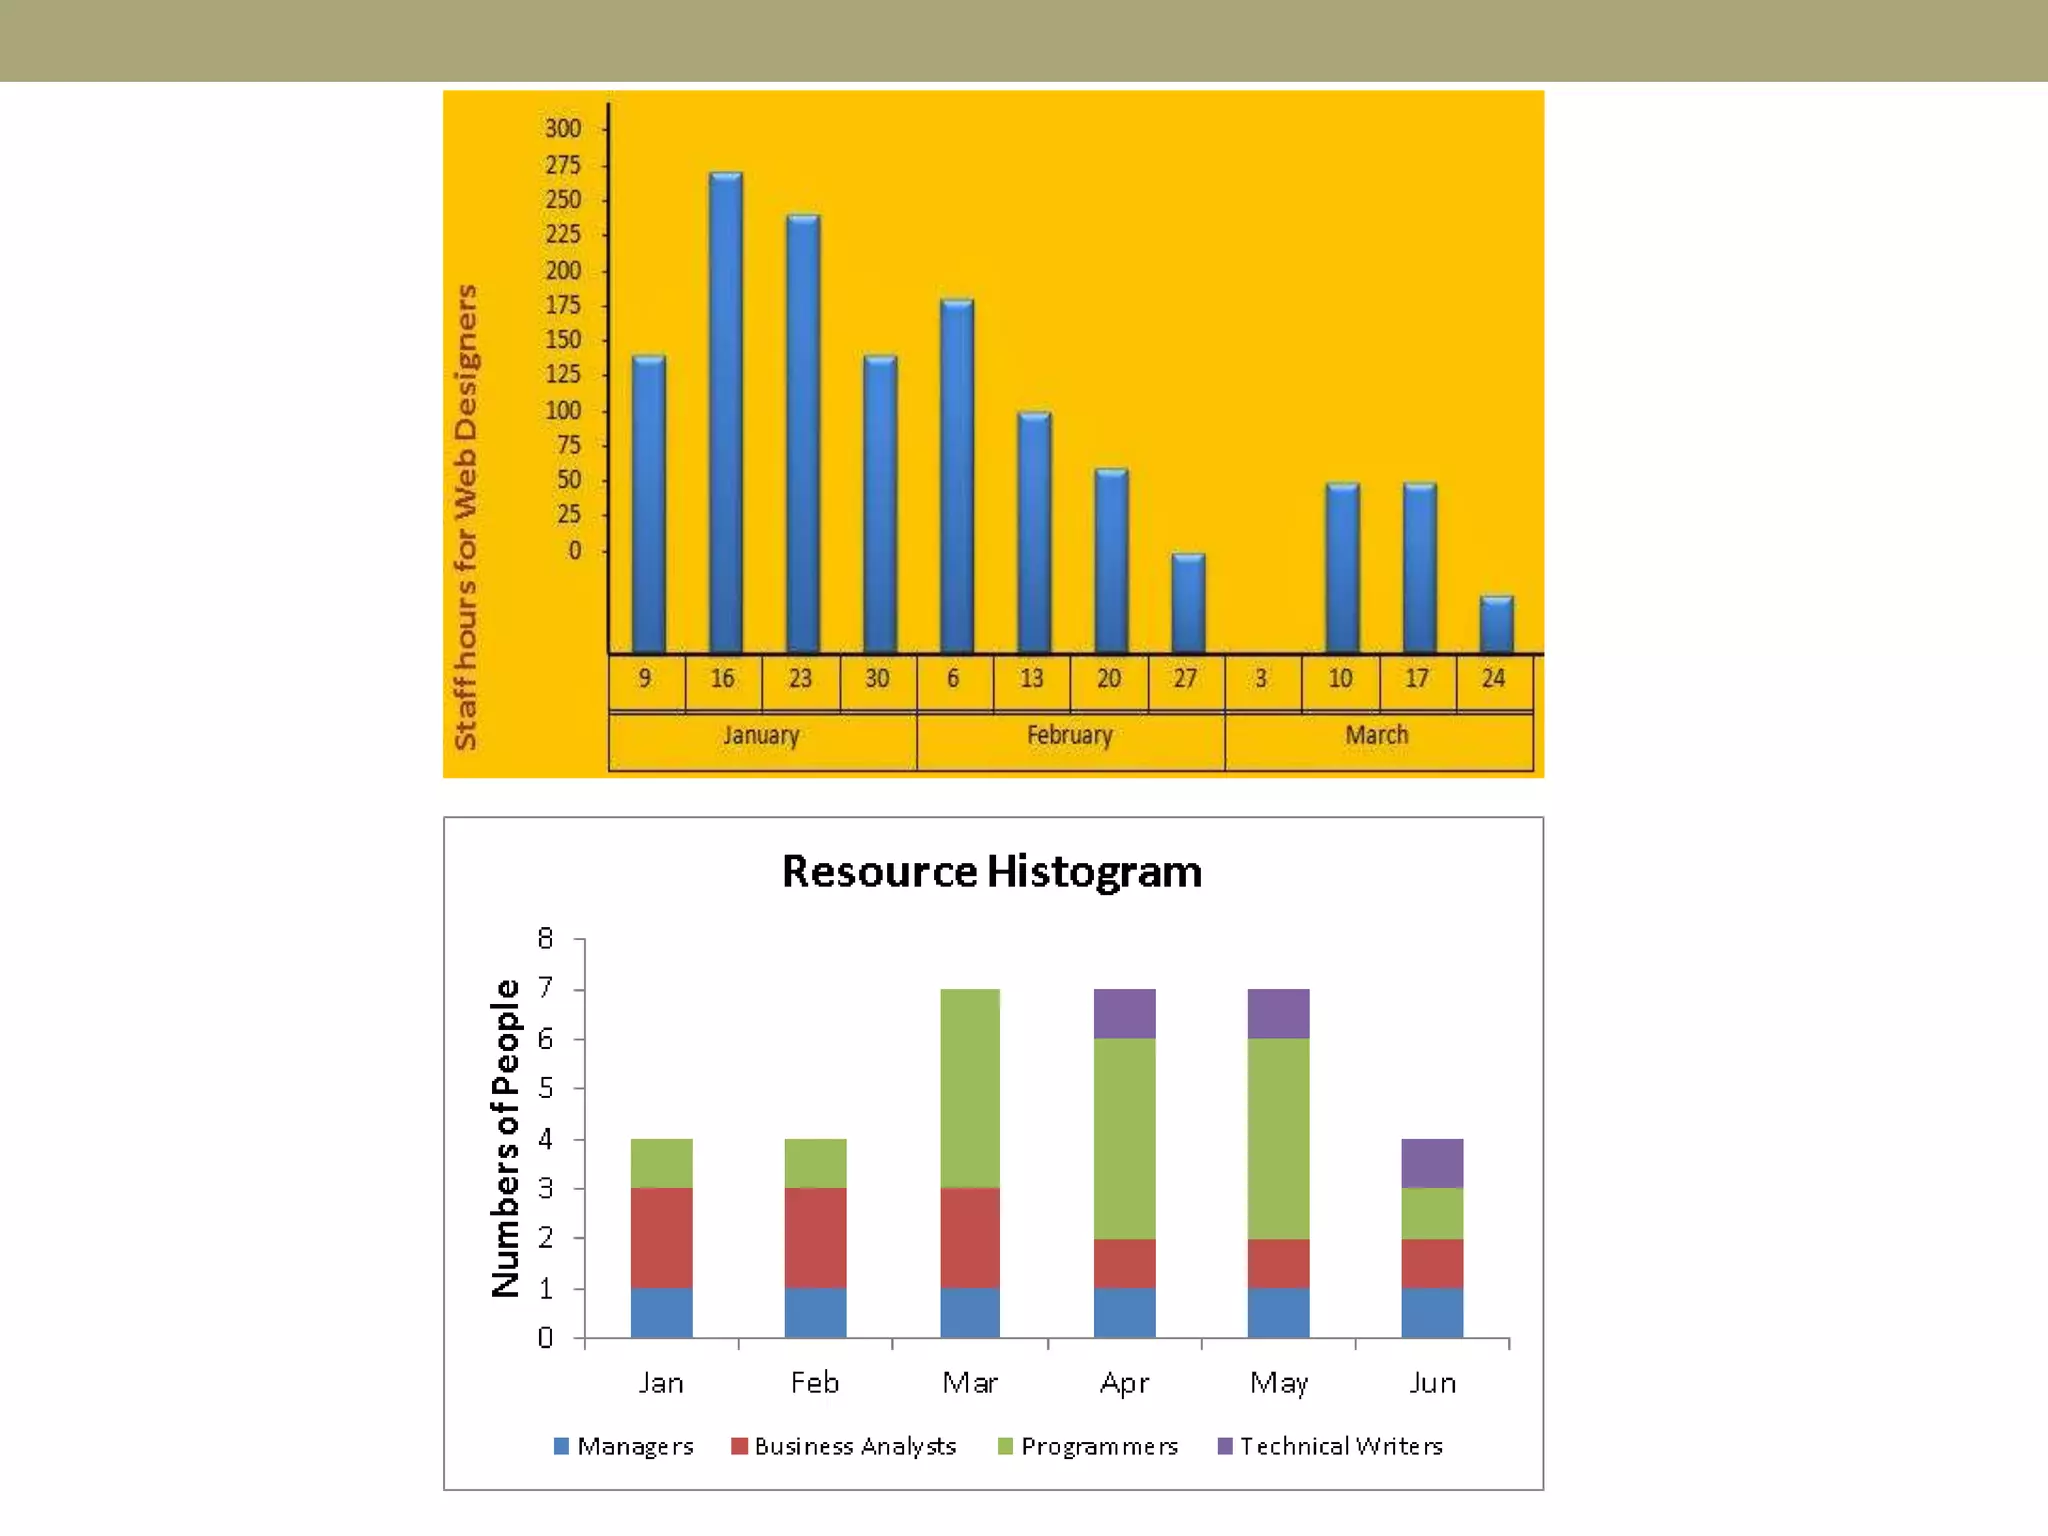
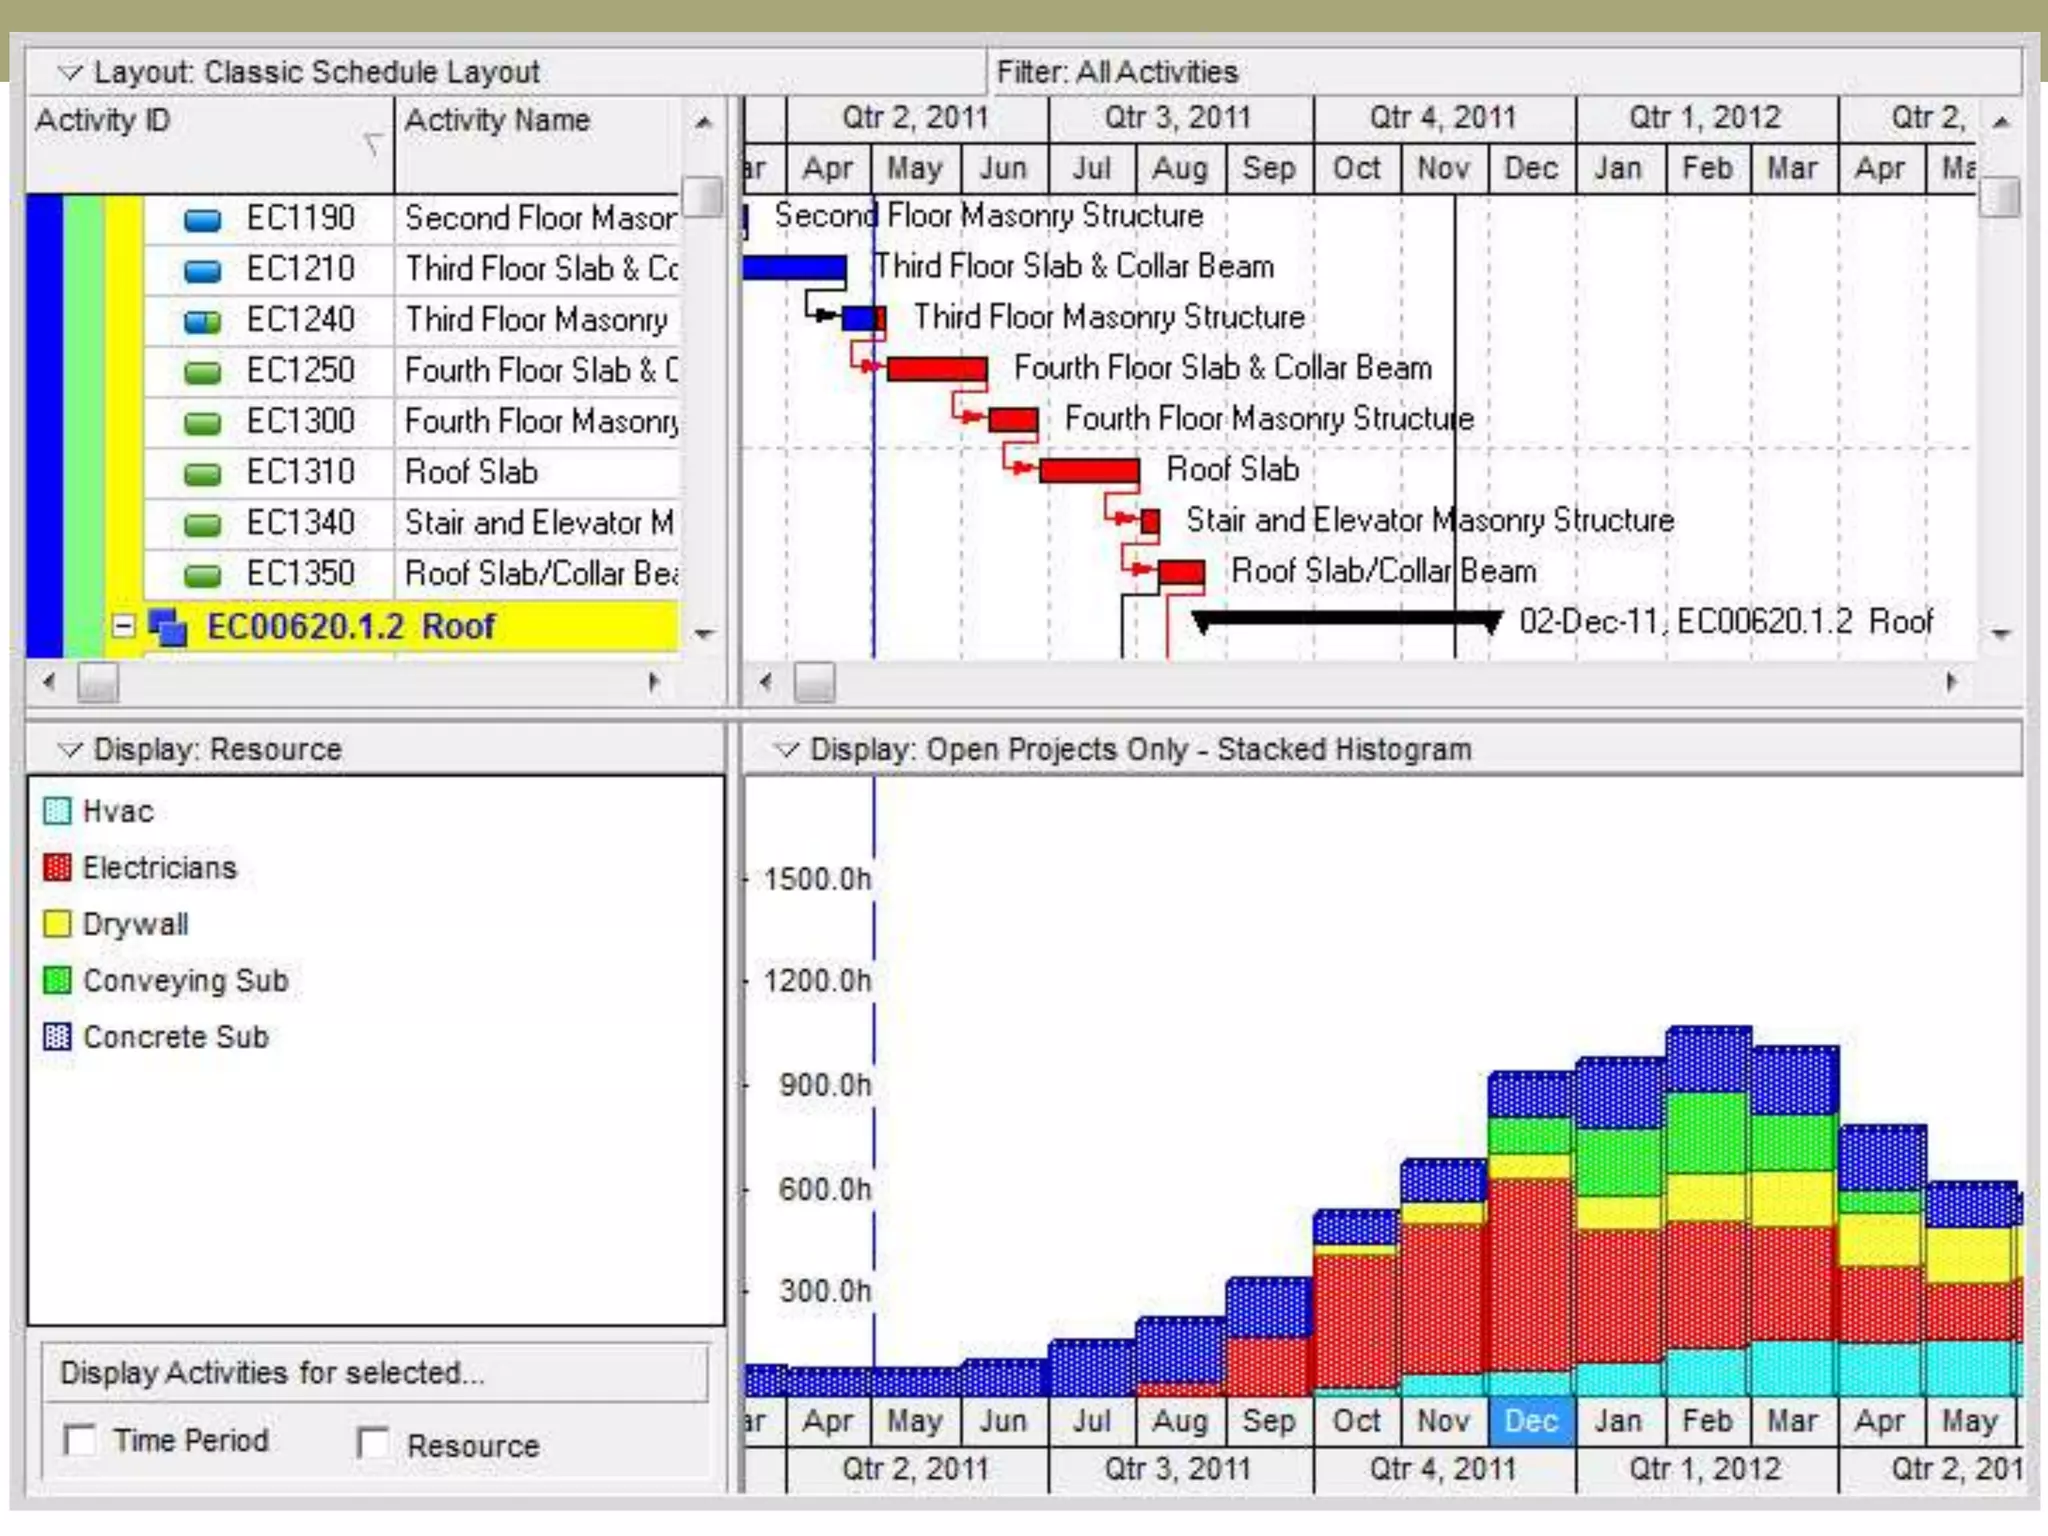
RESOURCE HISTOGRAM
Itis a graphical
representation of time on X-
axis and resources on Y-axis.
It is a view of project data in
which resource requirements,
usage, and availabilities are
shown against a time scale.
The personnel, equipment,
materials, and services
needed to complete tasks in
a project are resources.
40.
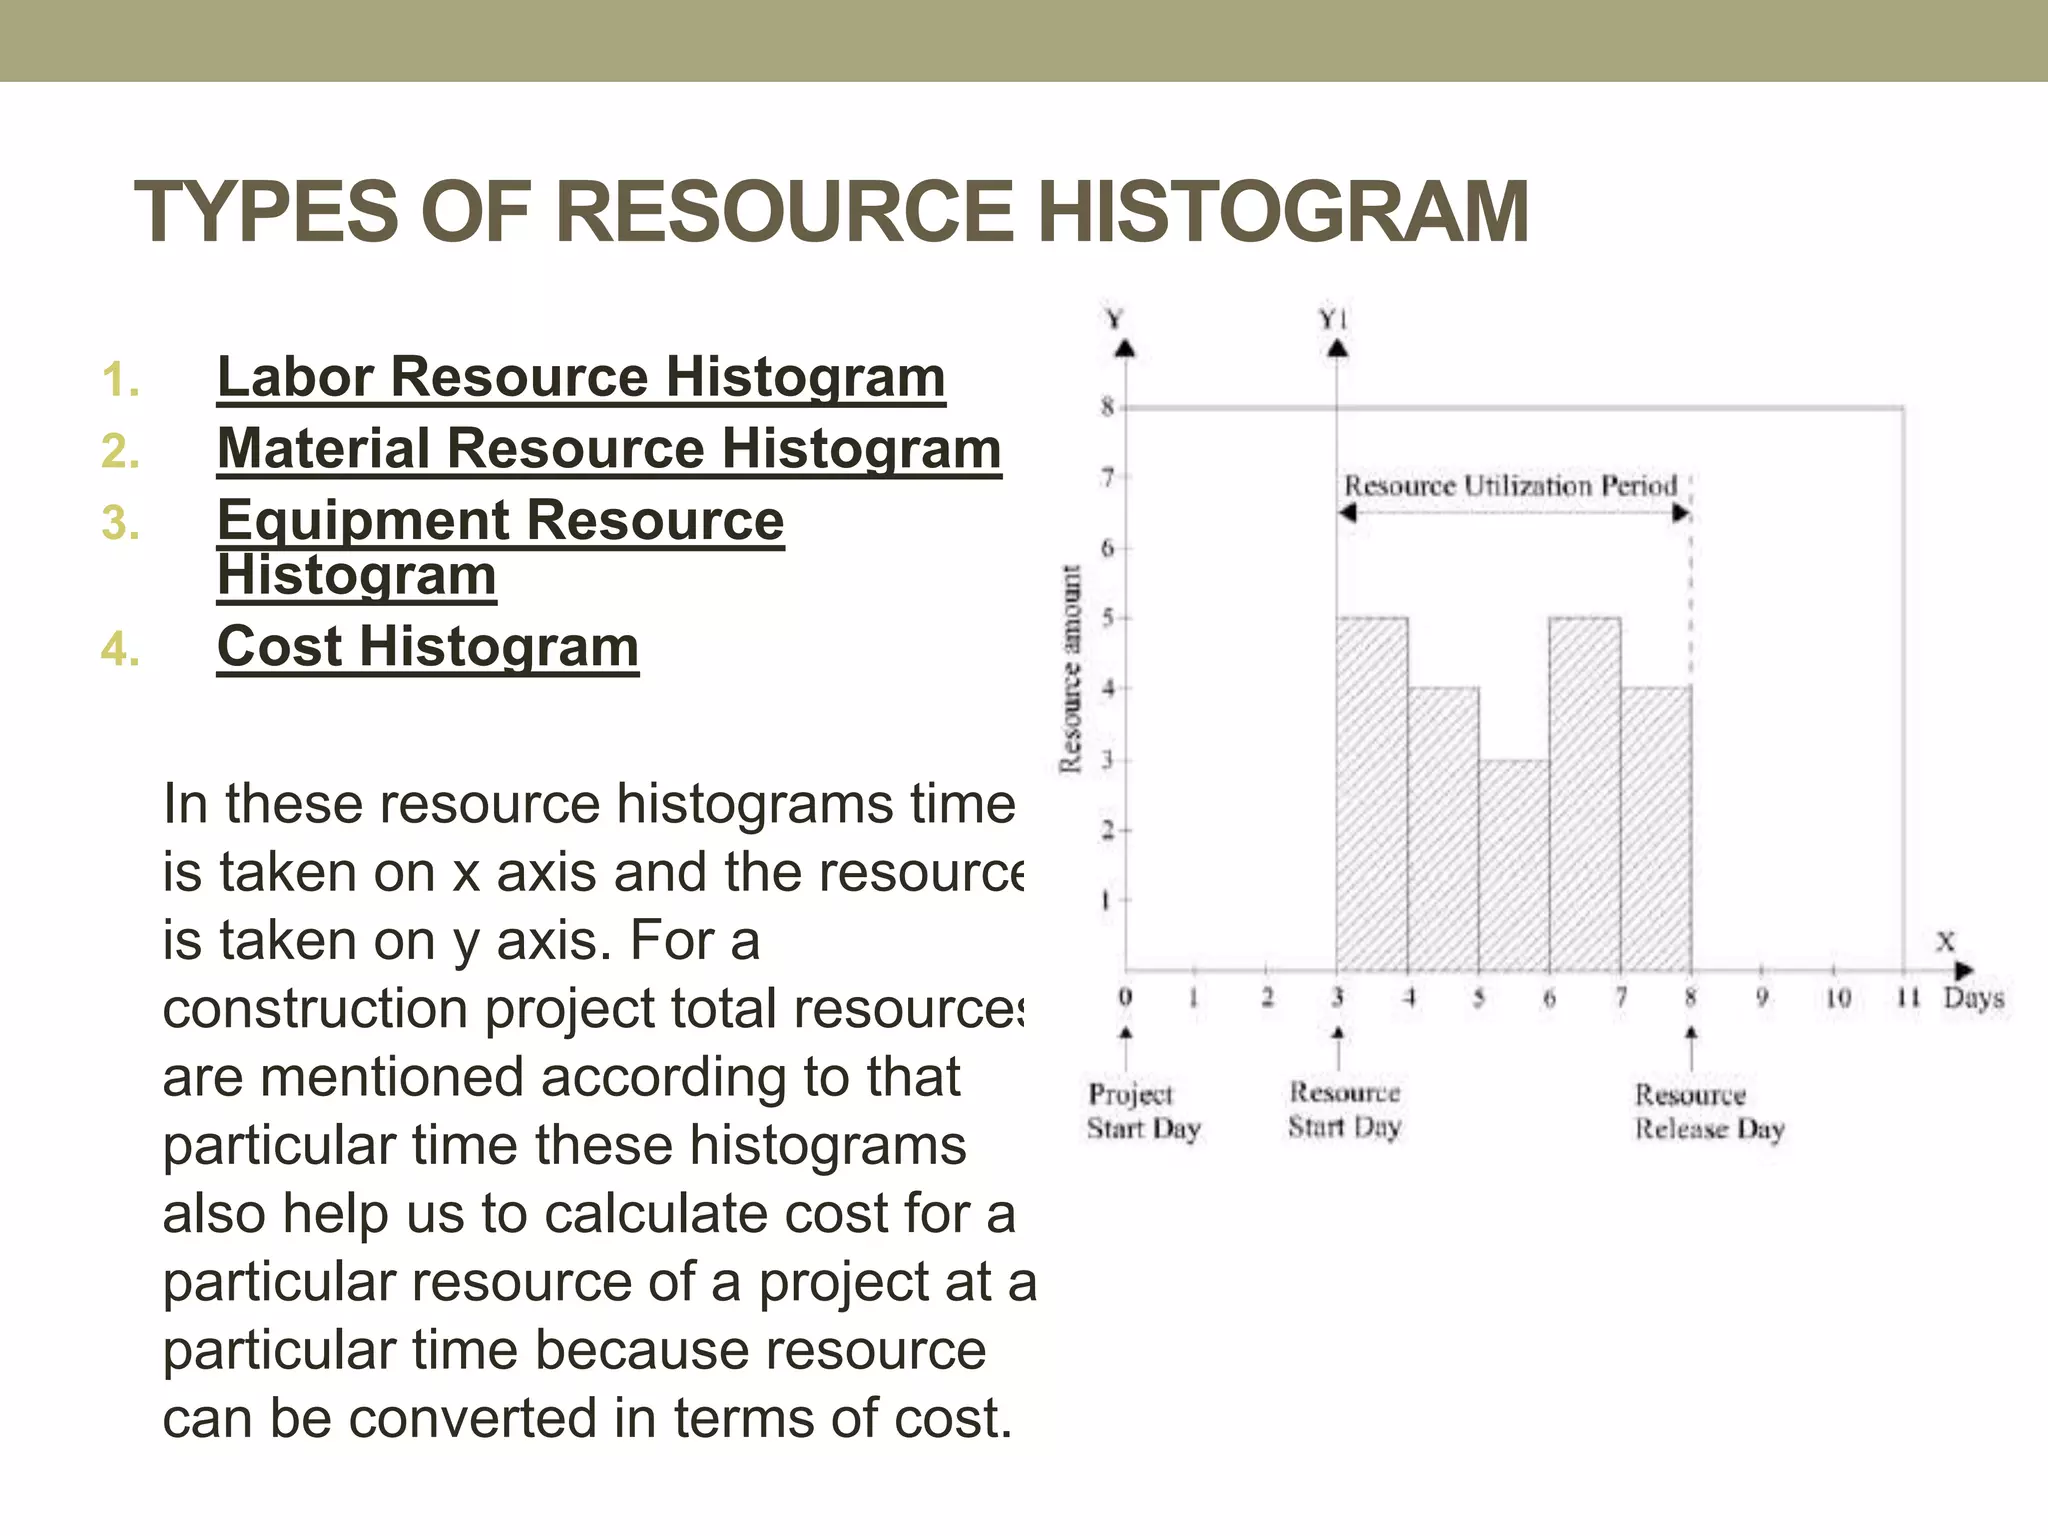
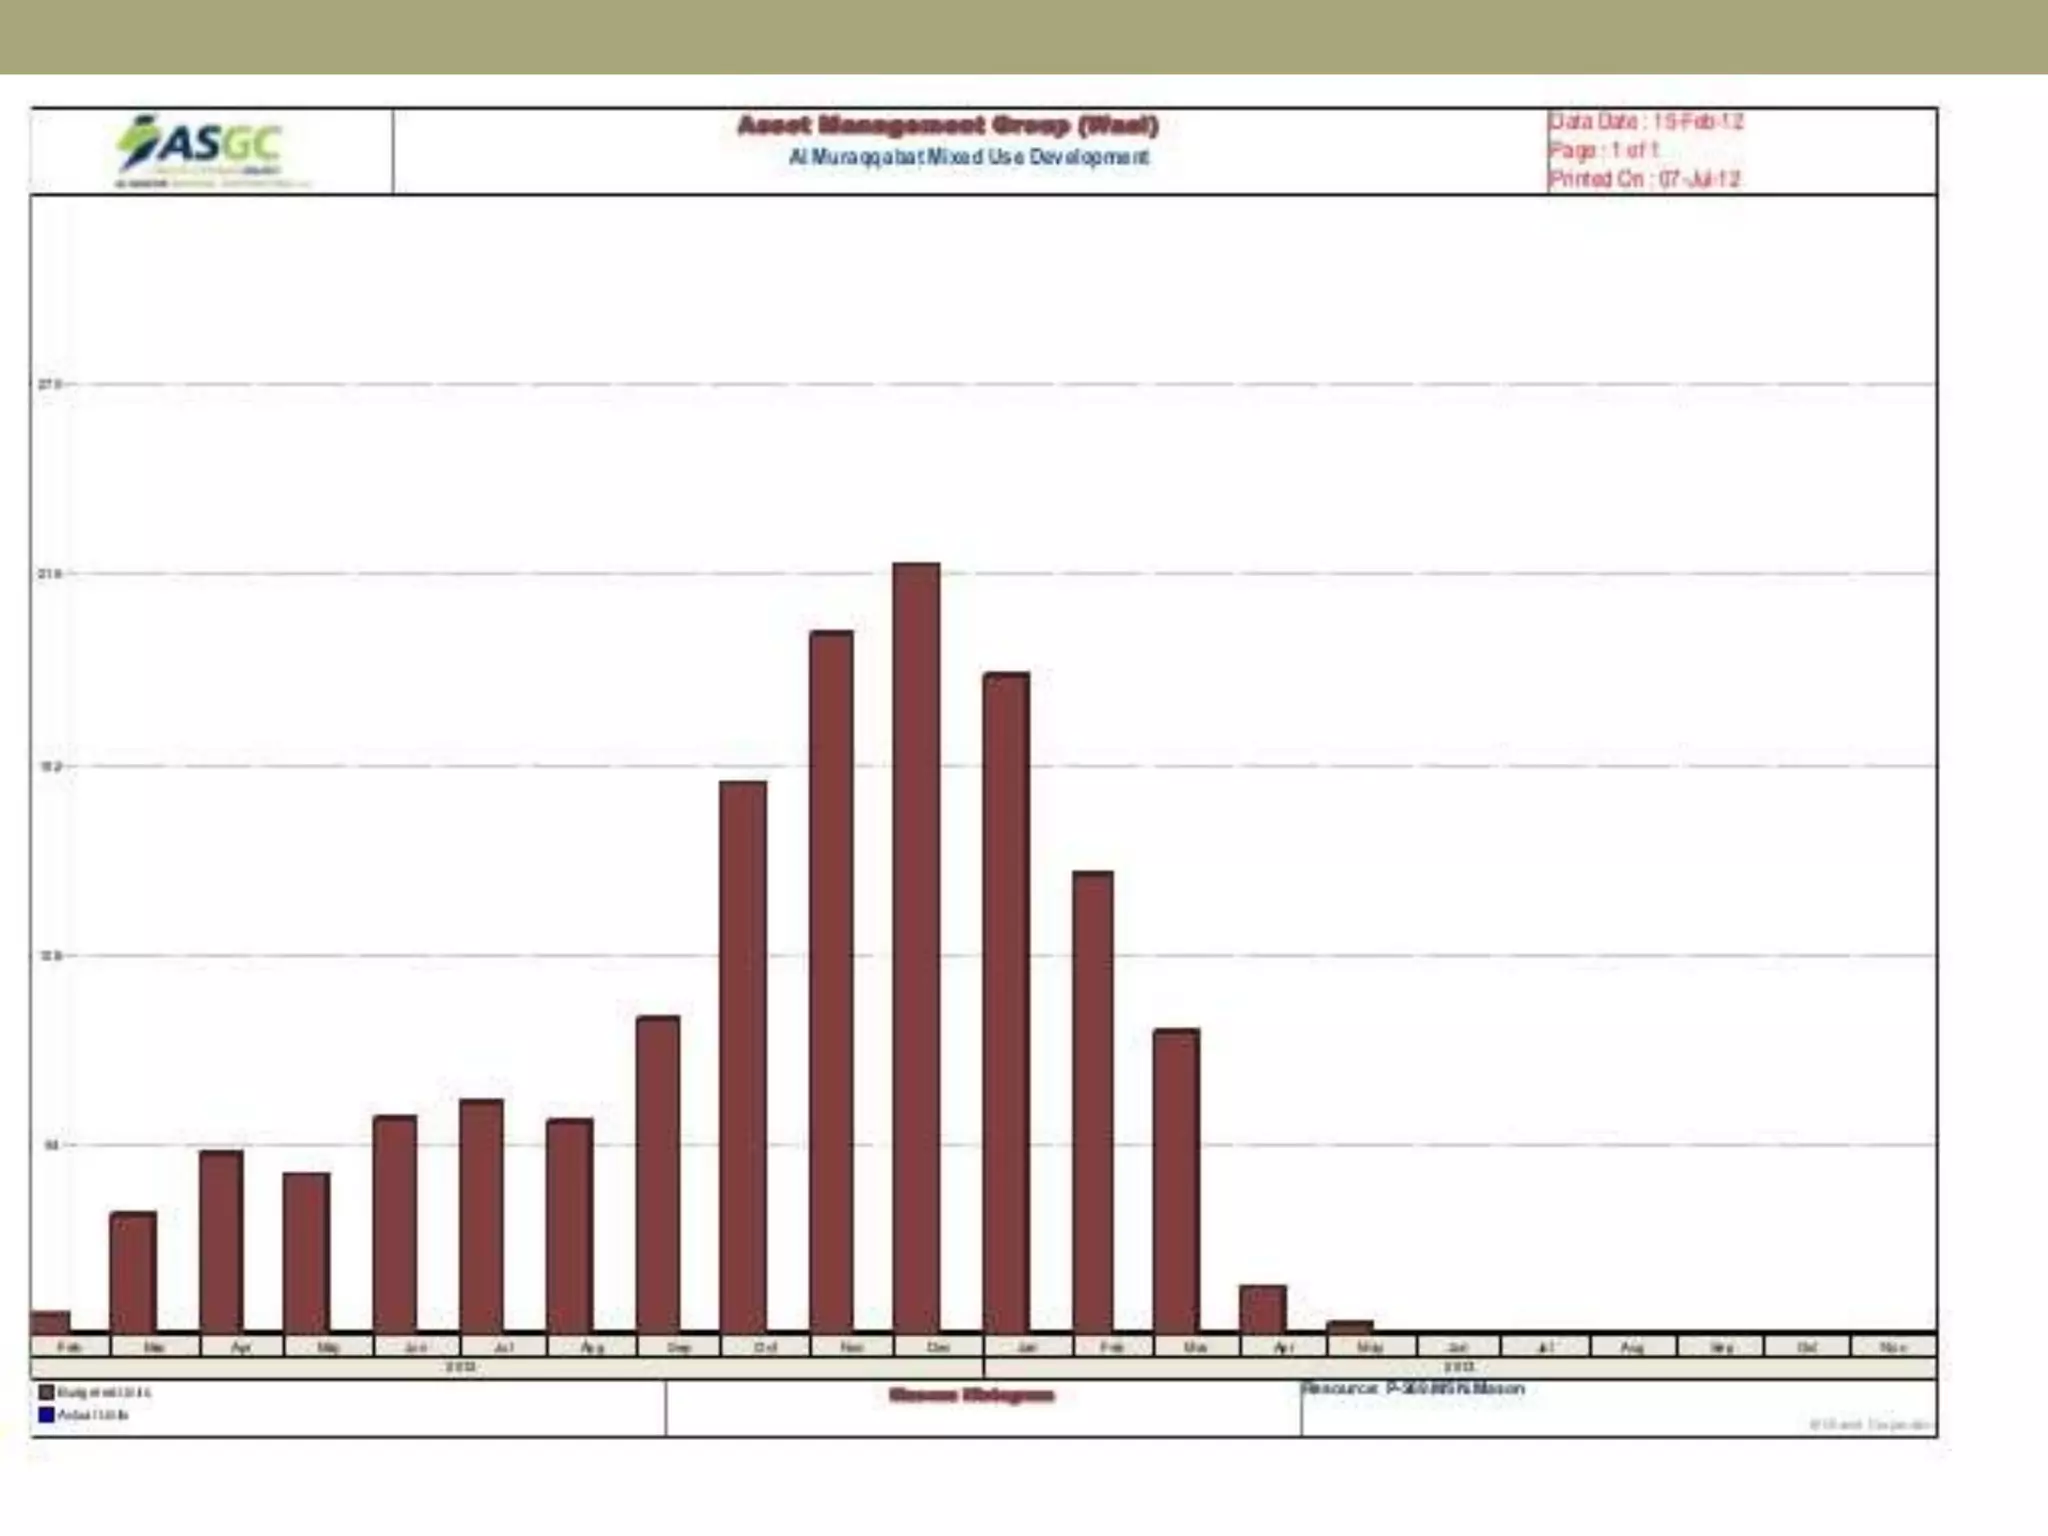
TYPES OF RESOURCEHISTOGRAM
1. Labor Resource Histogram
2. Material Resource Histogram
3. Equipment Resource
Histogram
4. Cost Histogram
In these resource histograms time
is taken on x axis and the resource
is taken on y axis. For a
construction project total resources
are mentioned according to that
particular time these histograms
also help us to calculate cost for a
particular resource of a project at a
particular time because resource
can be converted in terms of cost.
41.
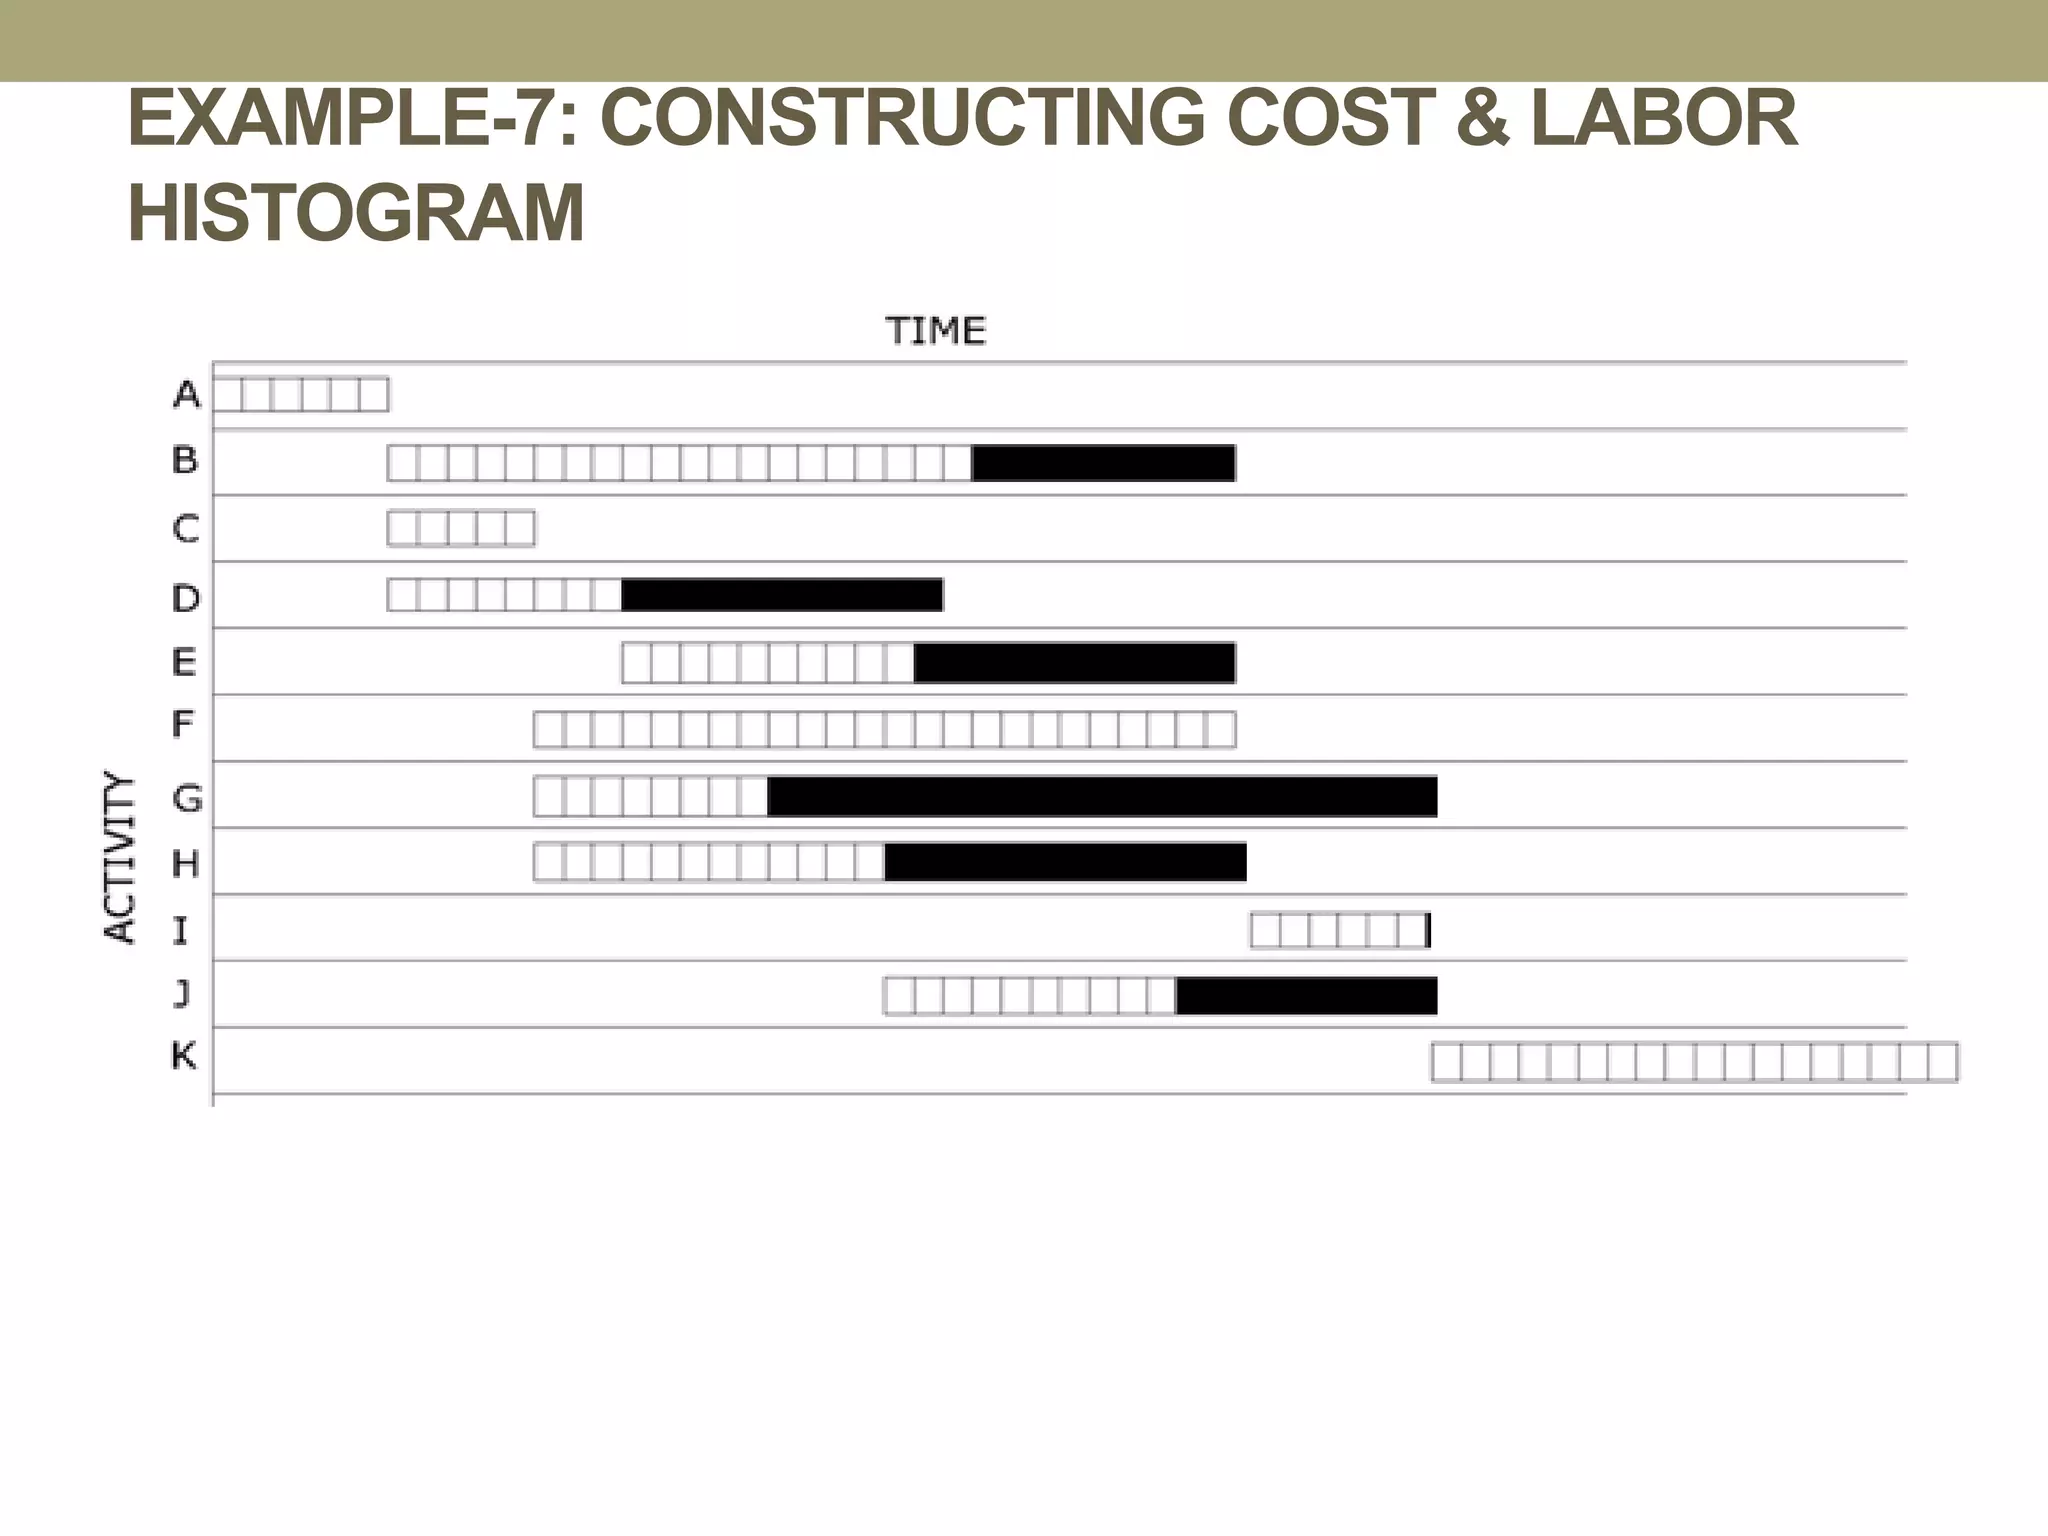
PROCEDURE FOR RESOURCELEVELING
1. Plan and Schedule project activities.
2. Construct a Network for the project.
3. Mark Critical Path (CP).
4. Construct the Bar Chart for the Project.
5. For each working day show resources of each activity at
their respective duration on Bar Chart.
6. Sum up the total resources vertically for each working day.
7. Plot the histogram for the resource.
8. Mark the sudden drop or rise in resource histogram.
9. Utilize the total float available for non critical activity to
level the resources by hit & trial method.
10. Recheck the leveled histogram and prepare a new
schedule of work / execution.
42.
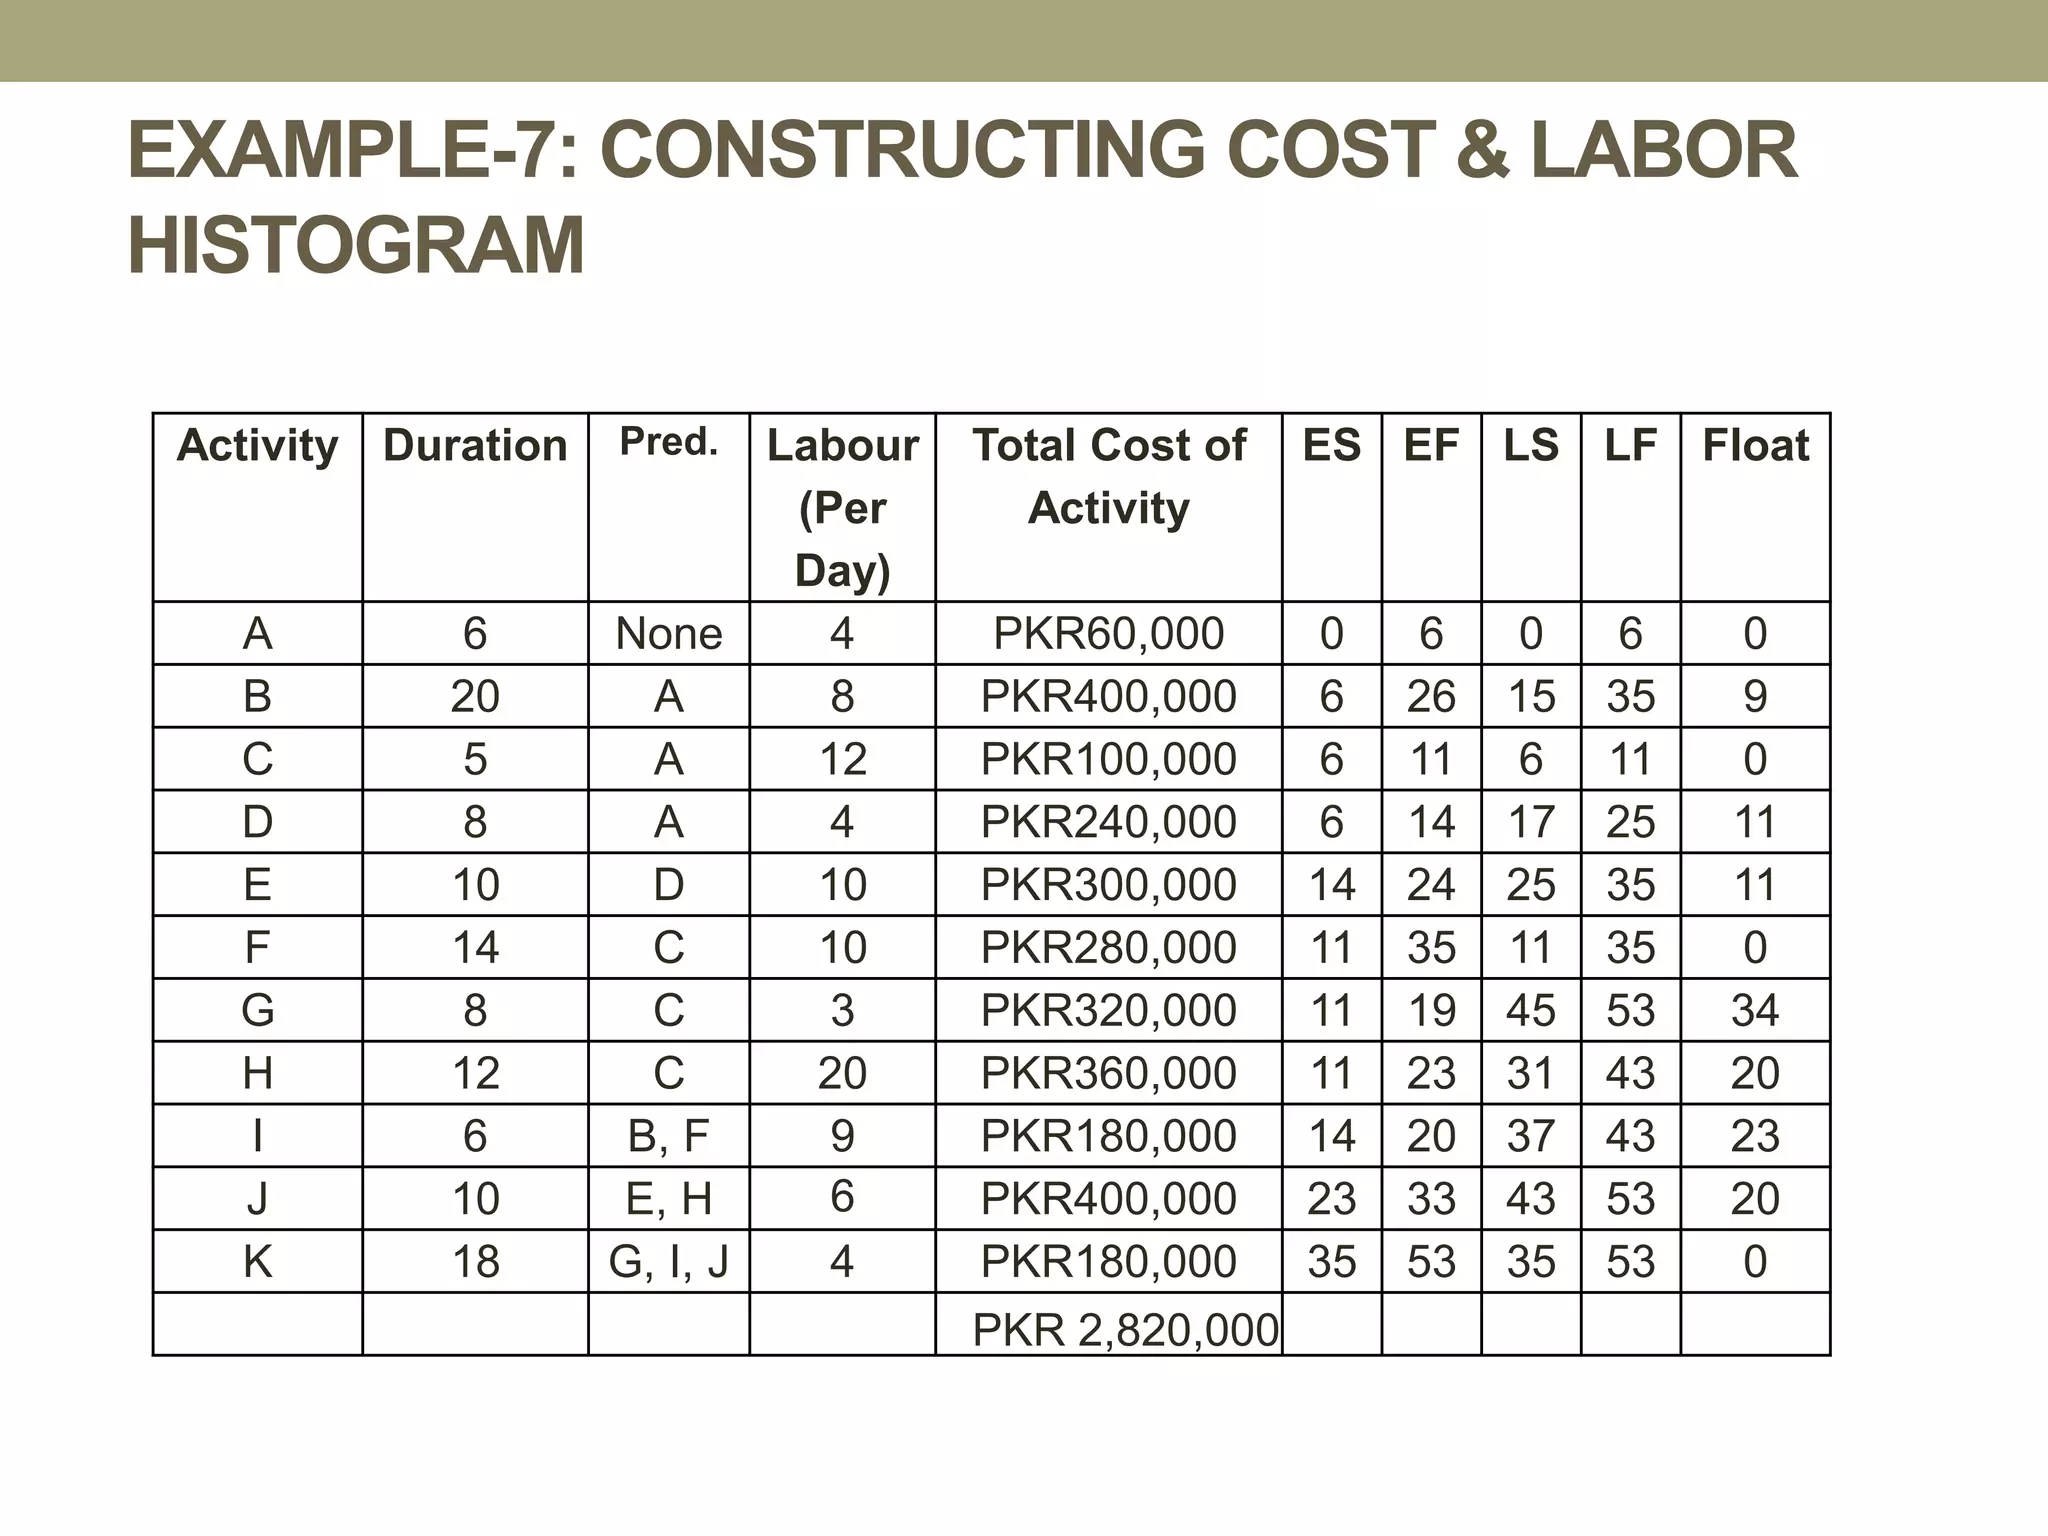
Activity Duration Pred.Labour
(Per
Day)
Total Cost of
Activity
ES EF LS LF Float
A 6 None 4 PKR60,000 0 6 0 6 0
B 20 A 8 PKR400,000 6 26 15 35 9
C 5 A 12 PKR100,000 6 11 6 11 0
D 8 A 4 PKR240,000 6 14 17 25 11
E 10 D 10 PKR300,000 14 24 25 35 11
F 14 C 10 PKR280,000 11 35 11 35 0
G 8 C 3 PKR320,000 11 19 45 53 34
H 12 C 20 PKR360,000 11 23 31 43 20
I 6 B, F 9 PKR180,000 14 20 37 43 23
J 10 E, H 6 PKR400,000 23 33 43 53 20
K 18 G, I, J 4 PKR180,000 35 53 35 53 0
PKR 2,820,000
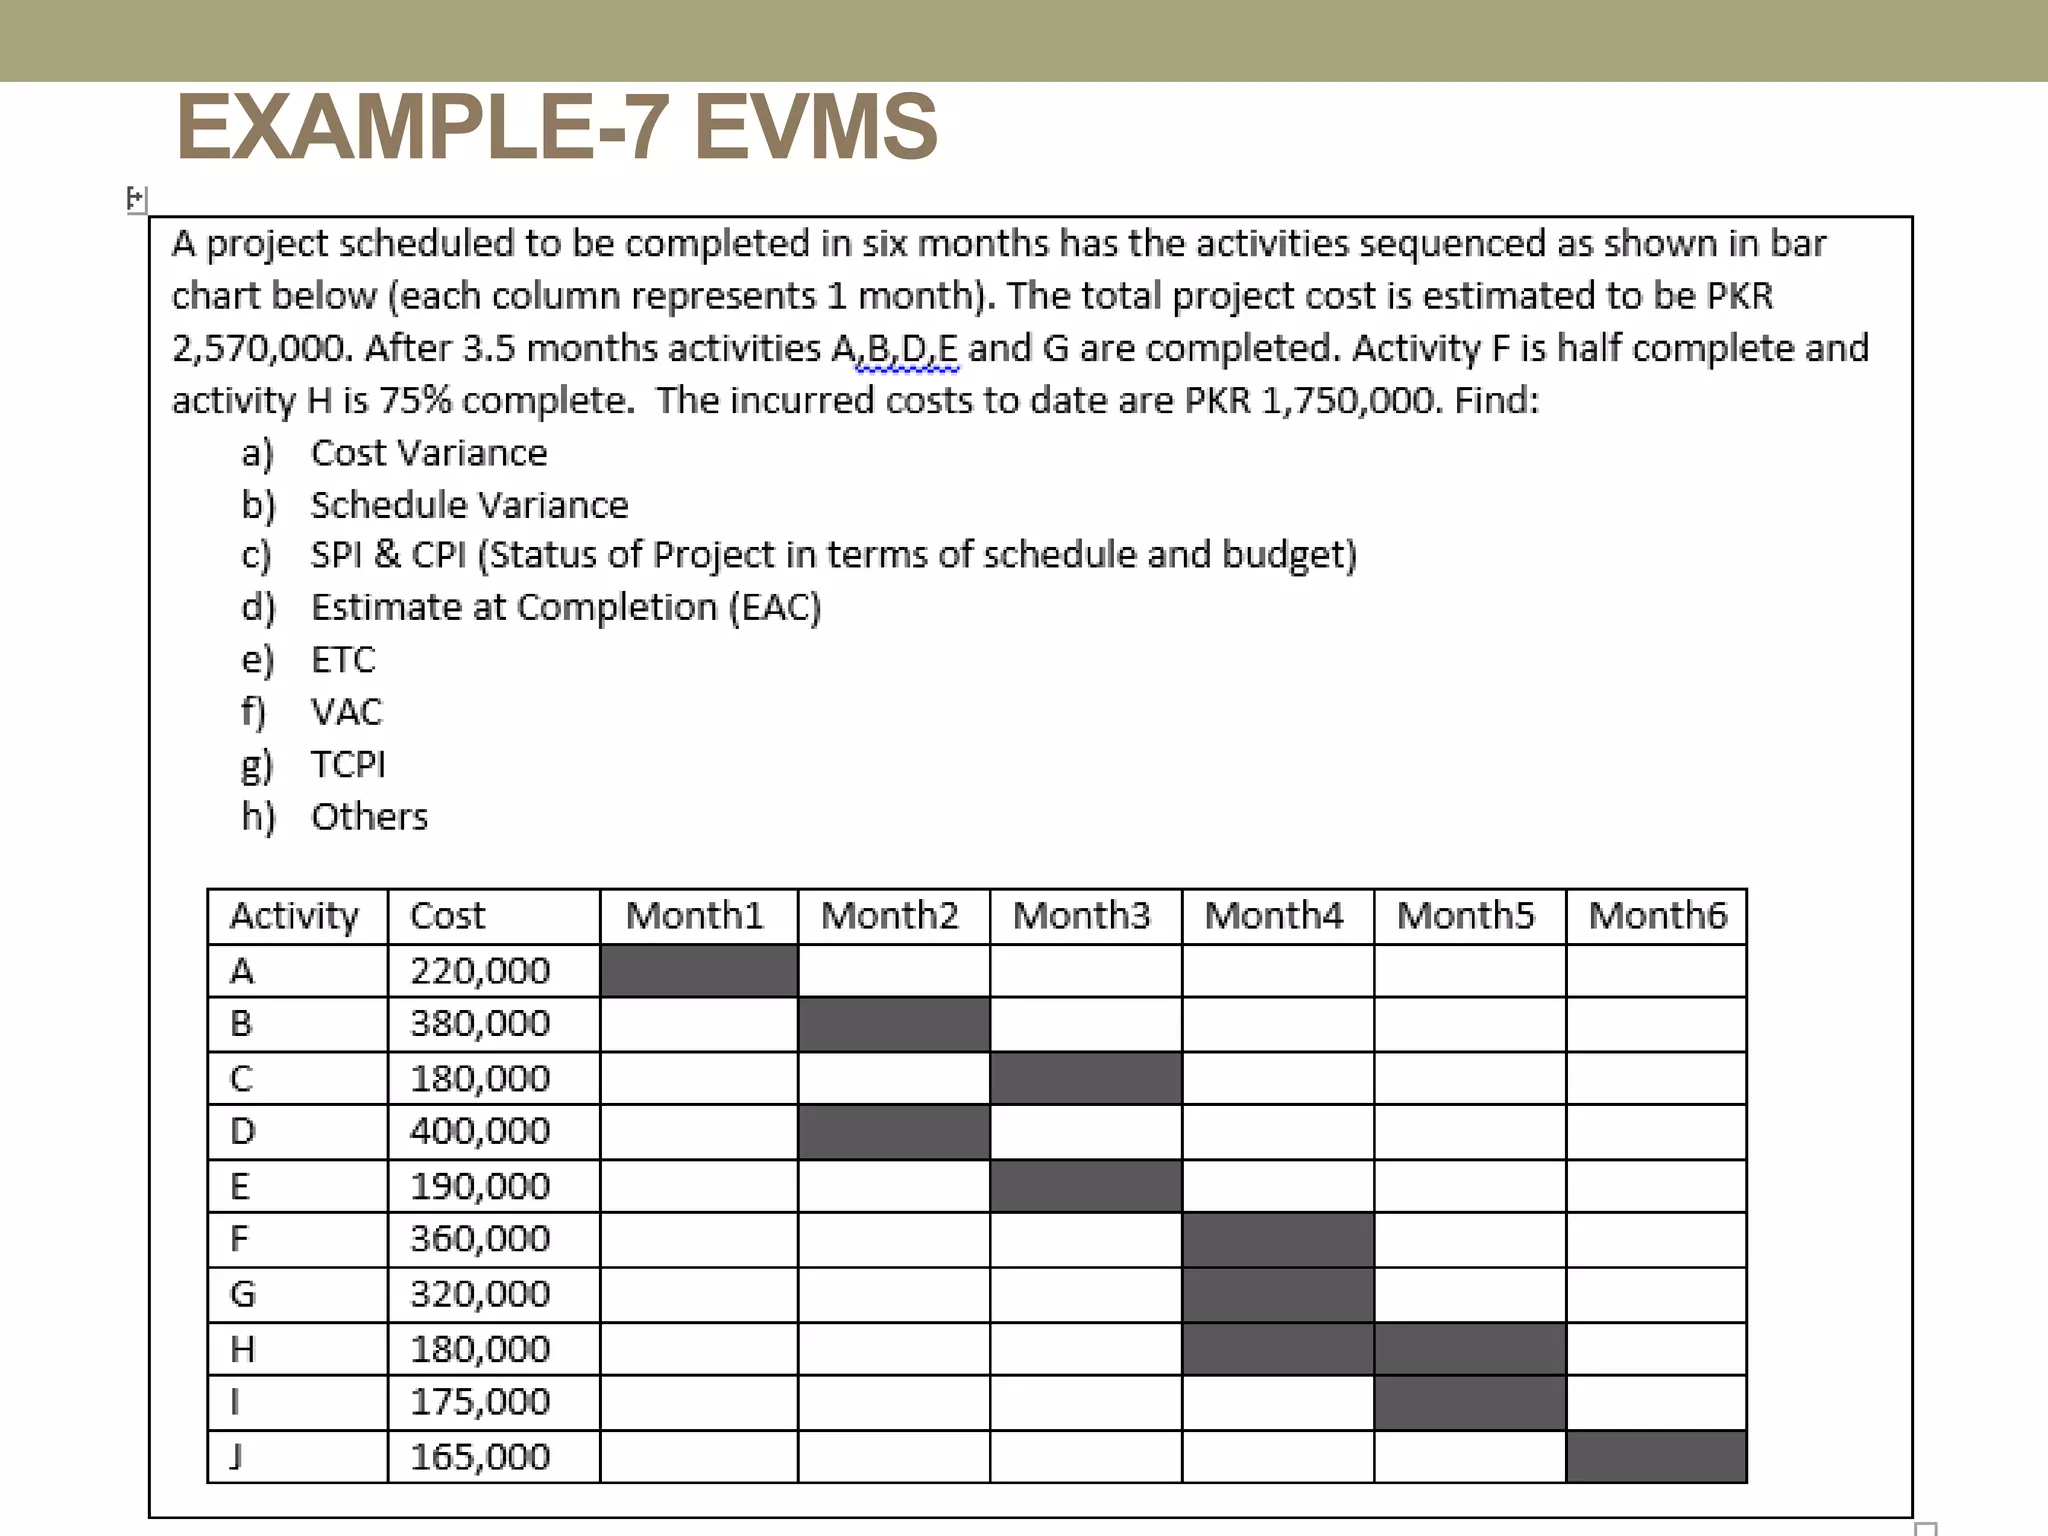
EXAMPLE-7: CONSTRUCTING COST & LABOR
HISTOGRAM
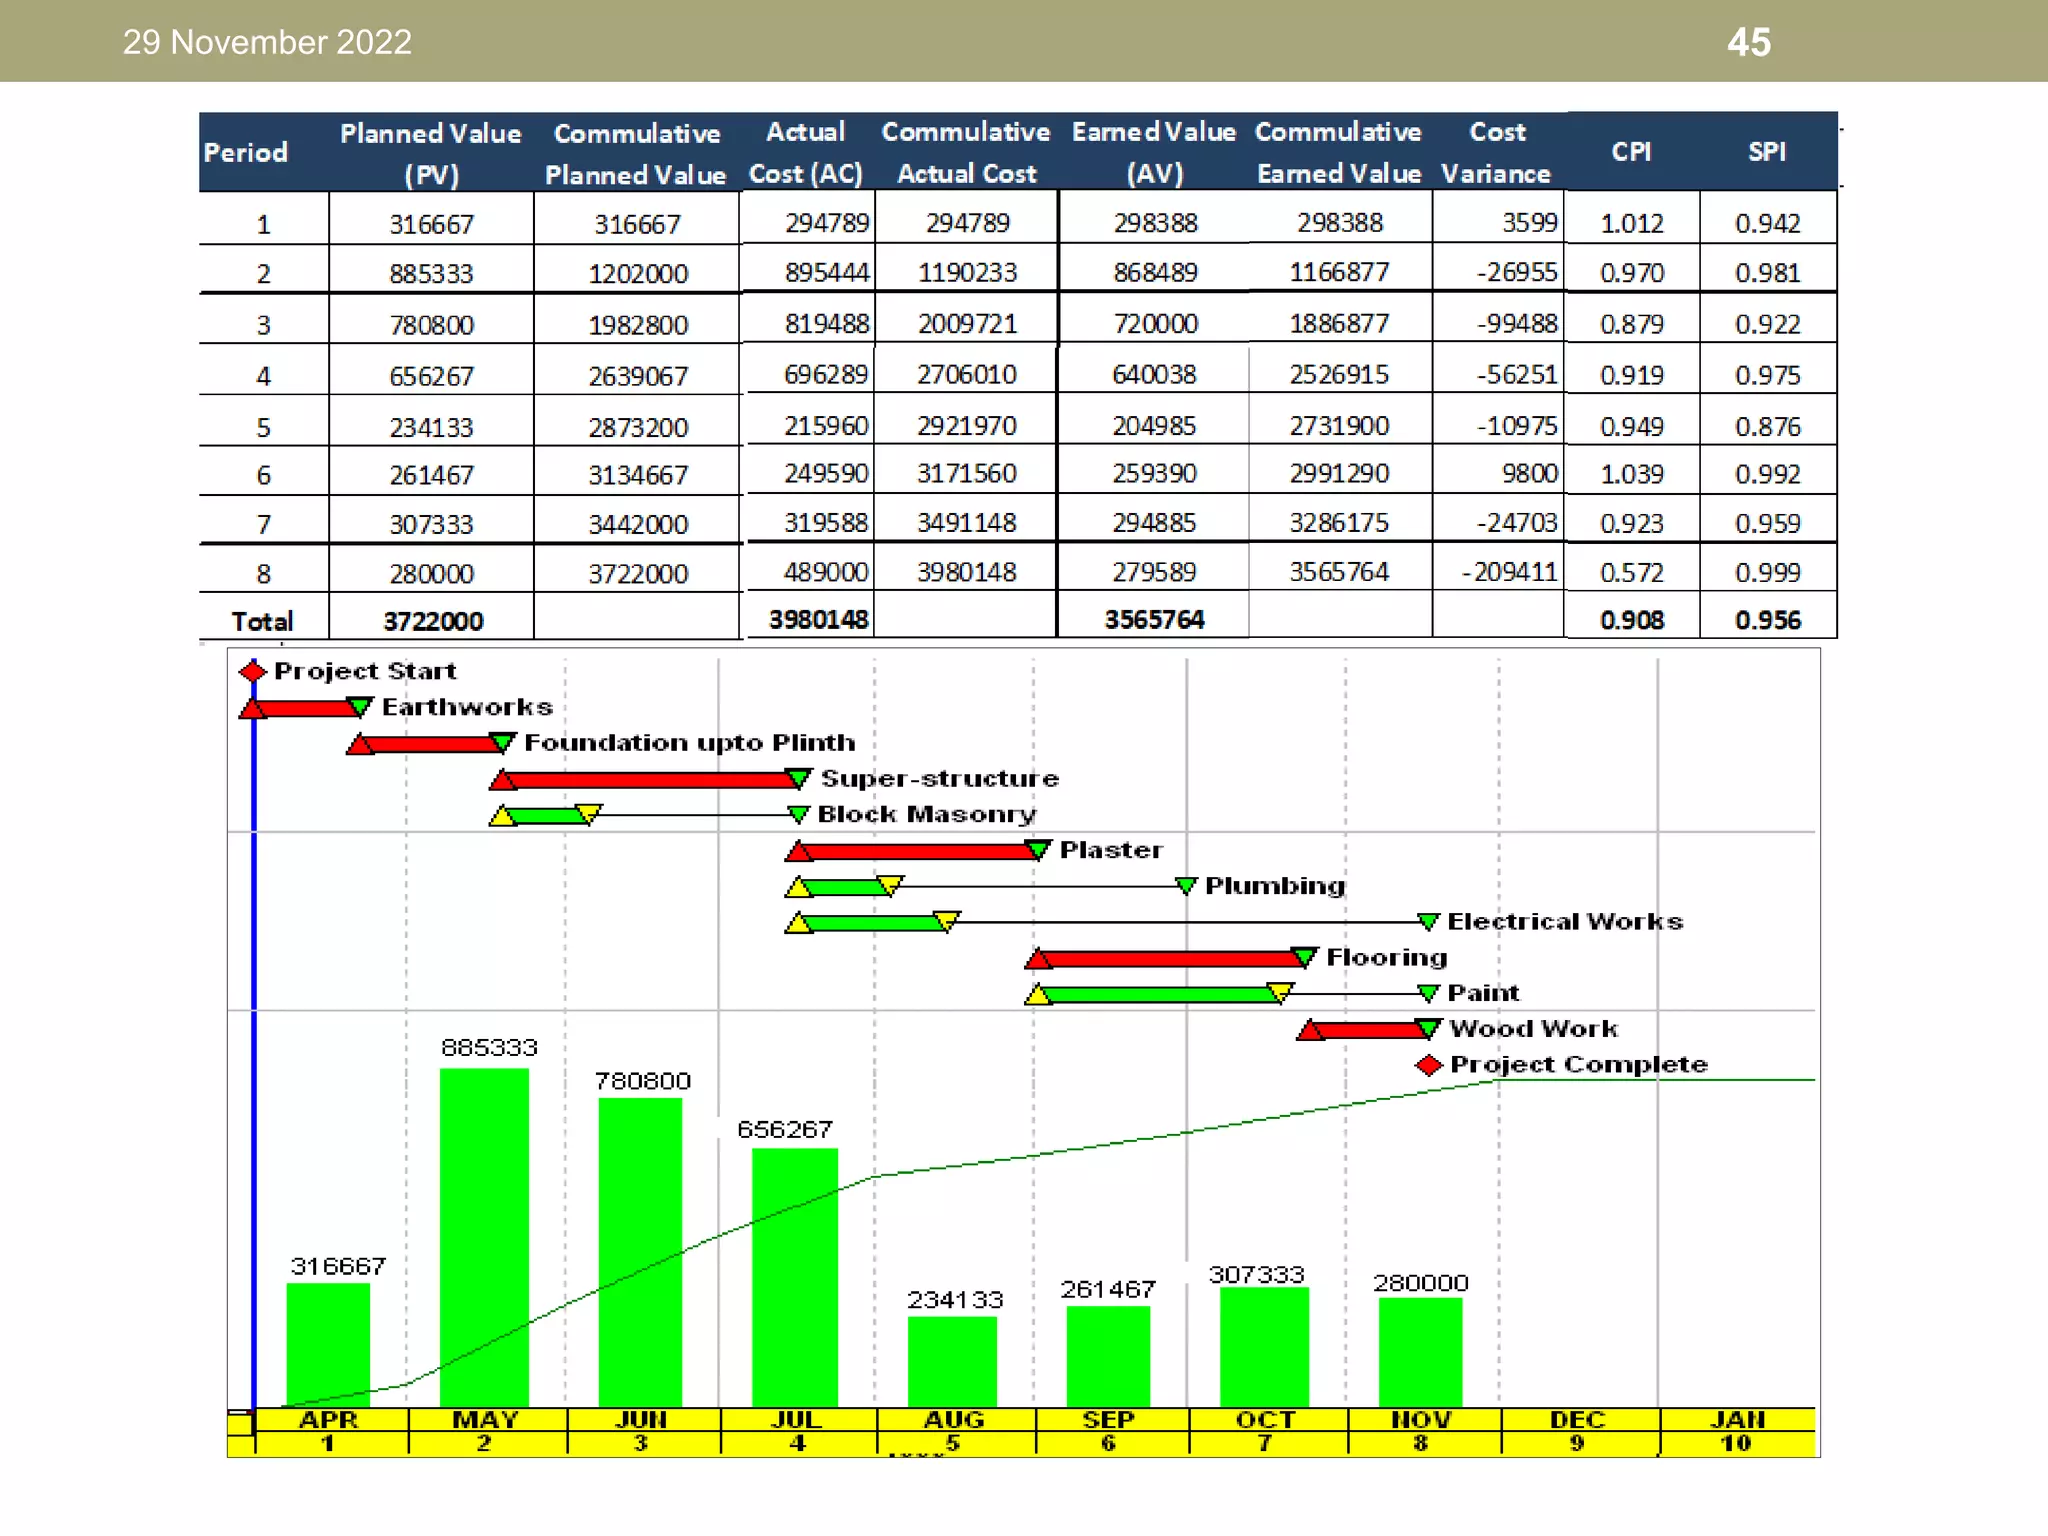
EARNED VALUE MANAGEMENTSYSTEM
(EVMS)
52
• EVM is a project performance measurement
technique that integrates scope, time, and cost
data.
• Given a baseline (original plan plus approved
changes), you can determine how well the project is
meeting its goals.
• You must enter actual information periodically to
use EVM.
• More and more organizations around the world are
using EVM to help control project costs.
53.
EARNED VALUE MANAGEMENT
SYSTEM(EVMS)
• It’s a Management Tool
– Used for project status: (1) previous work
accomplished and (2) where the project was
planned to be.
– Early warning system to detect deficient or
endangered progress.
54.
EARNED VALUE MANAGEMENTSYSTEM
(EVMS)
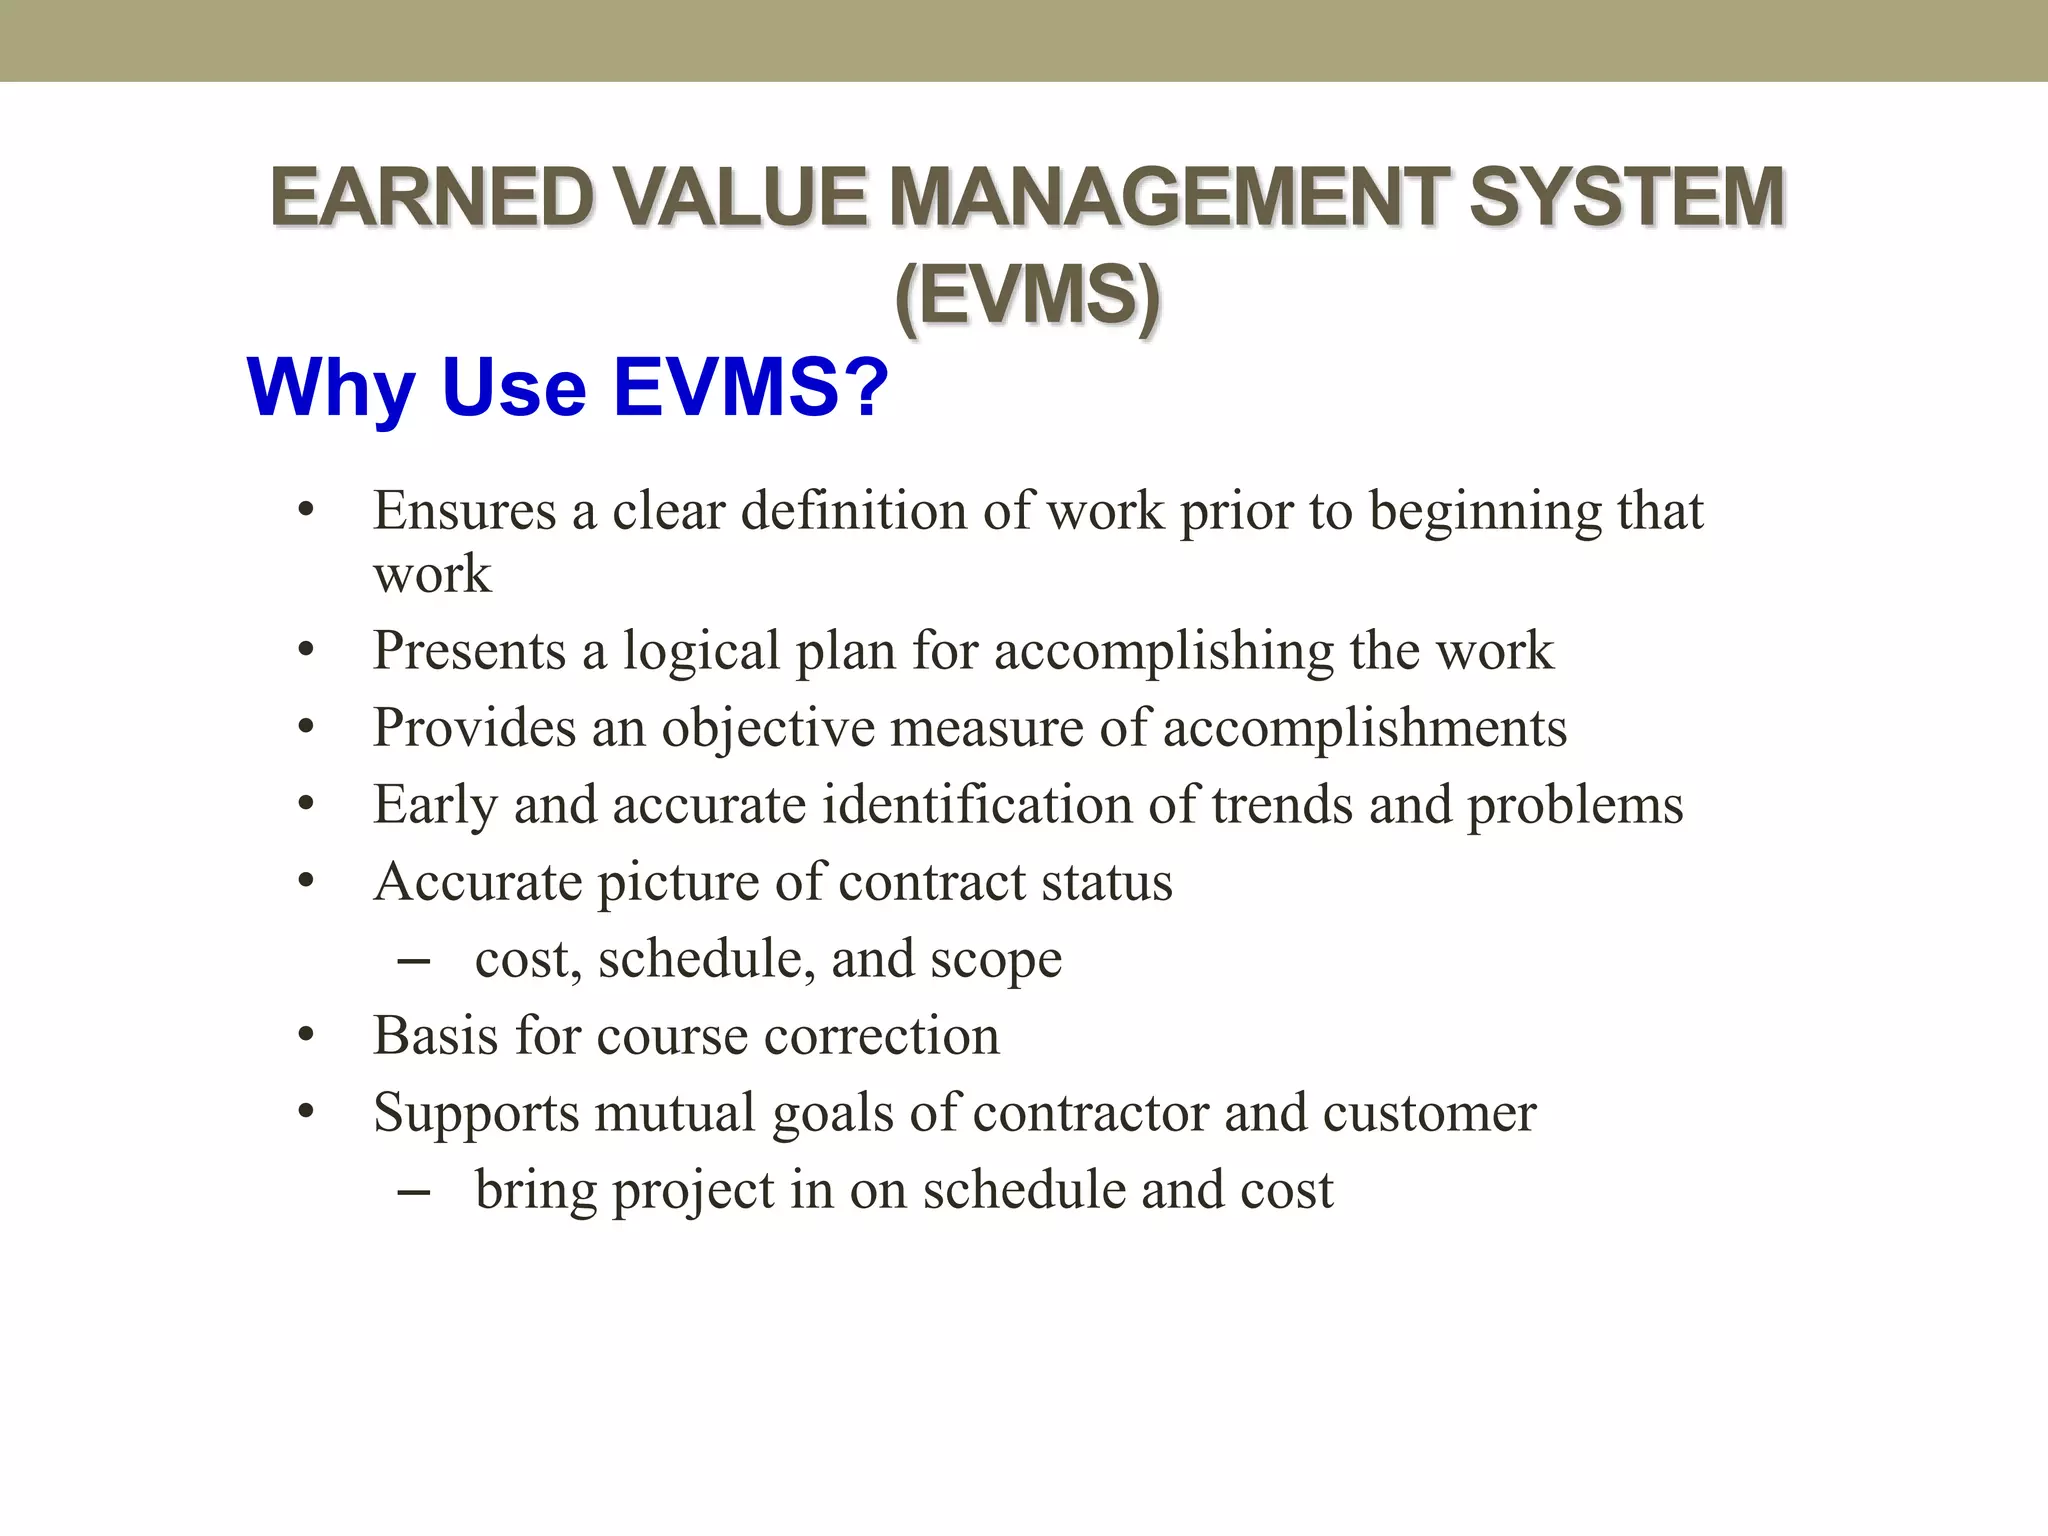
Why Use EVMS?
• Ensures a clear definition of work prior to beginning that
work
• Presents a logical plan for accomplishing the work
• Provides an objective measure of accomplishments
• Early and accurate identification of trends and problems
• Accurate picture of contract status
– cost, schedule, and scope
• Basis for course correction
• Supports mutual goals of contractor and customer
– bring project in on schedule and cost
55.
Earned Value ManagementSystem
(EVMS)
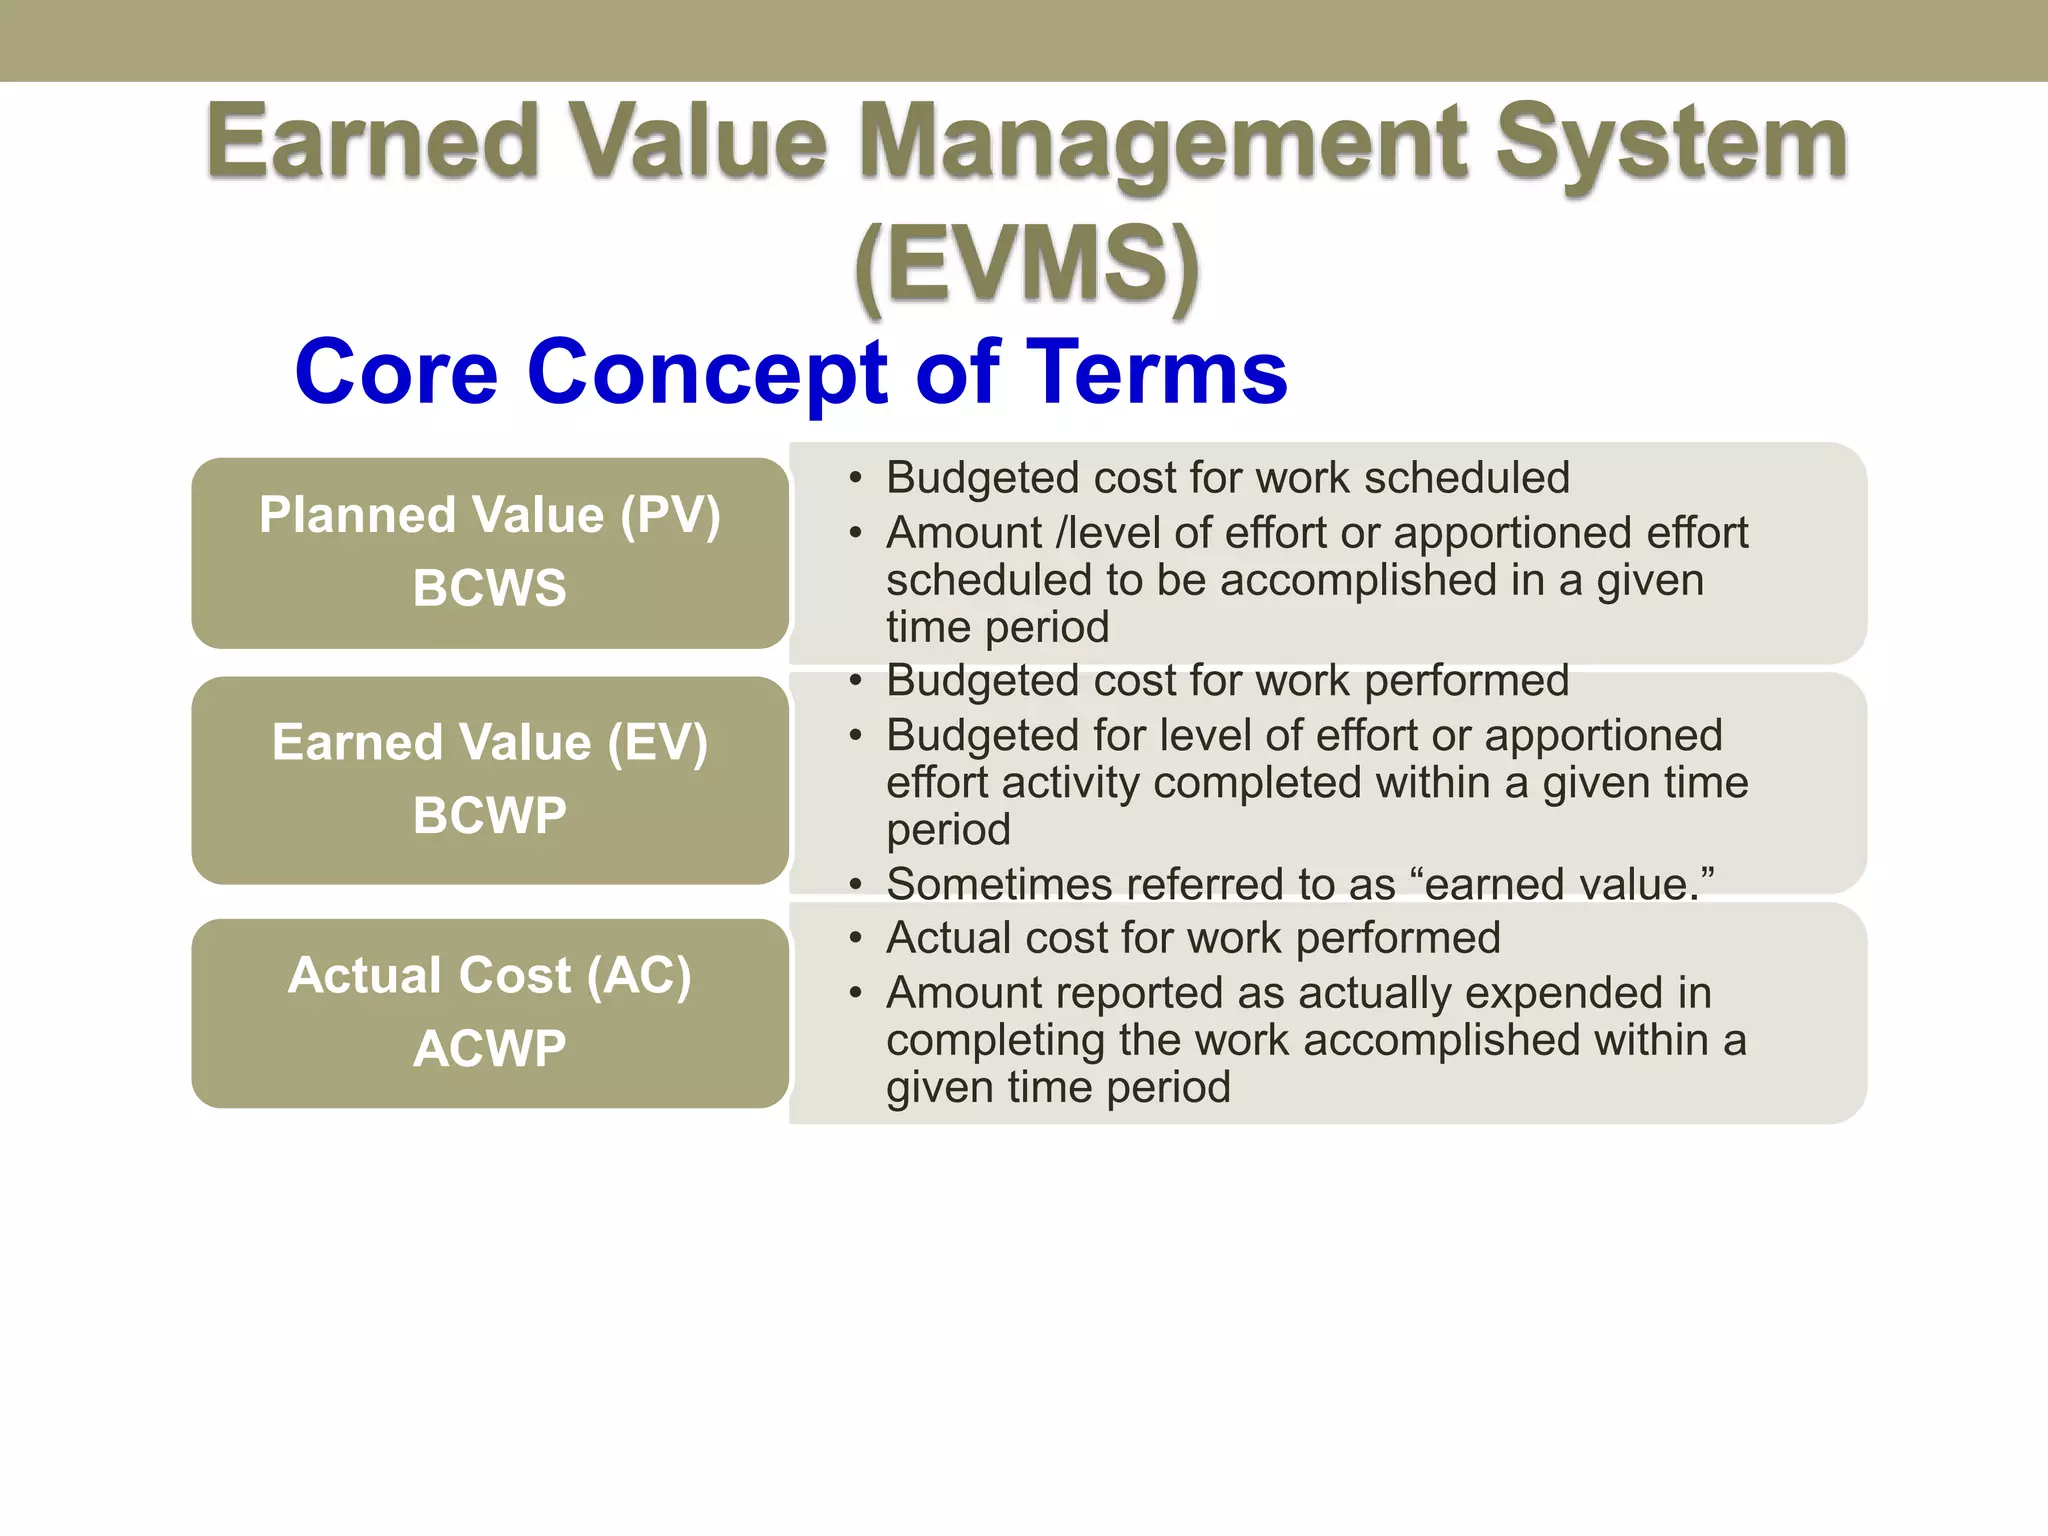
• Budgeted cost for work scheduled
• Amount /level of effort or apportioned effort
scheduled to be accomplished in a given
time period
Planned Value (PV)
BCWS
• Budgeted cost for work performed
• Budgeted for level of effort or apportioned
effort activity completed within a given time
period
• Sometimes referred to as “earned value.”
Earned Value (EV)
BCWP
• Actual cost for work performed
• Amount reported as actually expended in
completing the work accomplished within a
given time period
Actual Cost (AC)
ACWP
Core Concept of Terms
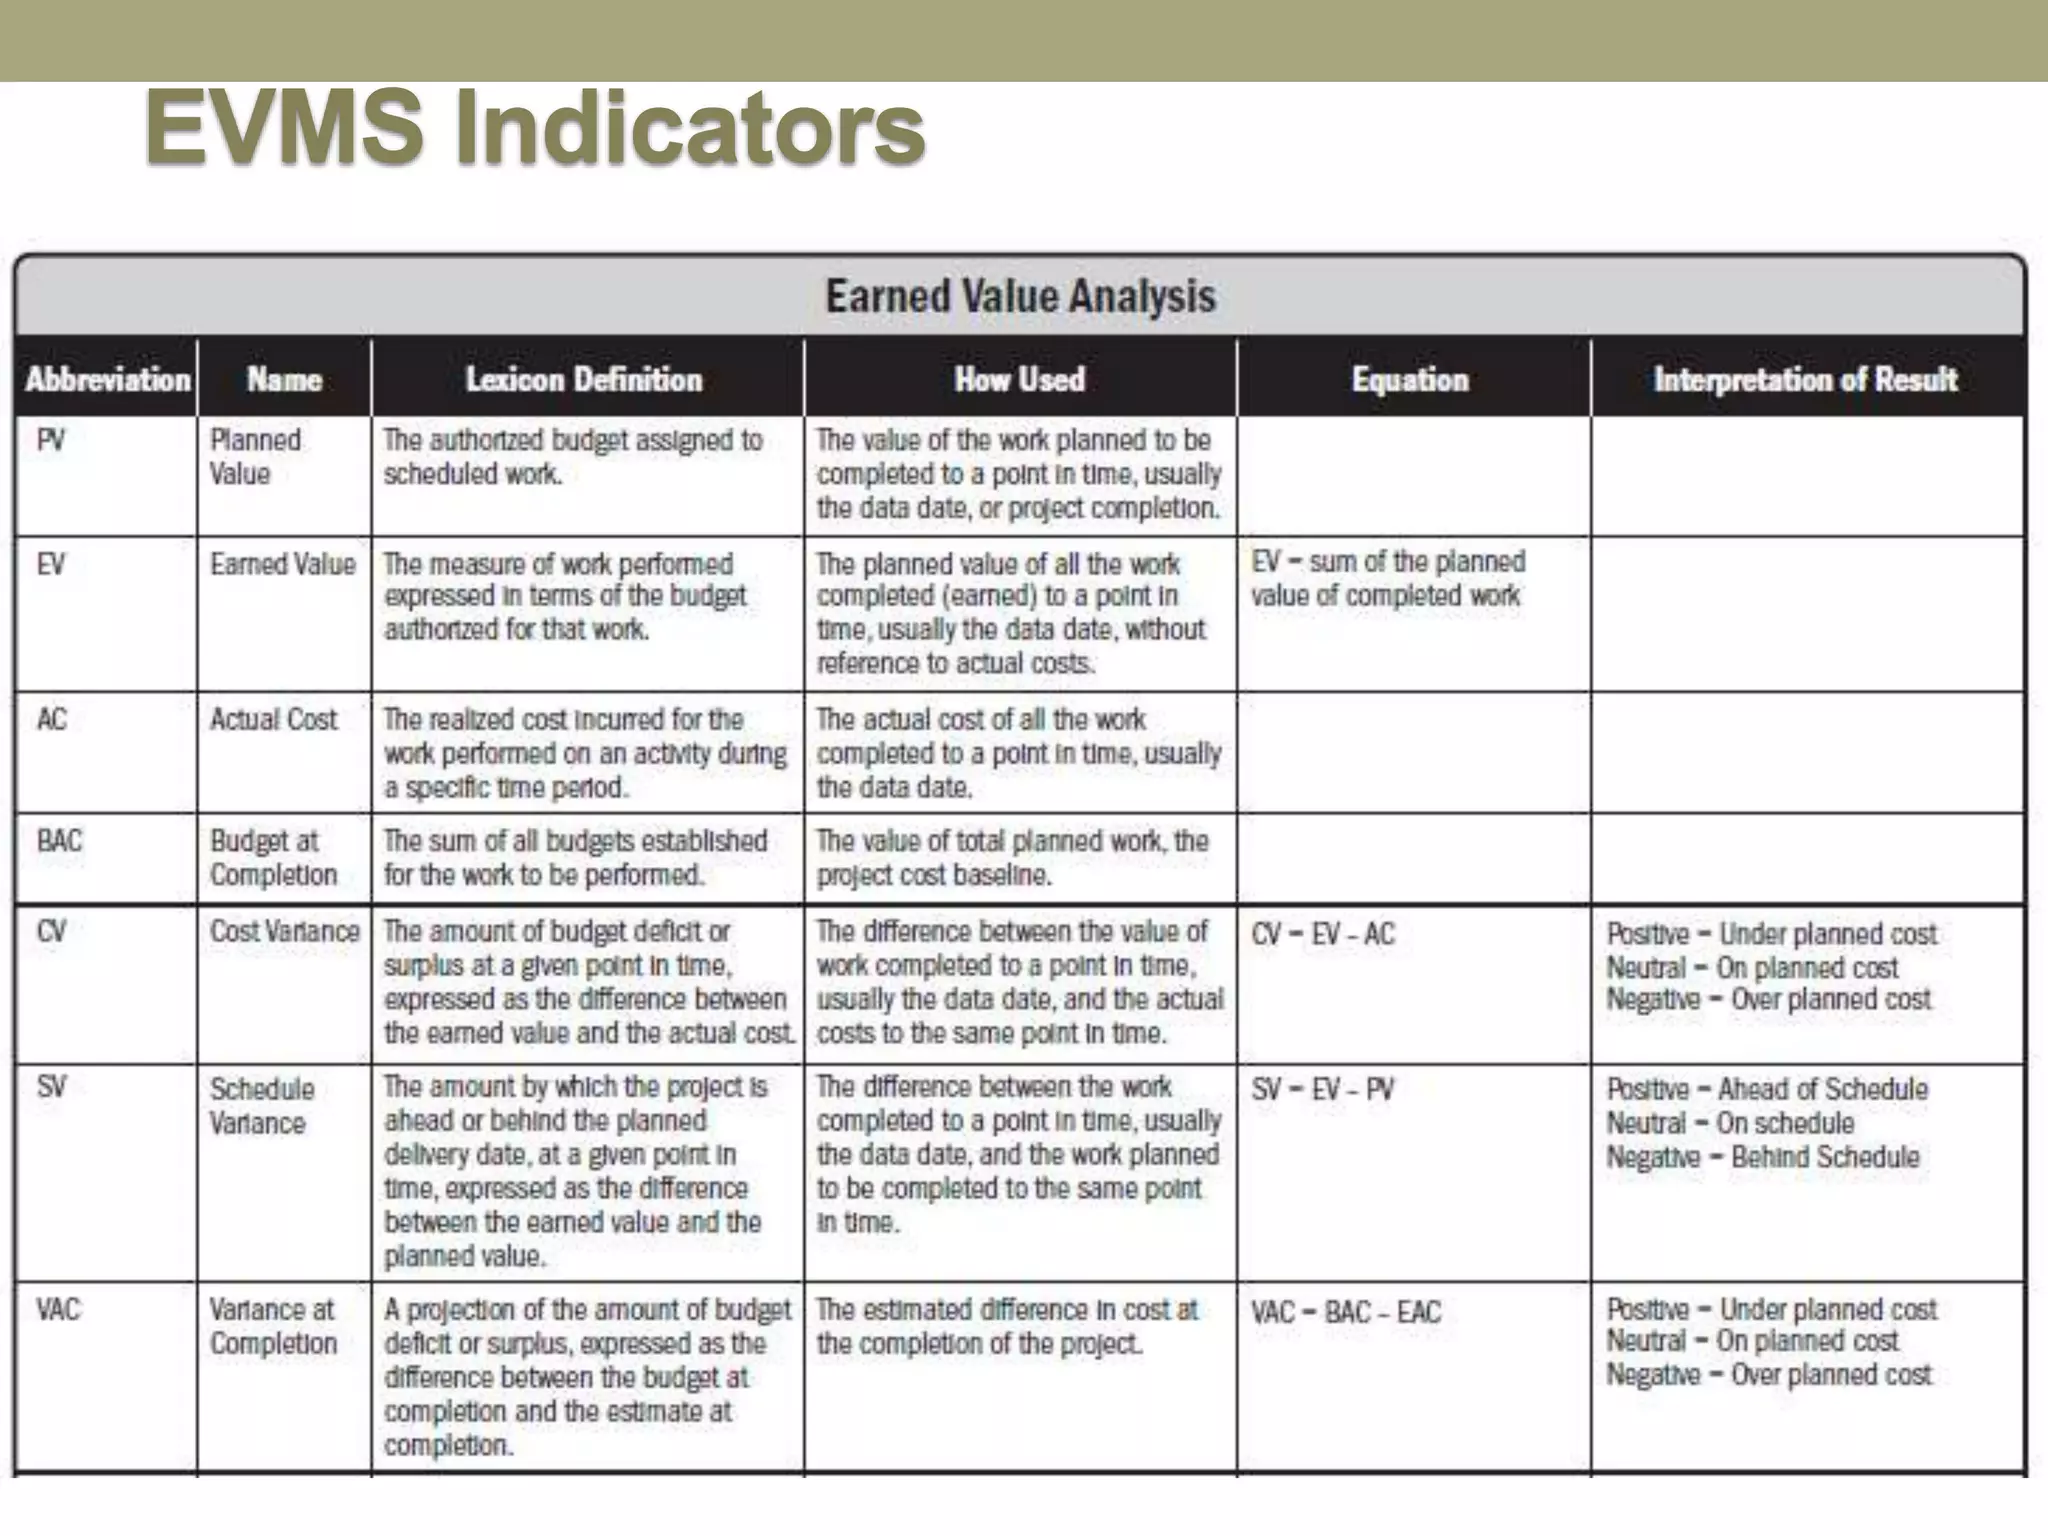
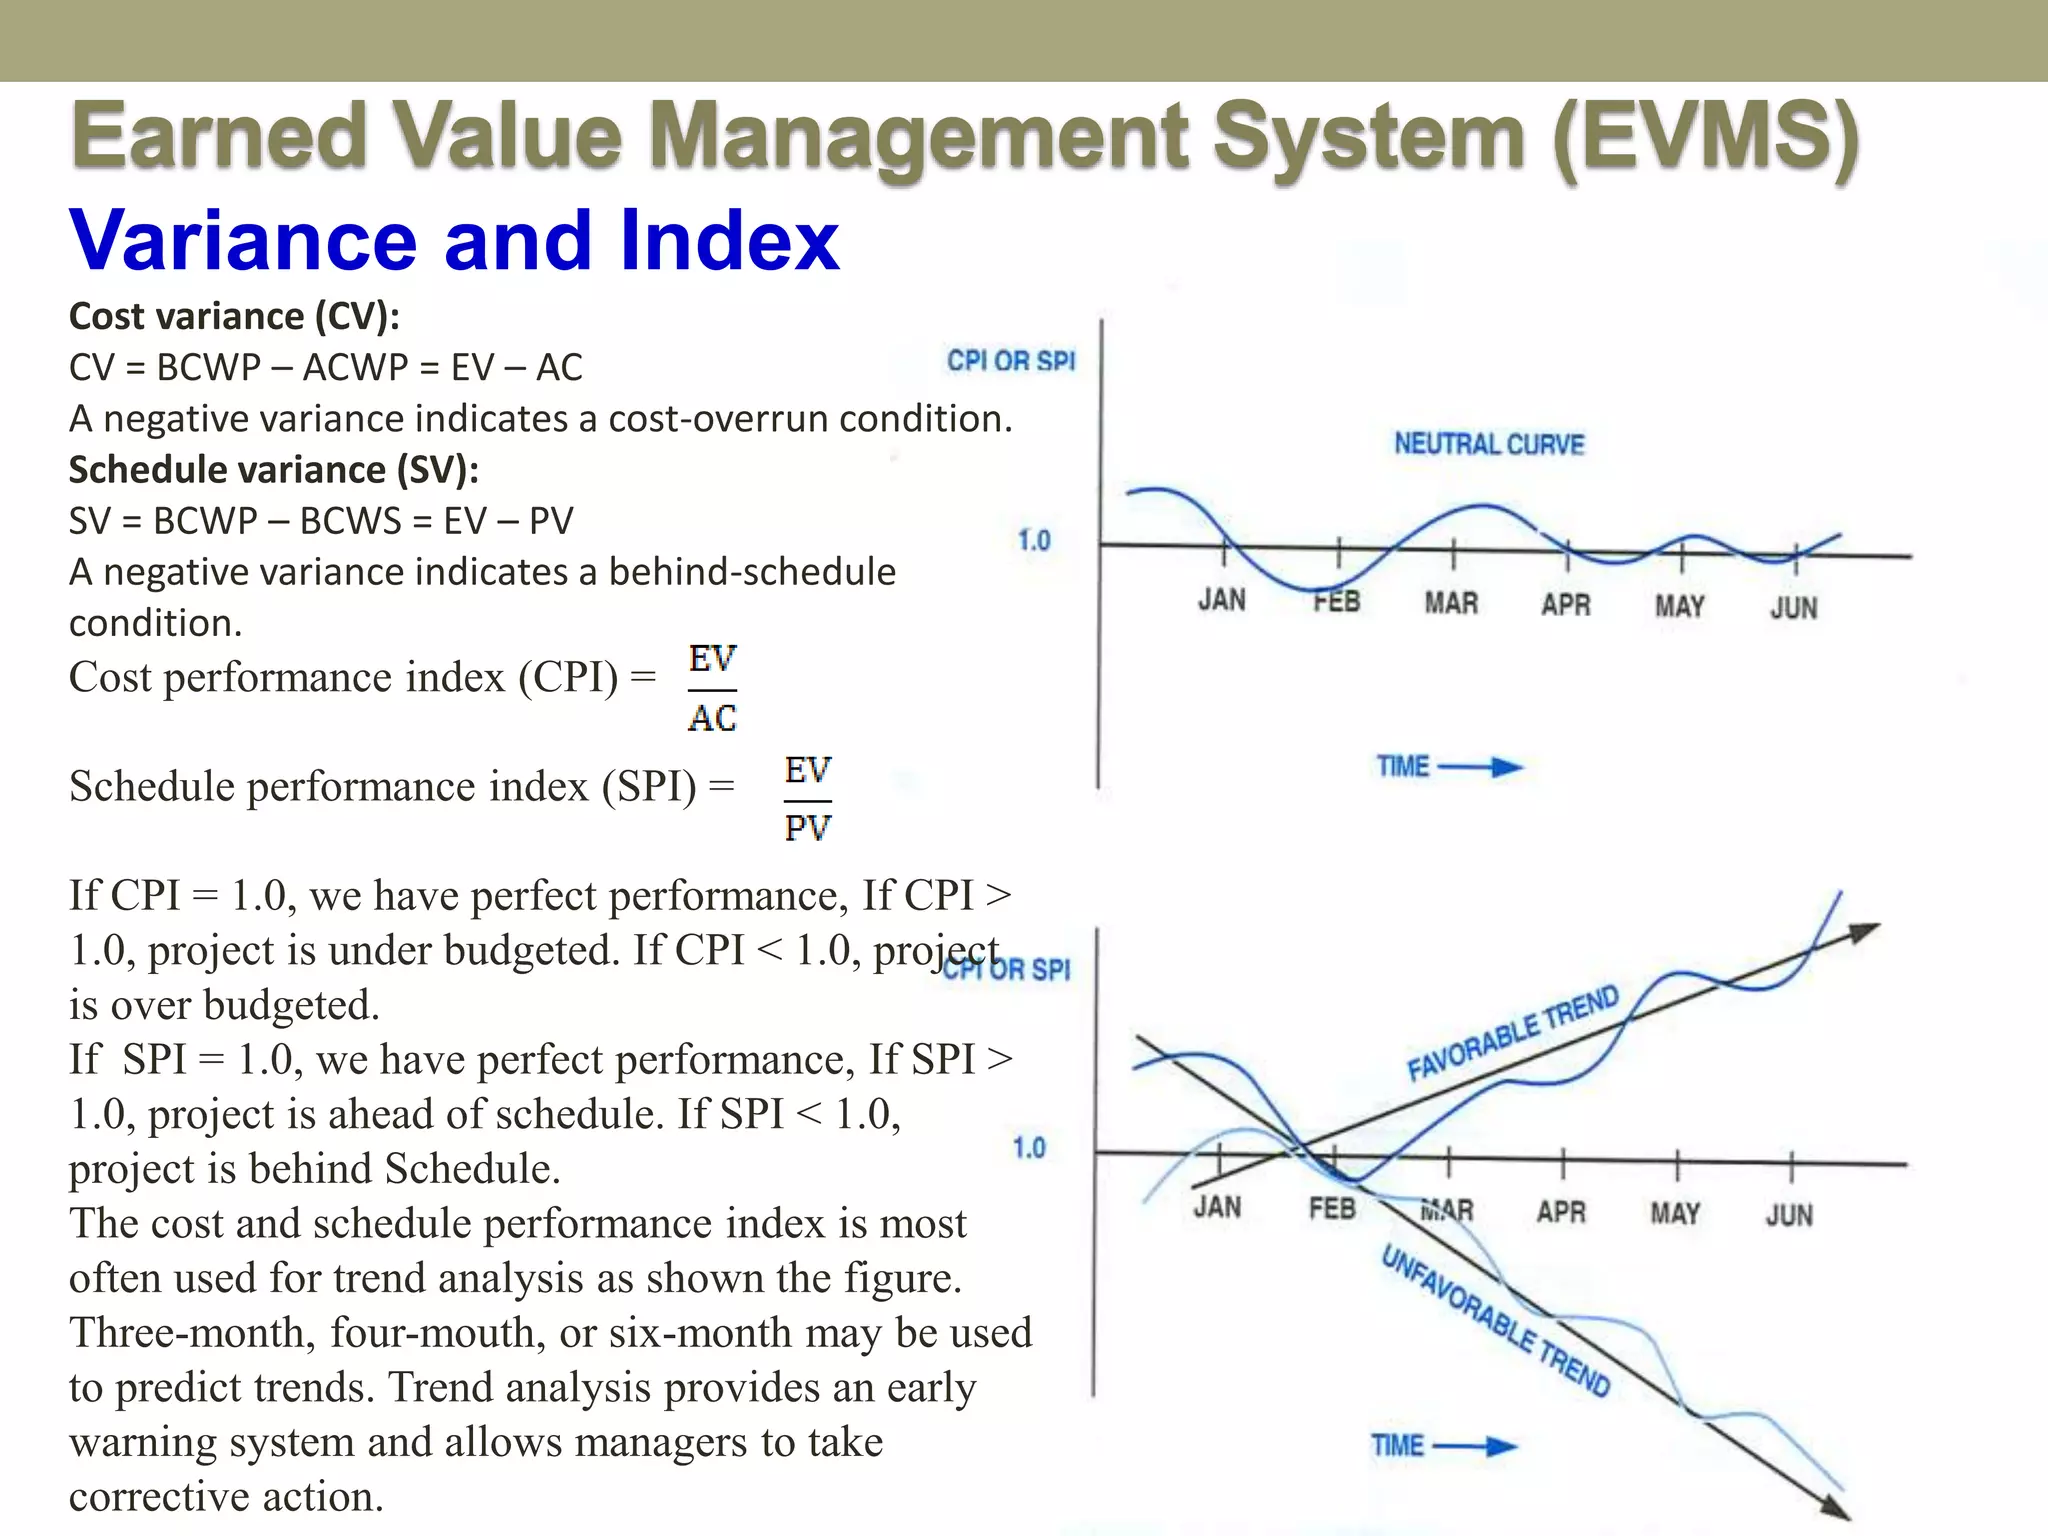
Cost variance (CV):
CV= BCWP – ACWP = EV – AC
A negative variance indicates a cost-overrun condition.
Schedule variance (SV):
SV = BCWP – BCWS = EV – PV
A negative variance indicates a behind-schedule
condition.
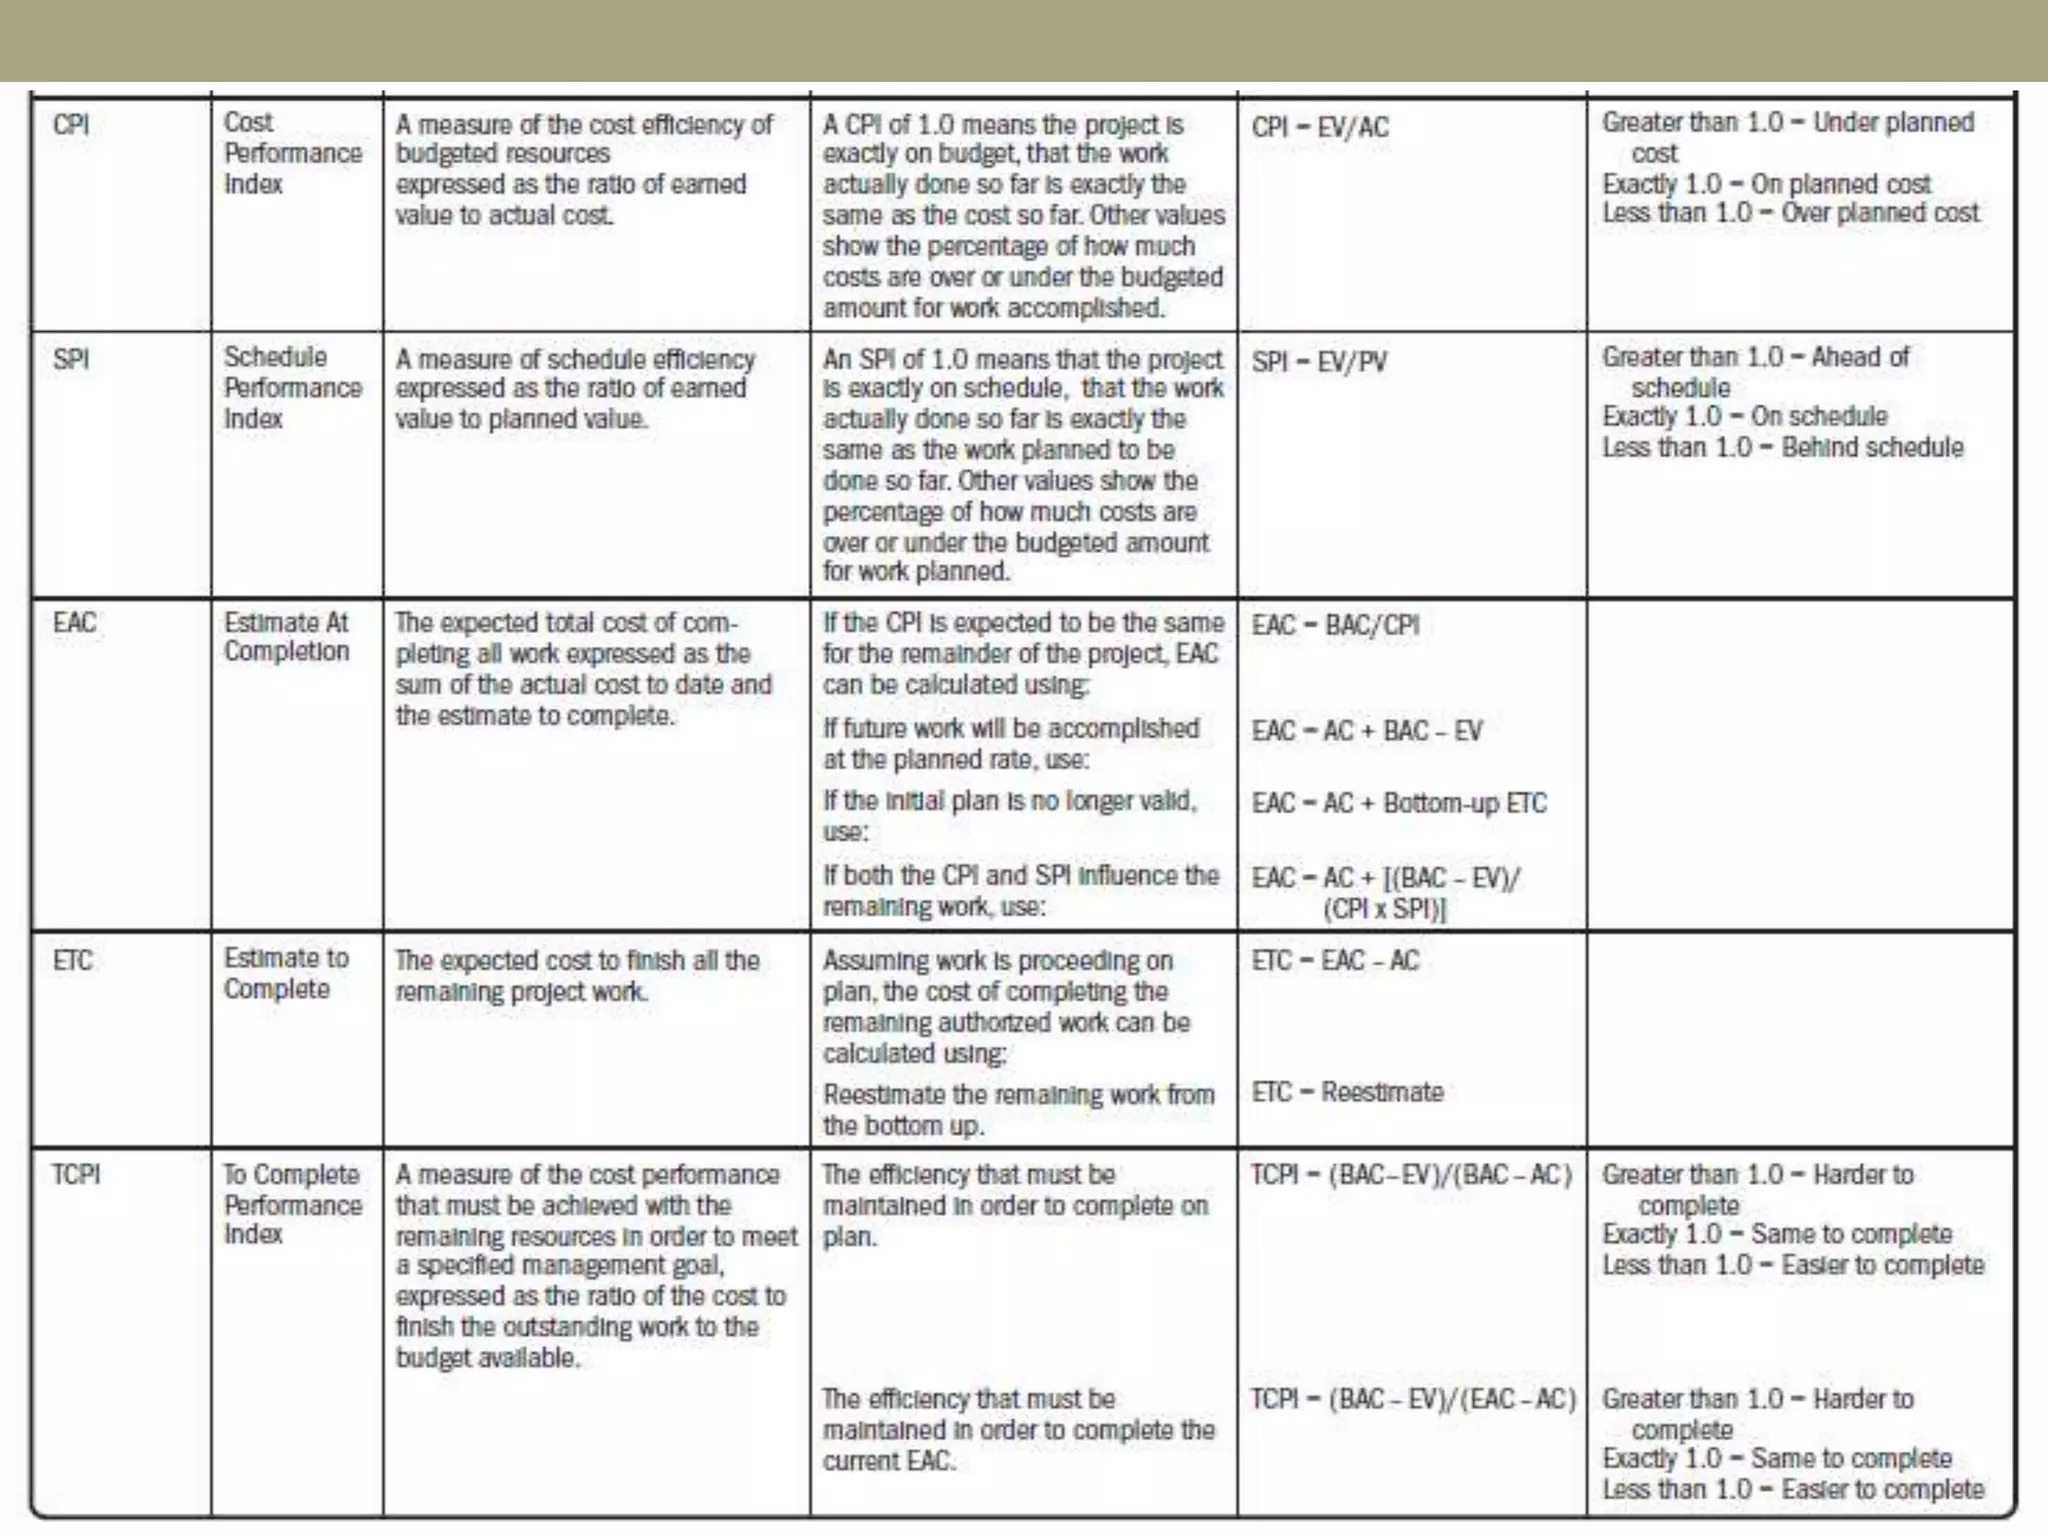
Cost performance index (CPI) =
Schedule performance index (SPI) =
If CPI = 1.0, we have perfect performance, If CPI >
1.0, project is under budgeted. If CPI < 1.0, project
is over budgeted.
If SPI = 1.0, we have perfect performance, If SPI >
1.0, project is ahead of schedule. If SPI < 1.0,
project is behind Schedule.
The cost and schedule performance index is most
often used for trend analysis as shown the figure.
Three-month, four-mouth, or six-month may be used
to predict trends. Trend analysis provides an early
warning system and allows managers to take
corrective action.
Variance and Index
Earned Value Management System (EVMS)
59.
Variance and Index
EarnedValue Management System (EVMS)
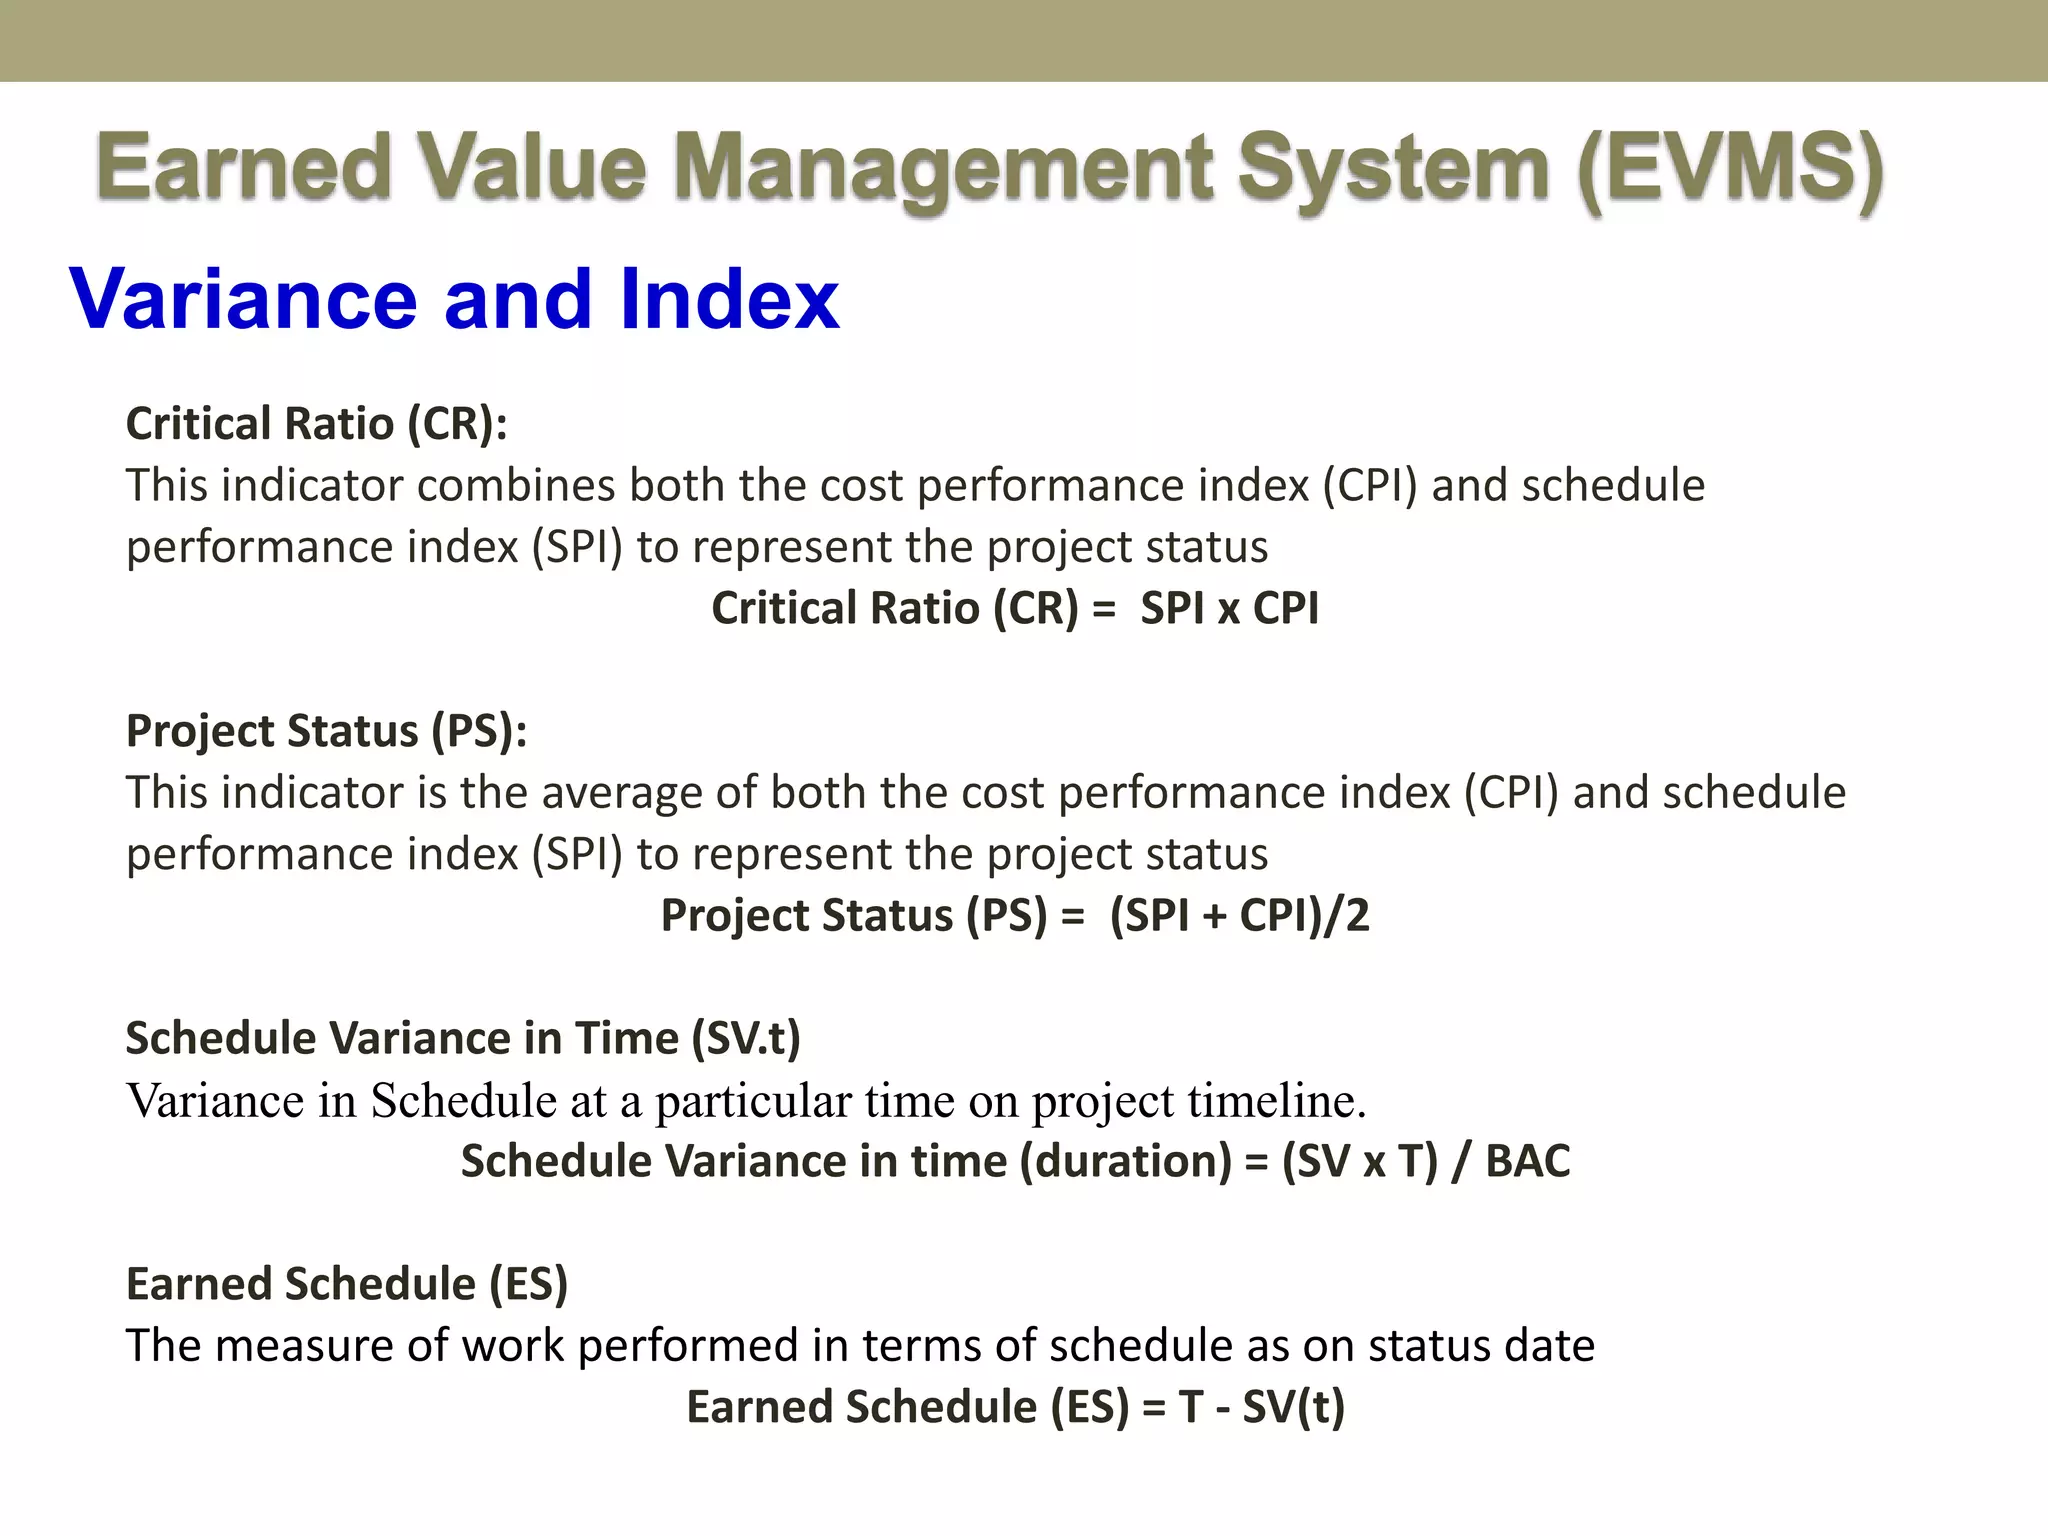
Critical Ratio (CR):
This indicator combines both the cost performance index (CPI) and schedule
performance index (SPI) to represent the project status
Critical Ratio (CR) = SPI x CPI
Project Status (PS):
This indicator is the average of both the cost performance index (CPI) and schedule
performance index (SPI) to represent the project status
Project Status (PS) = (SPI + CPI)/2
Schedule Variance in Time (SV.t)
Variance in Schedule at a particular time on project timeline.
Schedule Variance in time (duration) = (SV x T) / BAC
Earned Schedule (ES)
The measure of work performed in terms of schedule as on status date
Earned Schedule (ES) = T - SV(t)
60.
TIME
COST
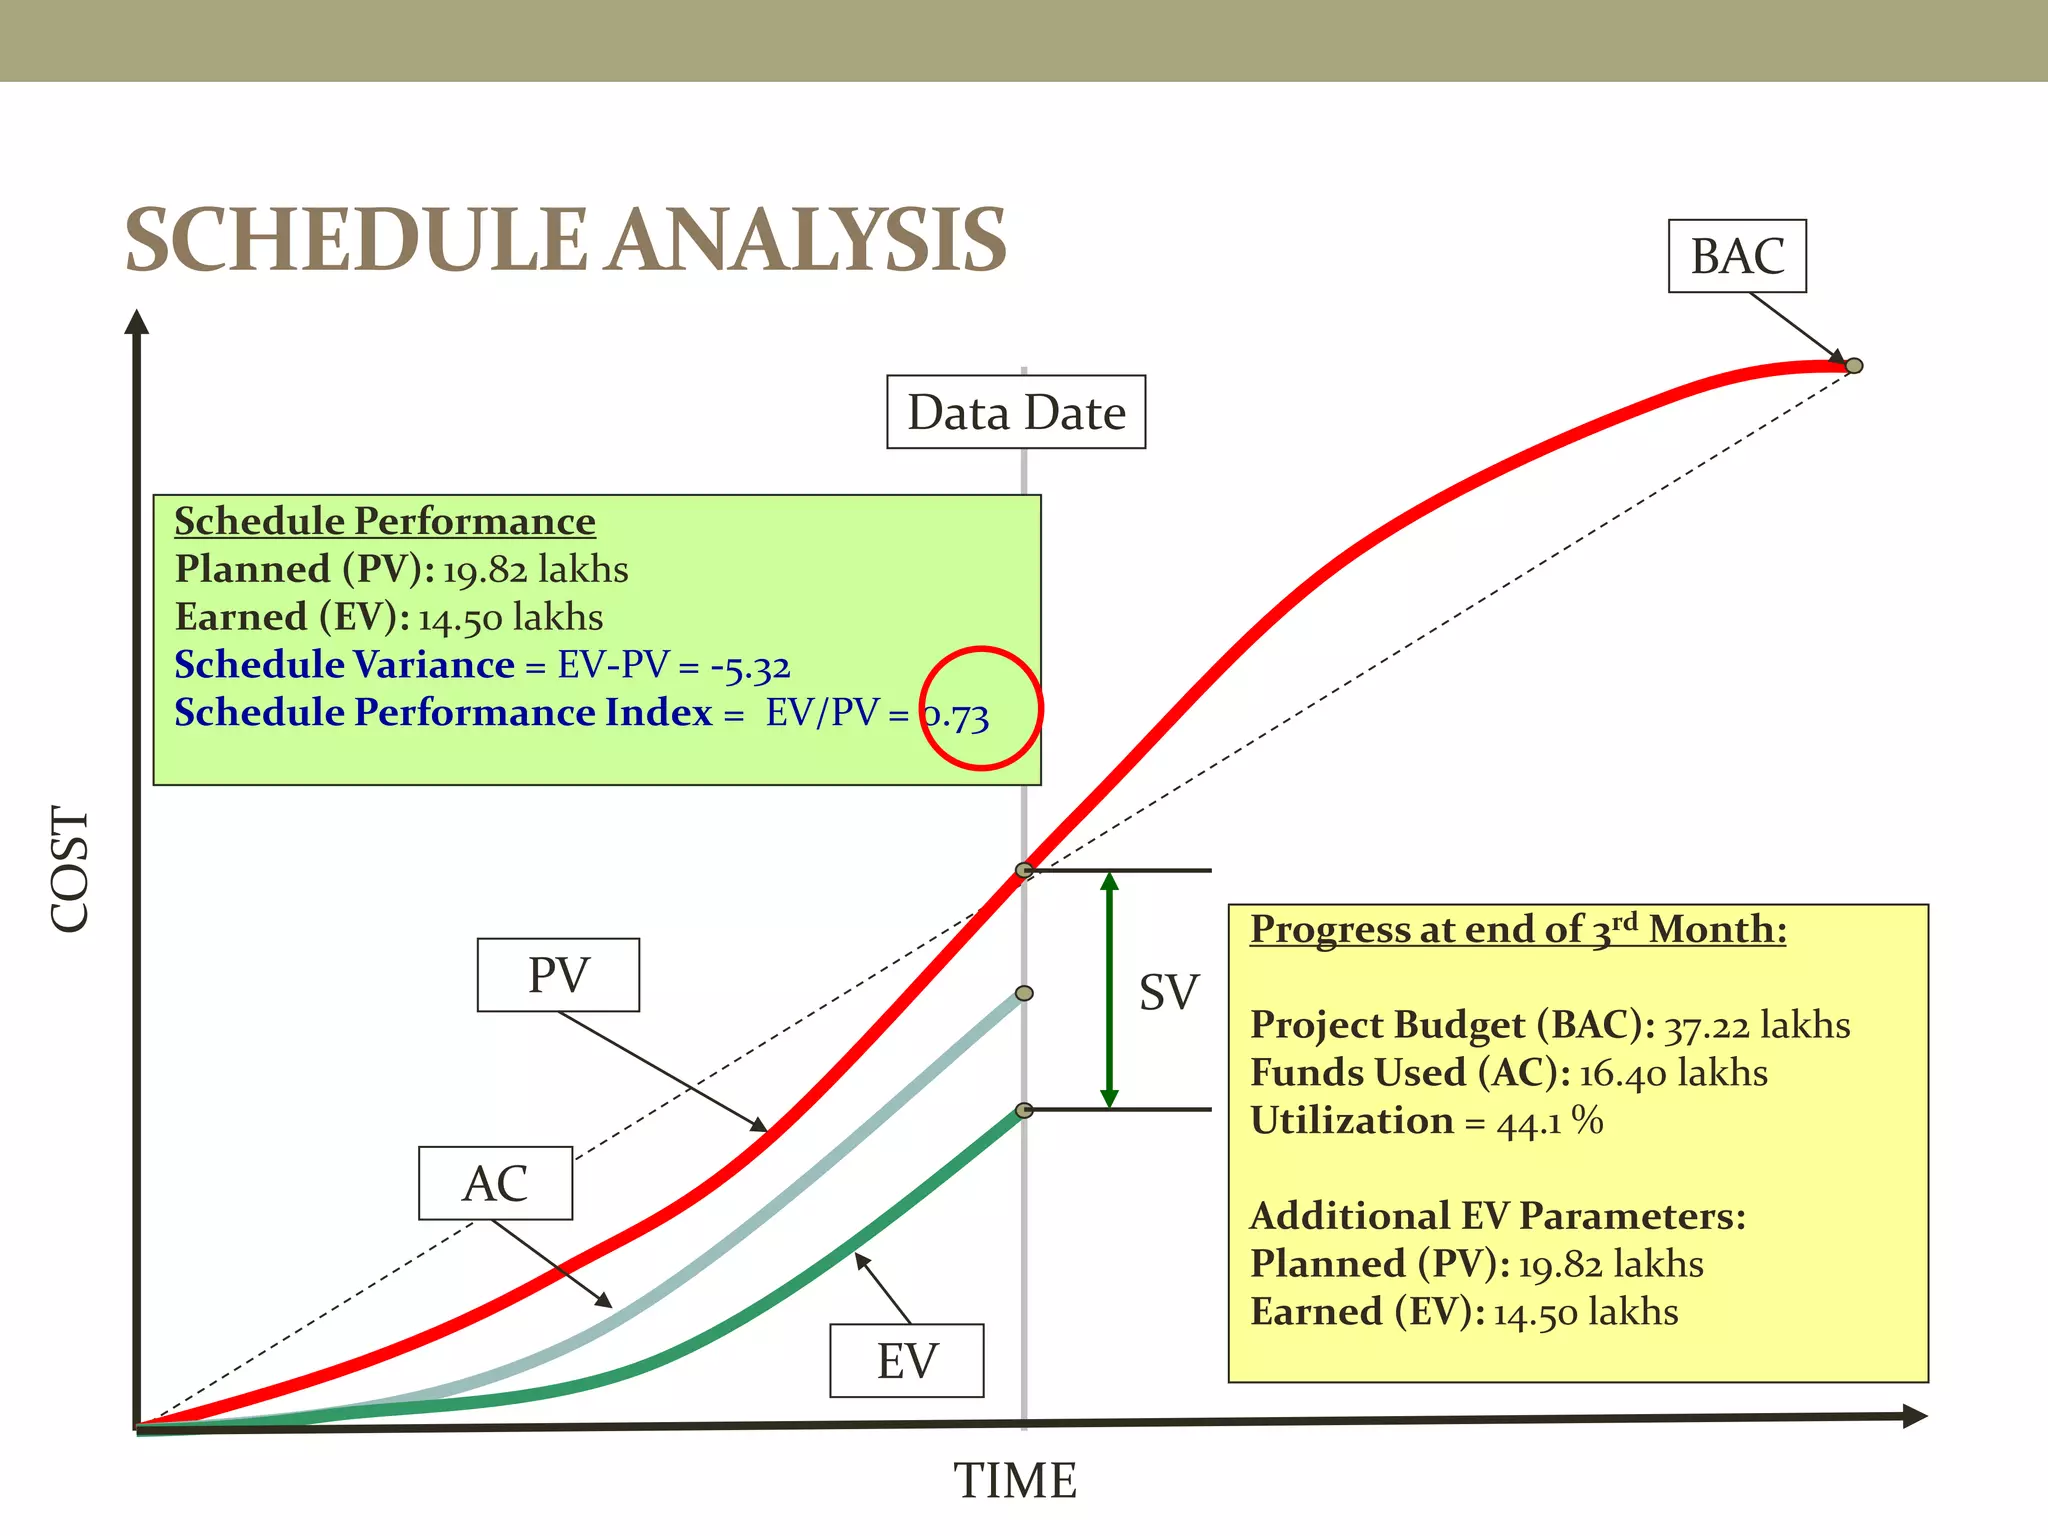
SCHEDULE ANALYSIS BAC
DataDate
AC
EV
PV
Progress at end of 3rd Month:
Project Budget (BAC): 37.22 lakhs
Funds Used (AC): 16.40 lakhs
Utilization = 44.1 %
Additional EV Parameters:
Planned (PV): 19.82 lakhs
Earned (EV): 14.50 lakhs
Schedule Performance
Planned (PV): 19.82 lakhs
Earned (EV): 14.50 lakhs
Schedule Variance = EV-PV = -5.32
Schedule Performance Index = EV/PV = 0.73
SV
61.
TIME
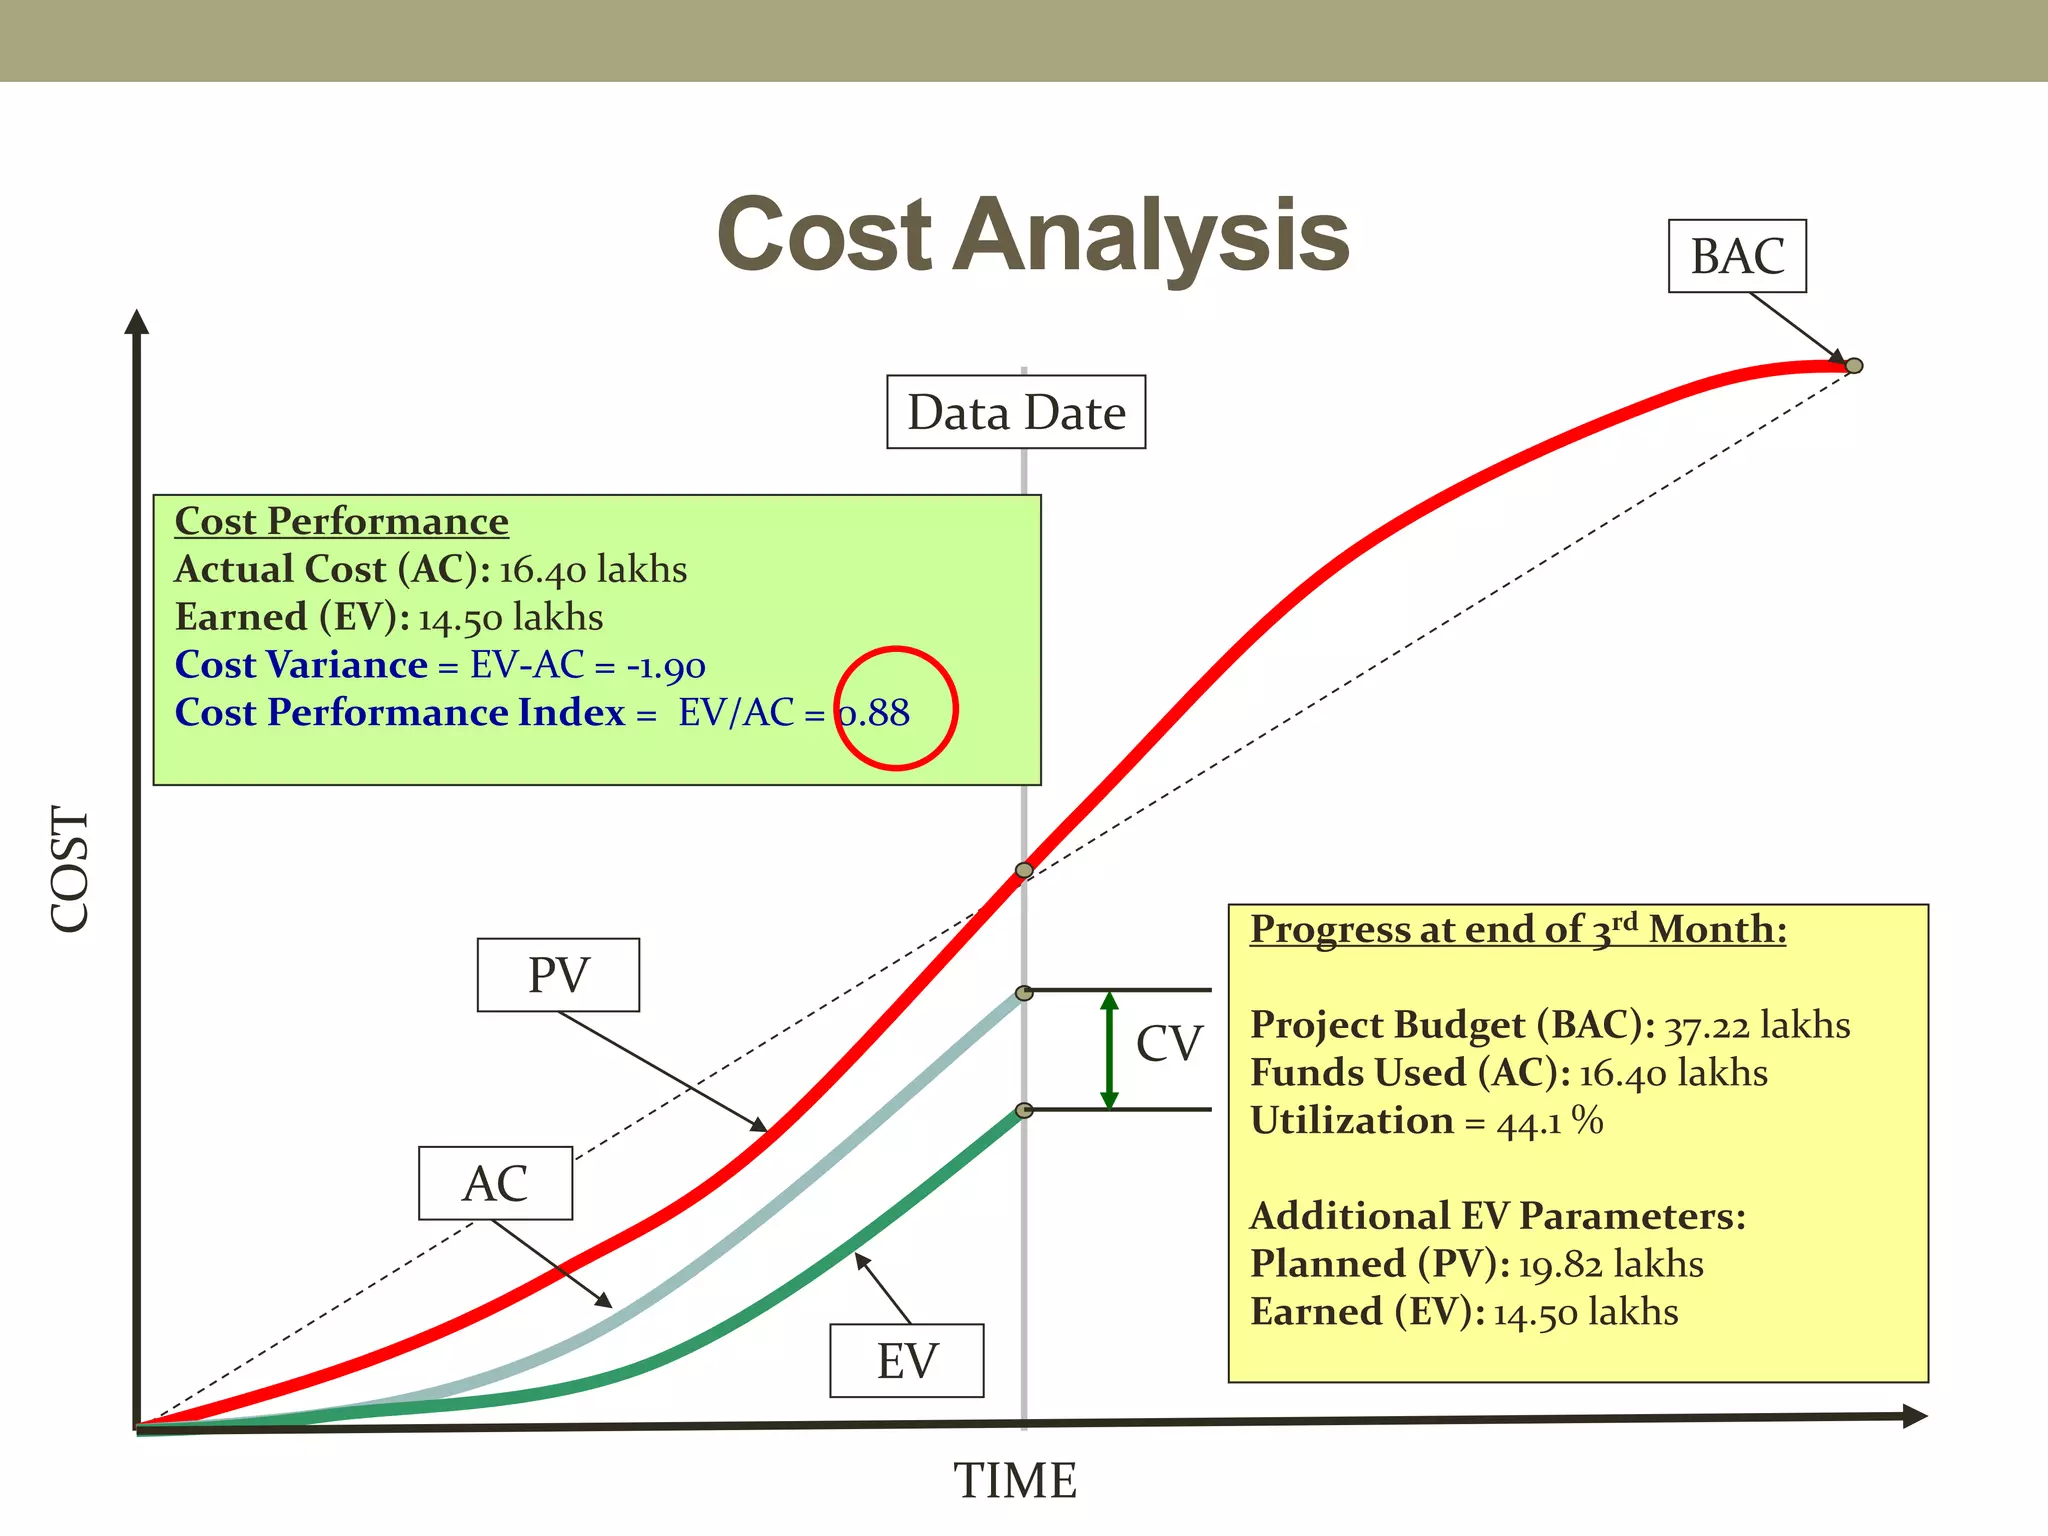
COST
Cost Analysis BAC
DataDate
AC
EV
PV
Progress at end of 3rd Month:
Project Budget (BAC): 37.22 lakhs
Funds Used (AC): 16.40 lakhs
Utilization = 44.1 %
Additional EV Parameters:
Planned (PV): 19.82 lakhs
Earned (EV): 14.50 lakhs
Cost Performance
Actual Cost (AC): 16.40 lakhs
Earned (EV): 14.50 lakhs
Cost Variance = EV-AC = -1.90
Cost Performance Index = EV/AC = 0.88
CV
62.
TIME
COST
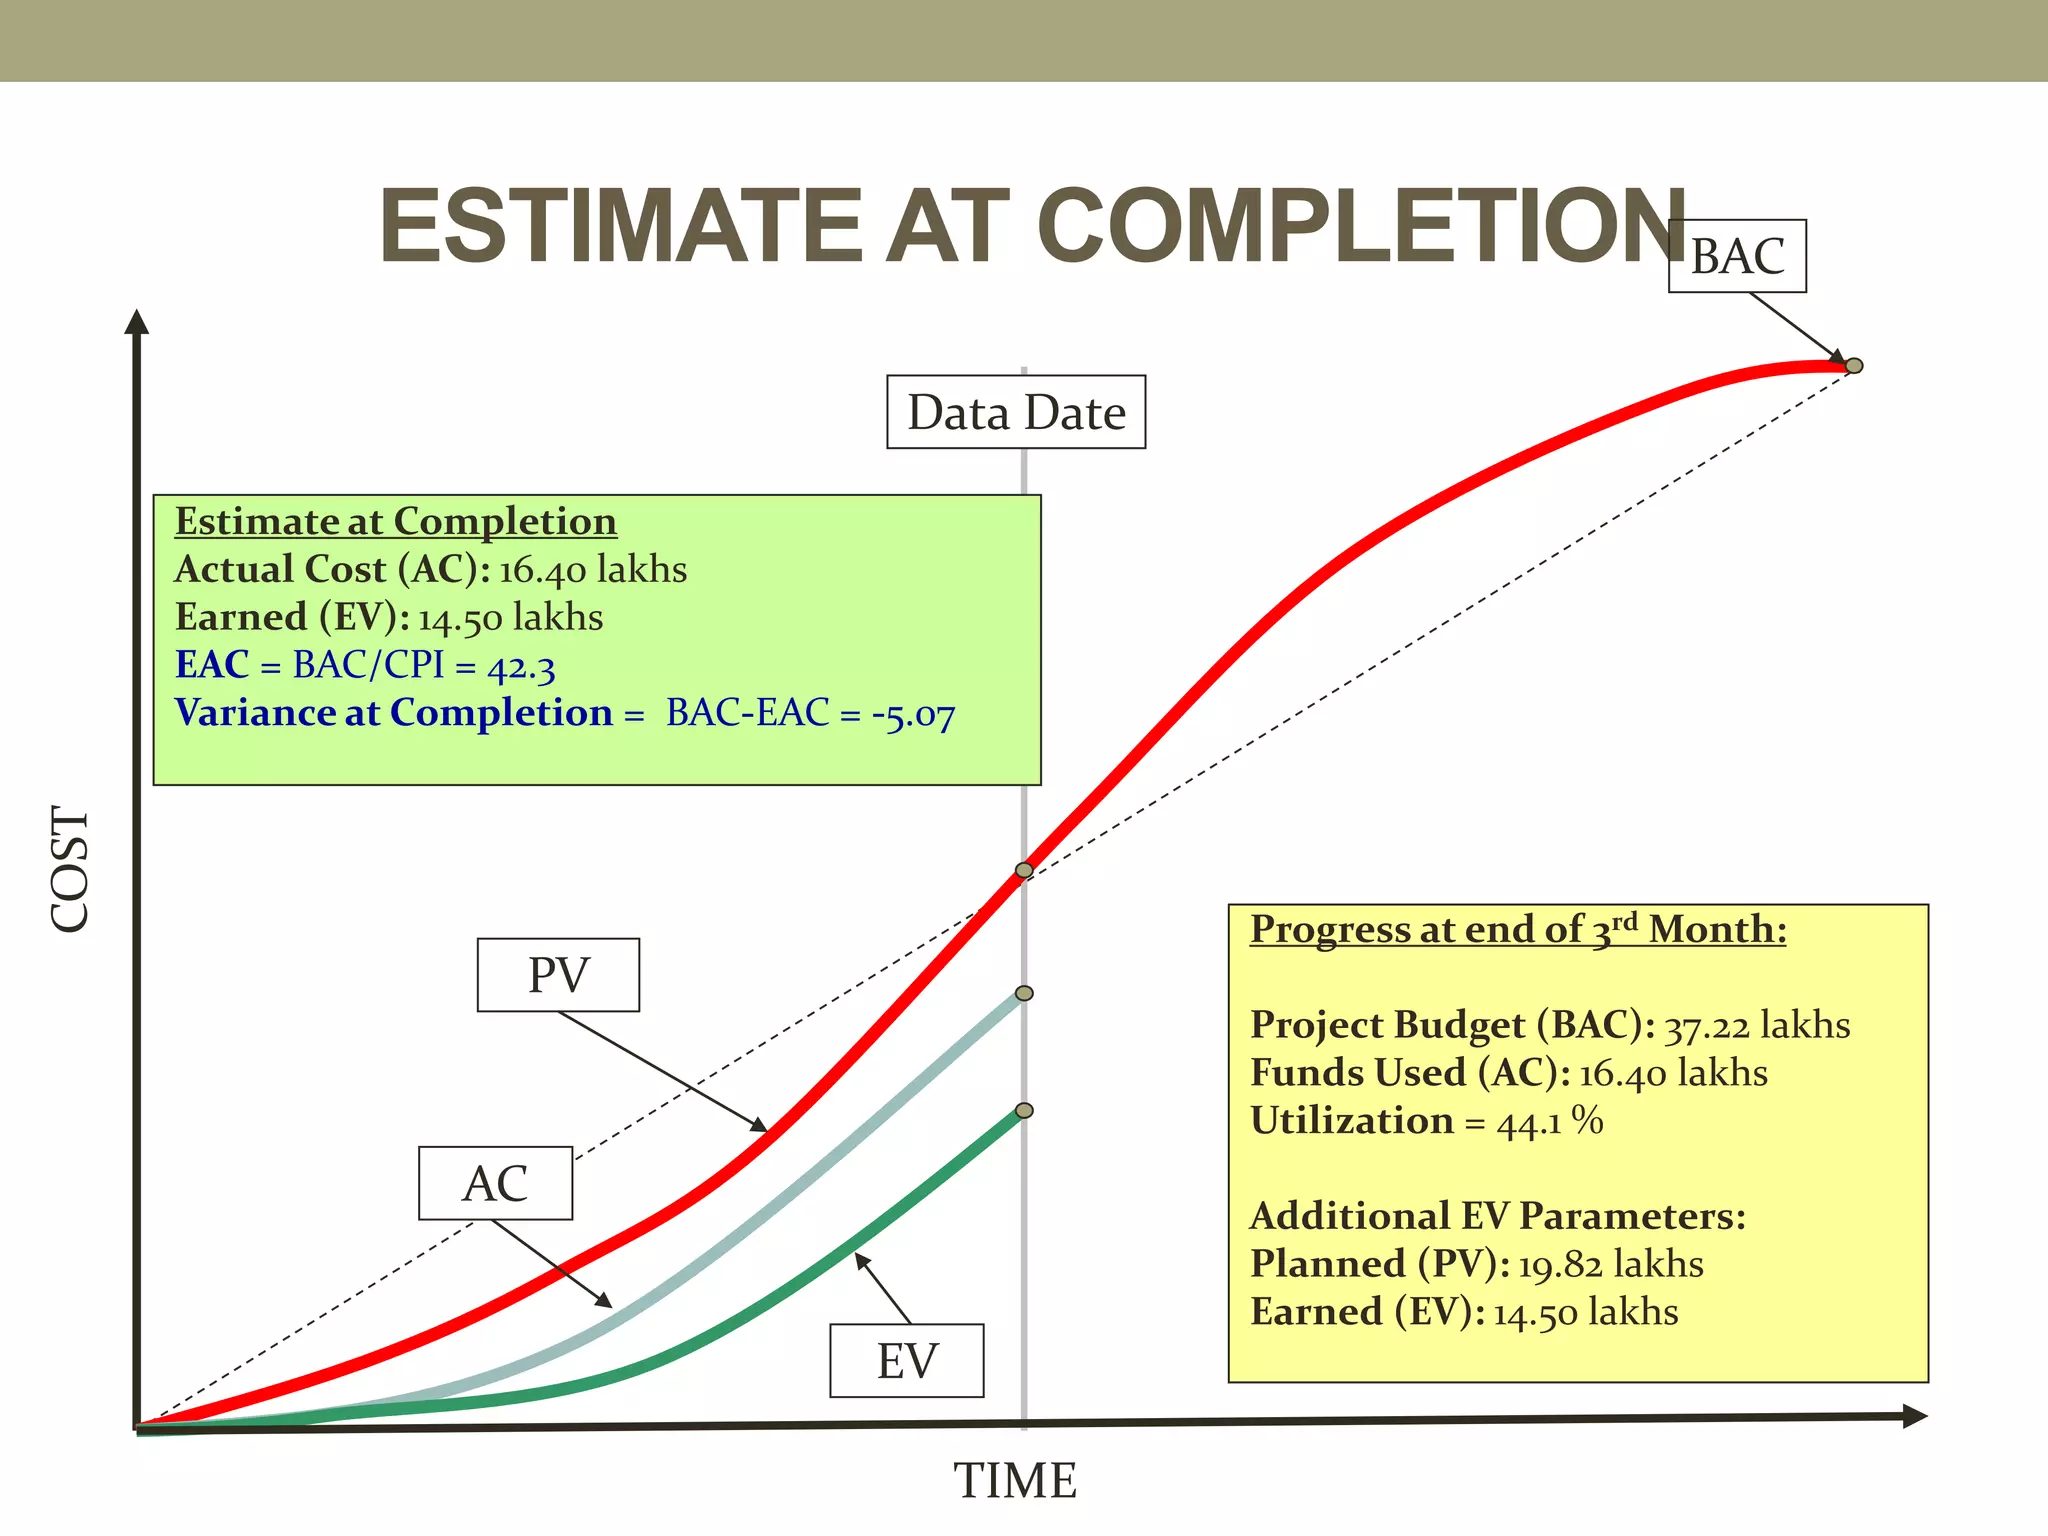
ESTIMATE AT COMPLETIONBAC
DataDate
AC
EV
PV
Progress at end of 3rd Month:
Project Budget (BAC): 37.22 lakhs
Funds Used (AC): 16.40 lakhs
Utilization = 44.1 %
Additional EV Parameters:
Planned (PV): 19.82 lakhs
Earned (EV): 14.50 lakhs
Estimate at Completion
Actual Cost (AC): 16.40 lakhs
Earned (EV): 14.50 lakhs
EAC = BAC/CPI = 42.3
Variance at Completion = BAC-EAC = -5.07
63.
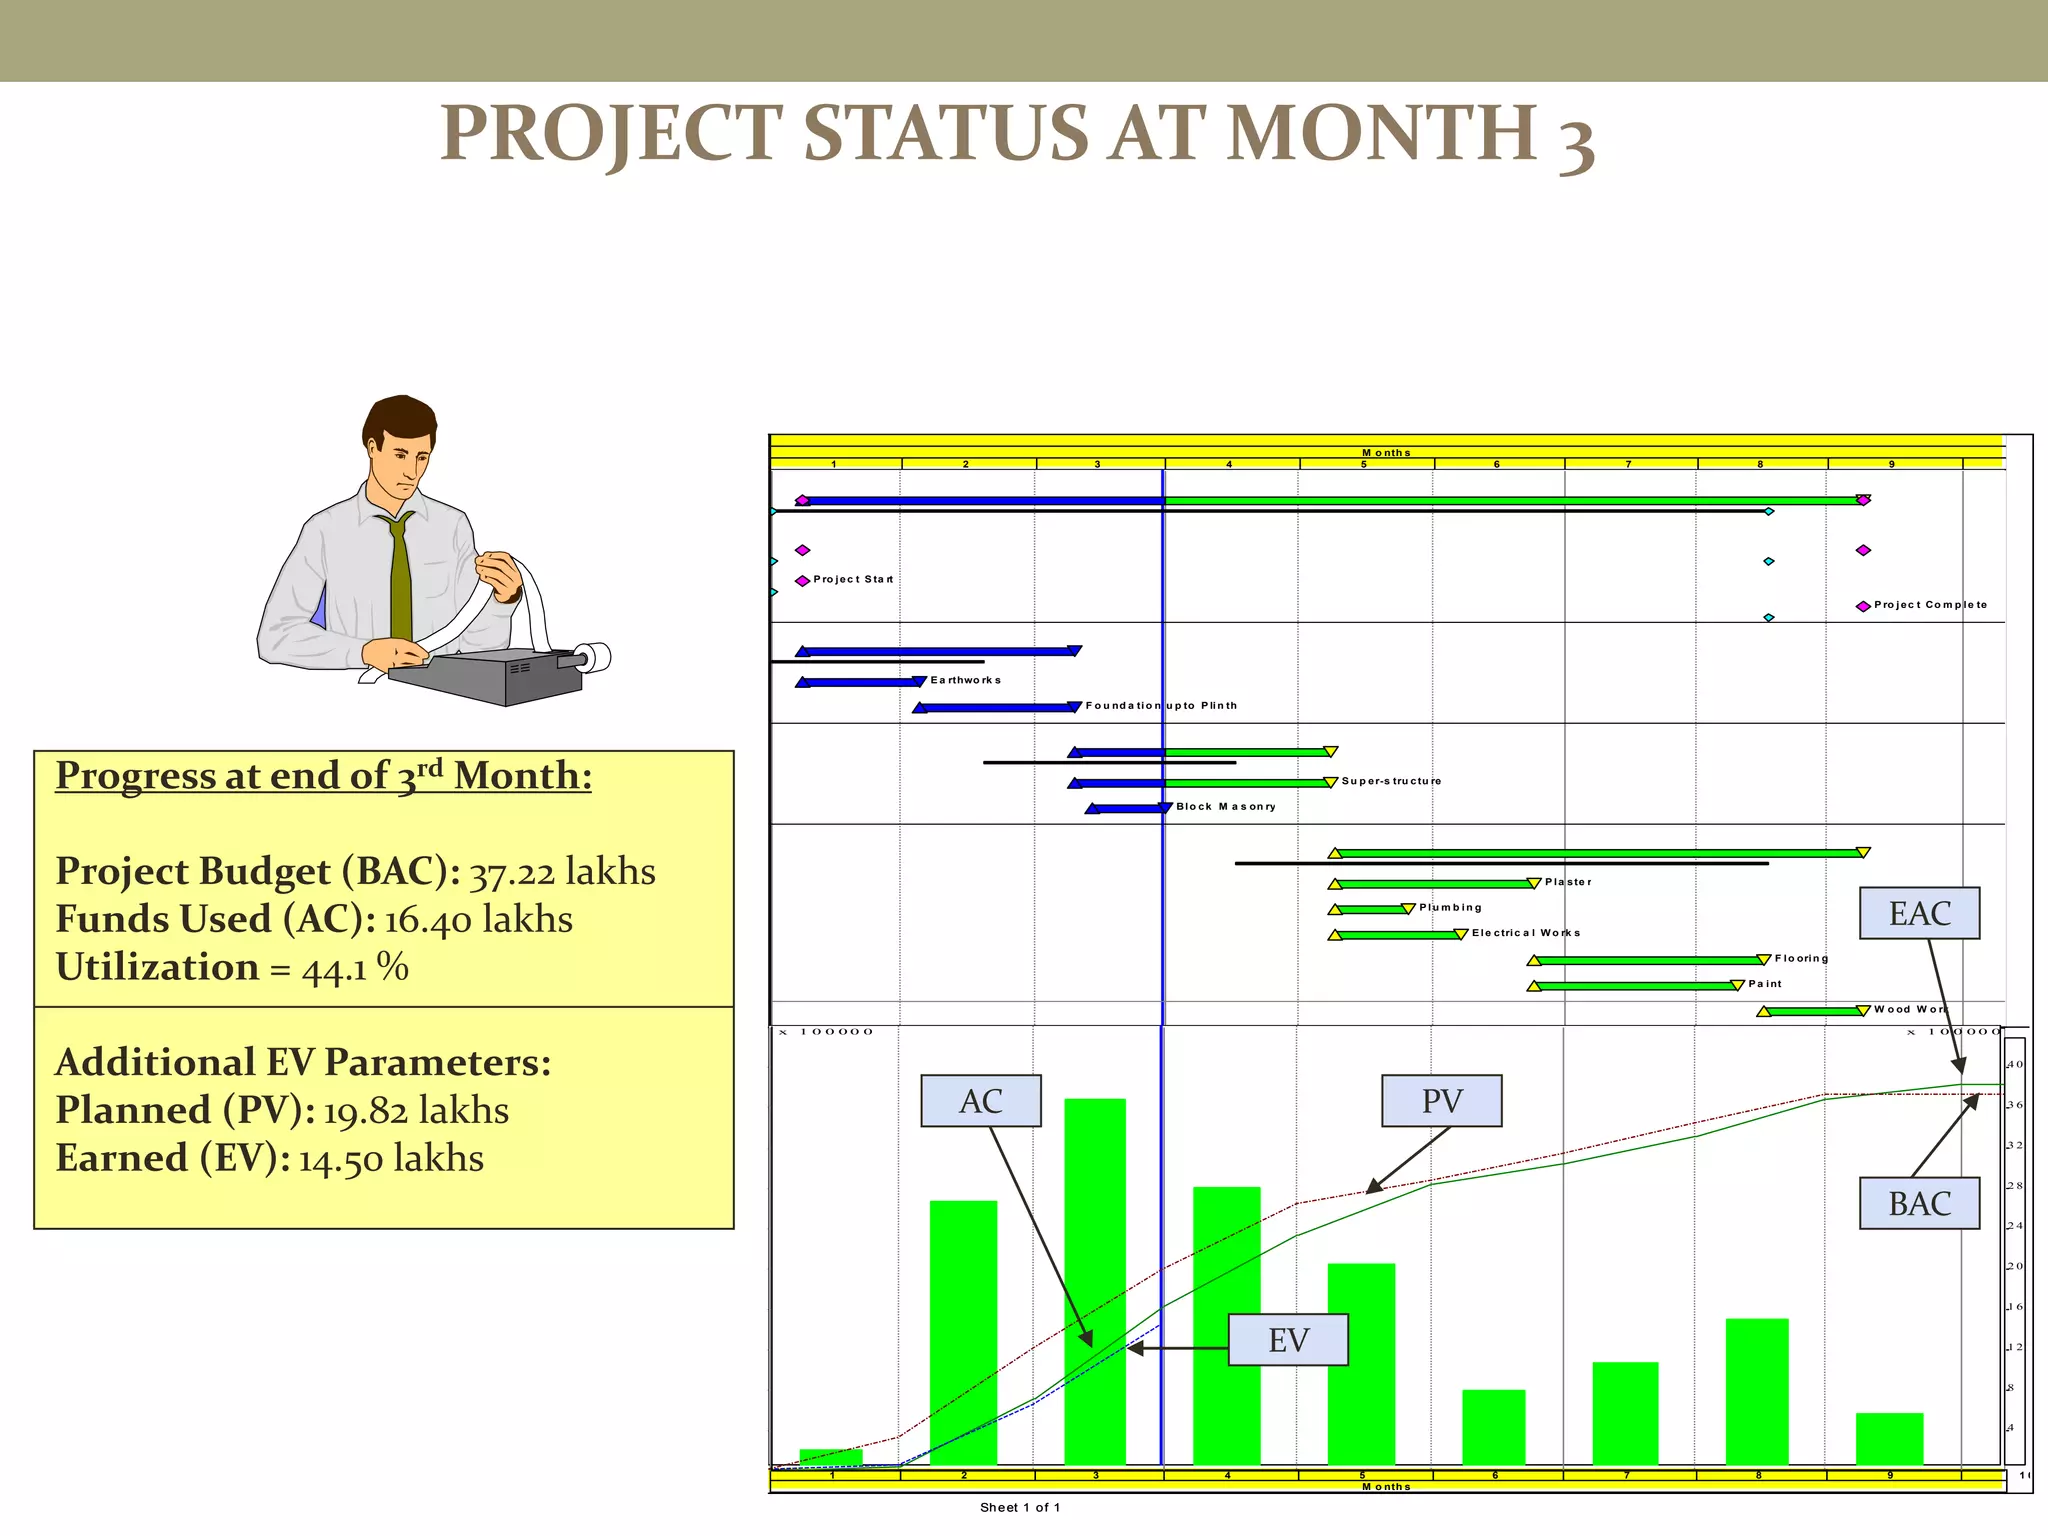
PROJECT STATUS ATMONTH 3
Progress at end of 3rd Month:
Project Budget (BAC): 37.22 lakhs
Funds Used (AC): 16.40 lakhs
Utilization = 44.1 %
Additional EV Parameters:
Planned (PV): 19.82 lakhs
Earned (EV): 14.50 lakhs
Sheet 1 of 1
Ac ti vi ty
I D
Ac ti vi ty
De s cri p ti o n
Ori g
Du r
Bu d ge t
(BAC)
P l a nn e d
(BCW S )
E a rne d
(BCW P )
Ac tua l
(ACW P )
R ural H ealth C linic
T o t a l 2 1 0 3 , 7 2 2 , 0 0 0 . 0 0 1 , 9 8 2 , 8 0 0 . 0 0 1 , 4 5 0 , 0 0 0 . 0 0 1 , 6 4 0 , 0 0 0 . 0 0
G ener al
S u b to t a l 2 1 0 0 . 0 0 0 . 0 0 0 . 0 0 0 . 0 0
1 0 0 0 P r o j e c t S t a rt 0 0 . 0 0 0 . 0 0 0 . 0 0 0 . 0 0
1 1 1 0 P r o j e c t C o m p l e t e 0 0 . 0 0 0 . 0 0 0 . 0 0 0 . 0 0
Foundation
S u b to t a l 5 4 8 5 0 ,0 0 0 . 0 0 8 5 0 ,0 0 0 . 0 0 8 5 0 ,0 0 0 . 0 0 9 5 0 ,0 0 0 . 0 0
1 0 1 0 E a r t h w o r k s 1 8 5 0 , 0 0 0 . 0 0 5 0 , 0 0 0 . 0 0 5 0 , 0 0 0 . 0 0 6 0 , 0 0 0 . 0 0
1 0 2 0 F o u n d a t i o n u p t o P li n t h 2 4 8 0 0 ,0 0 0 . 0 0 8 0 0 ,0 0 0 . 0 0 8 0 0 ,0 0 0 . 0 0 8 9 0 ,0 0 0 . 0 0
S tr uctur e W or k
S u b to t a l 5 1 1 , 5 3 6 , 0 0 0 . 0 0 1 , 1 3 2 , 8 0 0 . 0 0 6 0 0 ,0 0 0 . 0 0 6 9 0 ,0 0 0 . 0 0
1 0 3 0 S u p e r - s t r u c t u r e 5 0 1 , 4 4 0 , 0 0 0 . 0 0 1 , 0 3 6 , 8 0 0 . 0 0 5 0 4 ,0 0 0 . 0 0 5 8 4 ,0 0 0 . 0 0
1 0 4 0 B l o c k M a s o n r y 1 5 9 6 , 0 0 0 . 0 0 9 6 , 0 0 0 . 0 0 9 6 , 0 0 0 . 0 0 1 0 6 ,0 0 0 . 0 0
Finishes
S u b to t a l 1 0 5 1 , 3 3 6 , 0 0 0 . 0 0 0 . 0 0 0 . 0 0 0 . 0 0
1 0 5 0 P l a s t e r 4 0 1 9 2 ,0 0 0 . 0 0 0 . 0 0 0 . 0 0 0 . 0 0
1 1 0 0 P l u m b i n g 1 5 1 0 0 ,0 0 0 . 0 0 0 . 0 0 0 . 0 0 0 . 0 0
1 0 9 0 E l e c t r i c a l W o r k s 2 5 2 0 0 ,0 0 0 . 0 0 0 . 0 0 0 . 0 0 0 . 0 0
1 0 7 0 F l o o r i n g 4 5 3 0 0 ,0 0 0 . 0 0 0 . 0 0 0 . 0 0 0 . 0 0
1 0 6 0 P a i n t 4 0 1 4 4 ,0 0 0 . 0 0 0 . 0 0 0 . 0 0 0 . 0 0
1 0 8 0 W o o d W o r k 2 0 4 0 0 ,0 0 0 . 0 0 0 . 0 0 0 . 0 0 0 . 0 0
M o nth s
1 2 3 4 5 6 7 8 9 1 0
P ro j ec t S ta rt
P ro j ec t Co m p l e te
E a rthwo rk s
F o u nd a ti o n u p to P li n th
S u p er-s tru ctu re
Bl o ck M a s on ry
P l a ste r
P l u m b i n g
E l e ctri c a l W o rk s
F l o ori n g
P a i nt
W o od W o rk
R e s o u rc e / Co s t P ro fi l e L e g e n d
P l a n n e d v a l u e c u rv e
E a rn e d v a l u e c u rv e
C u rre n t e s t im a t e c u rv e
T o t a l e a rl y c o s t p e r M o n t h ( C u rre n t E s t i m a t e )
T o t a l o f A l l R e s o u rc e s D e t a i l s c a l e ( l e f t ) : X 1 0 0 0 0 0
C u m u l a t i v e s c a l e (ri g h t ) : X 1 0 0 0 0 0
1 2 3 4 5 6 7 8 9 1 0
M o nth s
1
2
3
4
5
6
7
8
9
1 0
4
8
1 2
1 6
2 0
2 4
2 8
3 2
3 6
4 0
x 1 0 0 0 0 0 x 1 0 0 0 0 0
Sheet 1 of 1
PV
EV
AC
EAC
BAC
PROGRAMME EVALUATION ANDREVIEW
TECHNIQUE (PERT)
PERT is an inherent planning technique forces the manager to
develop a comprehensive plan and allows realistic scheduling. The
procedure for monitoring, forecasting and simulating allows the
manager to respond quickly to unexpected changes in the project,
detect trouble areas early and evaluate proposed alternative
courses of action. PERT also helps to evaluate alternatives at any
time during projects duration by looking effect of each change on its
completion date. PERT also helps to simulate the project time &
cost and effects of alternate decisions.
It is a planning & Control techniques that precuts statistical
information regarding the uncertainties associated with completing
the different activities associated to a project. Expected Value of
activity direction
67.
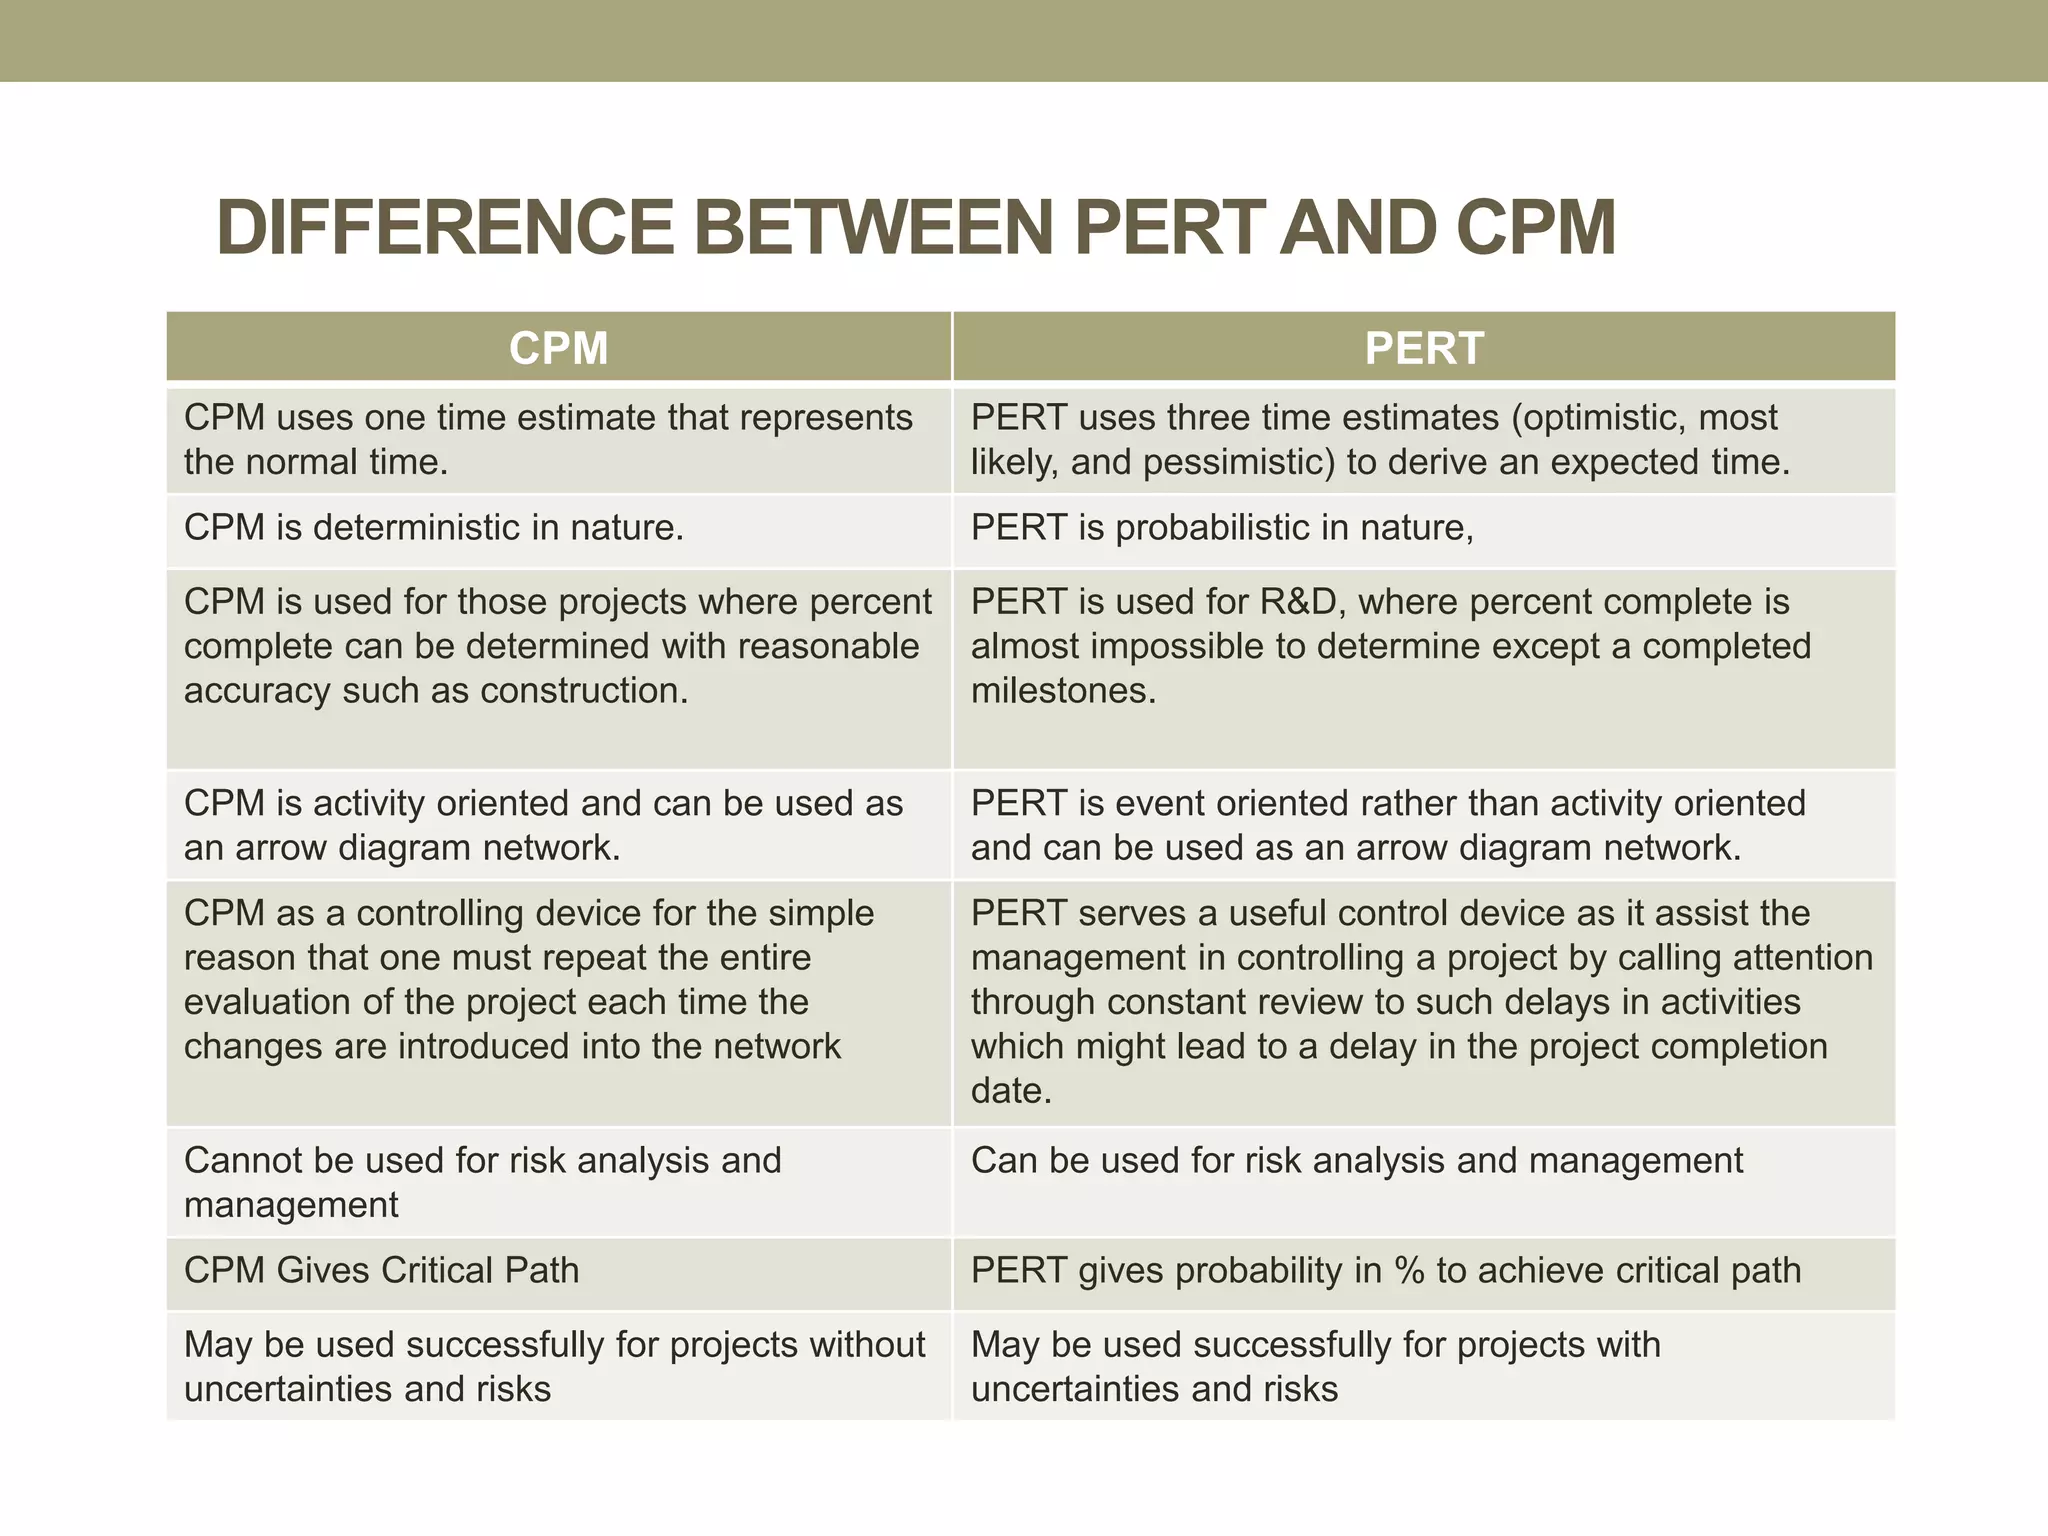
DIFFERENCE BETWEEN PERTAND CPM
CPM PERT
CPM uses one time estimate that represents
the normal time.
PERT uses three time estimates (optimistic, most
likely, and pessimistic) to derive an expected time.
CPM is deterministic in nature. PERT is probabilistic in nature,
CPM is used for those projects where percent
complete can be determined with reasonable
accuracy such as construction.
PERT is used for R&D, where percent complete is
almost impossible to determine except a completed
milestones.
CPM is activity oriented and can be used as
an arrow diagram network.
PERT is event oriented rather than activity oriented
and can be used as an arrow diagram network.
CPM as a controlling device for the simple
reason that one must repeat the entire
evaluation of the project each time the
changes are introduced into the network
PERT serves a useful control device as it assist the
management in controlling a project by calling attention
through constant review to such delays in activities
which might lead to a delay in the project completion
date.
Cannot be used for risk analysis and
management
Can be used for risk analysis and management
CPM Gives Critical Path PERT gives probability in % to achieve critical path
May be used successfully for projects without
uncertainties and risks
May be used successfully for projects with
uncertainties and risks
68.
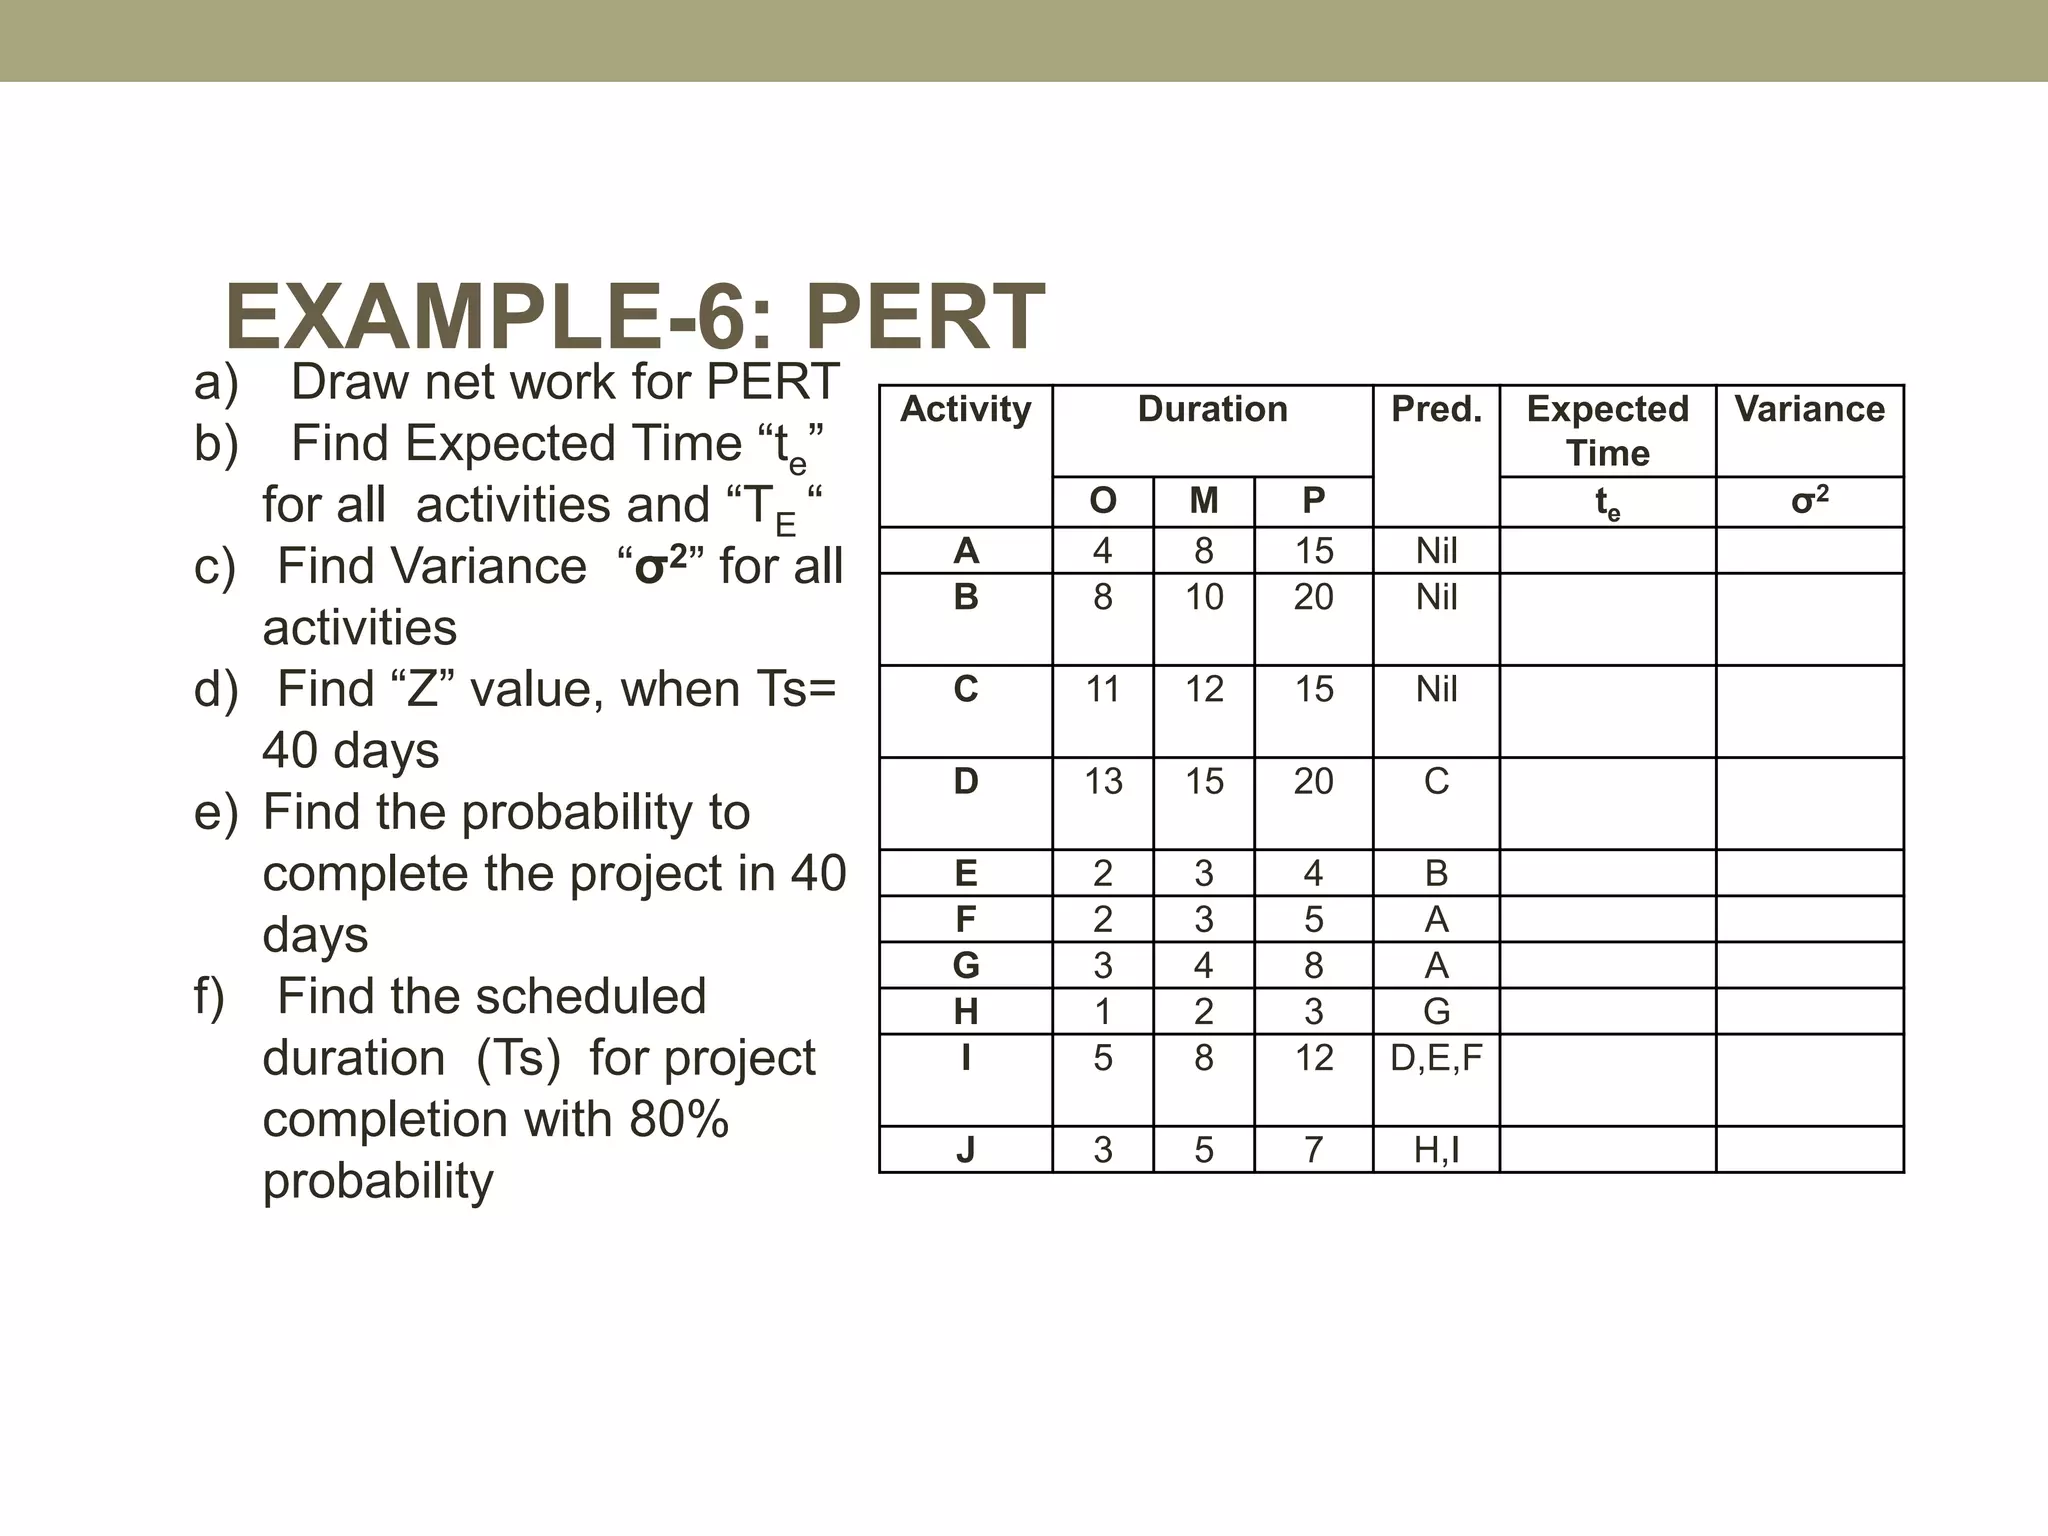
a) Draw network for PERT
b) Find Expected Time “te”
for all activities and “TE “
c) Find Variance “σ2” for all
activities
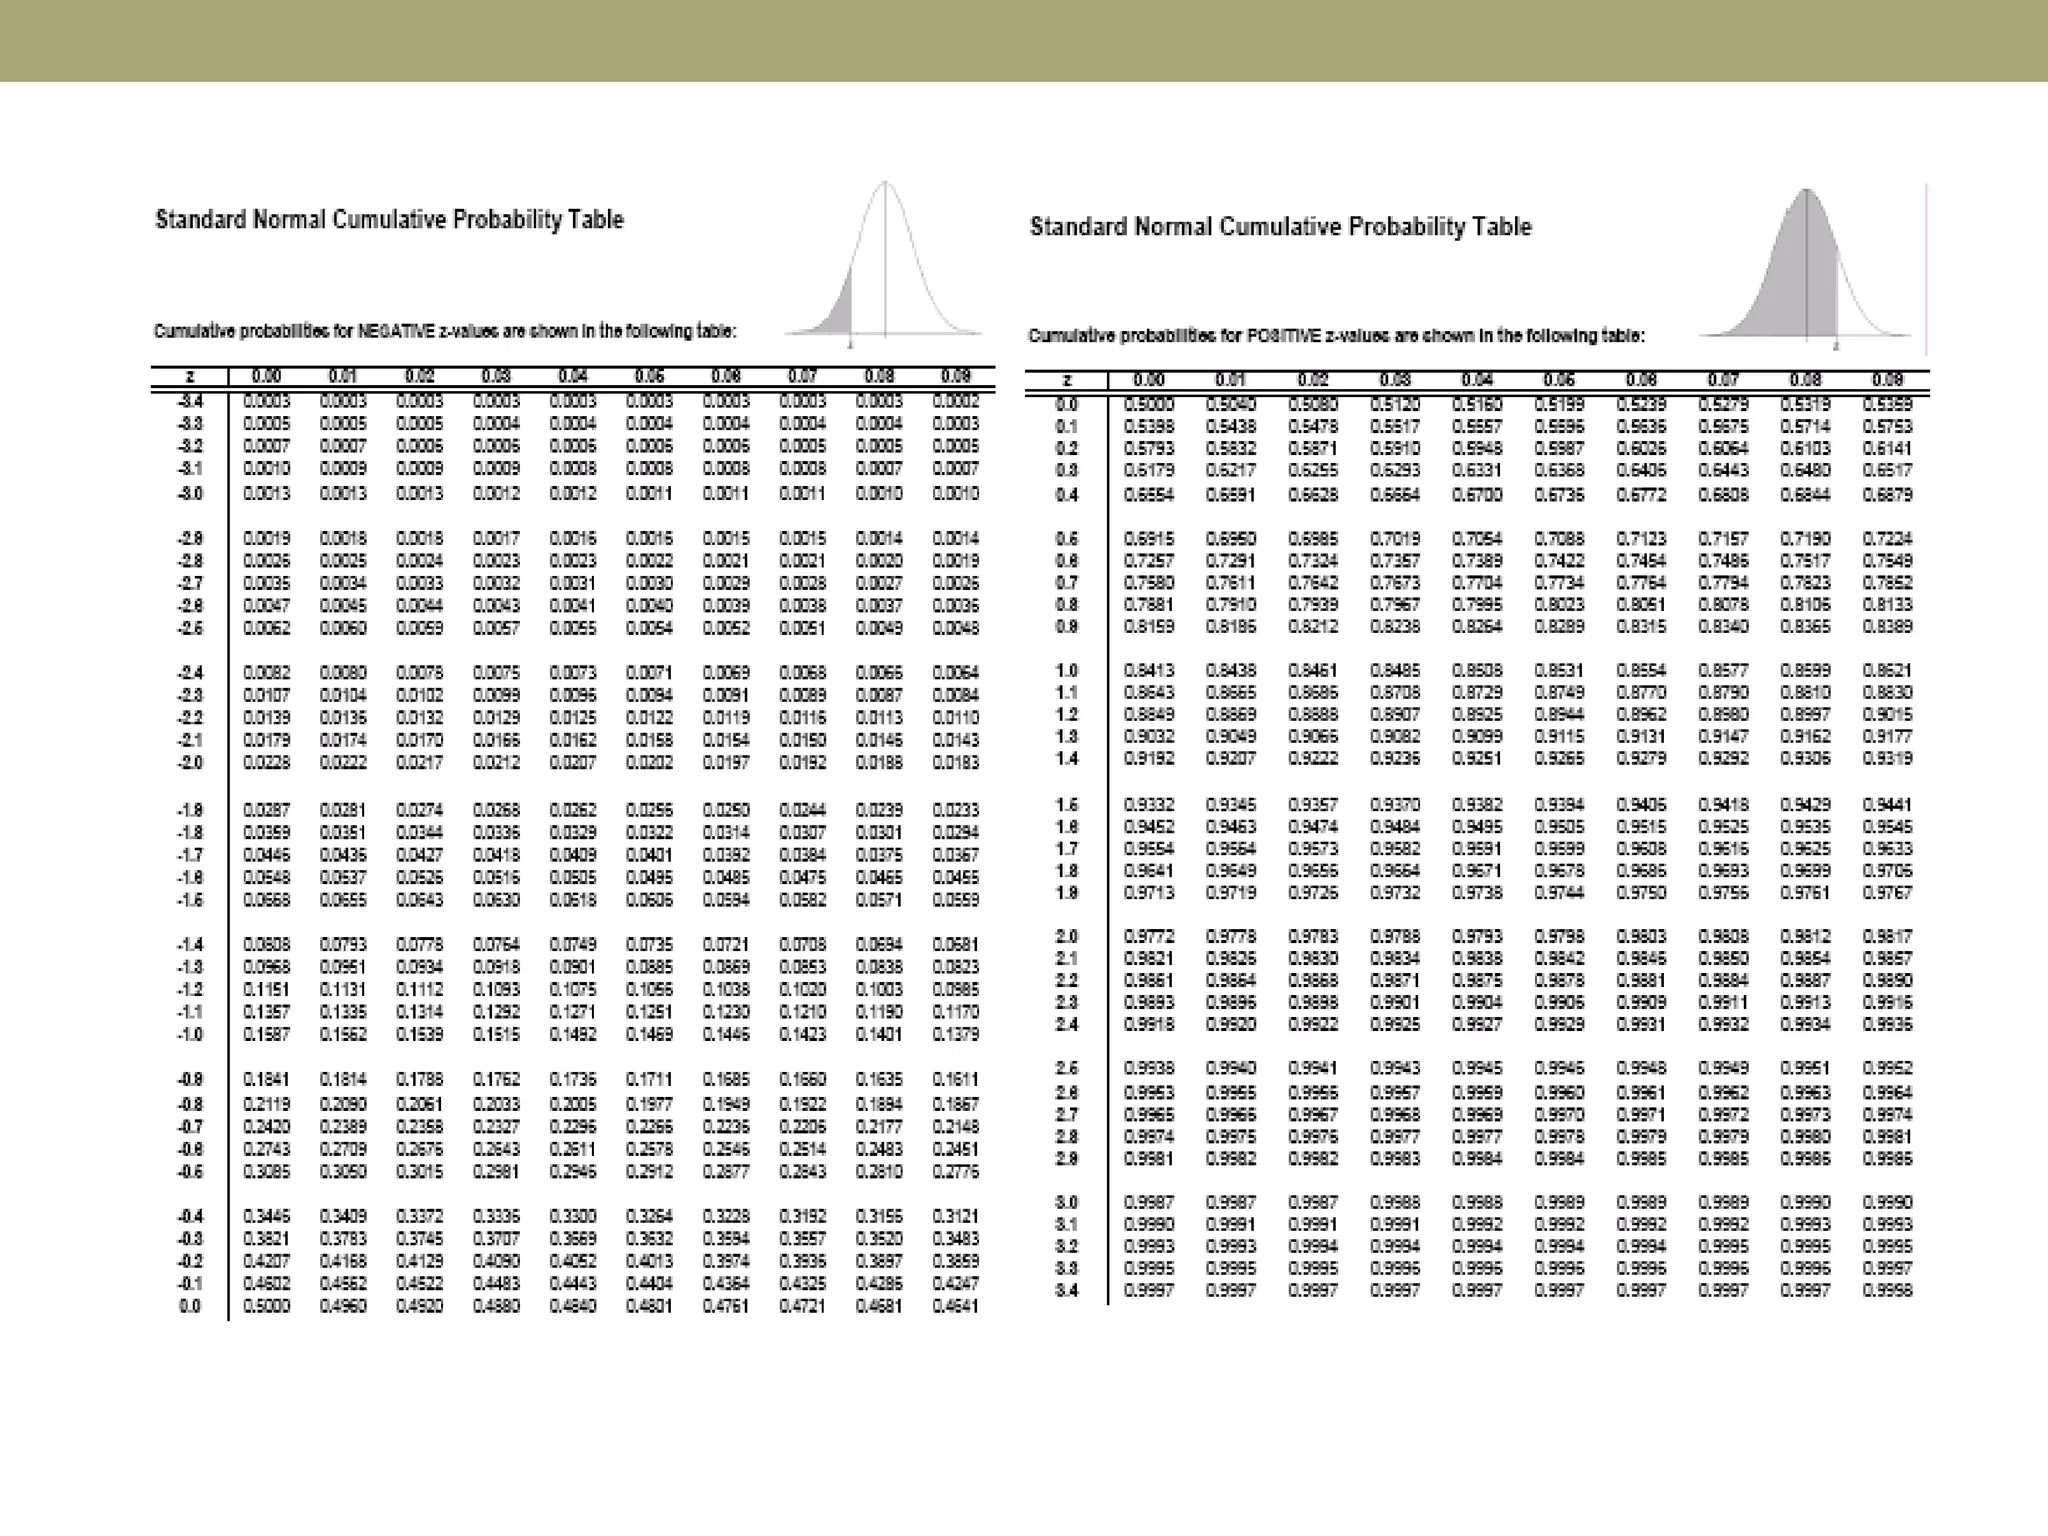
d) Find “Z” value, when Ts=
40 days
e) Find the probability to
complete the project in 40
days
f) Find the scheduled
duration (Ts) for project
completion with 80%
probability
EXAMPLE-6: PERT
Activity Duration Pred. Expected
Time
Variance
O M P te σ2
A 4 8 15 Nil
B 8 10 20 Nil
C 11 12 15 Nil
D 13 15 20 C
E 2 3 4 B
F 2 3 5 A
G 3 4 8 A
H 1 2 3 G
I 5 8 12 D,E,F
J 3 5 7 H,I
69.
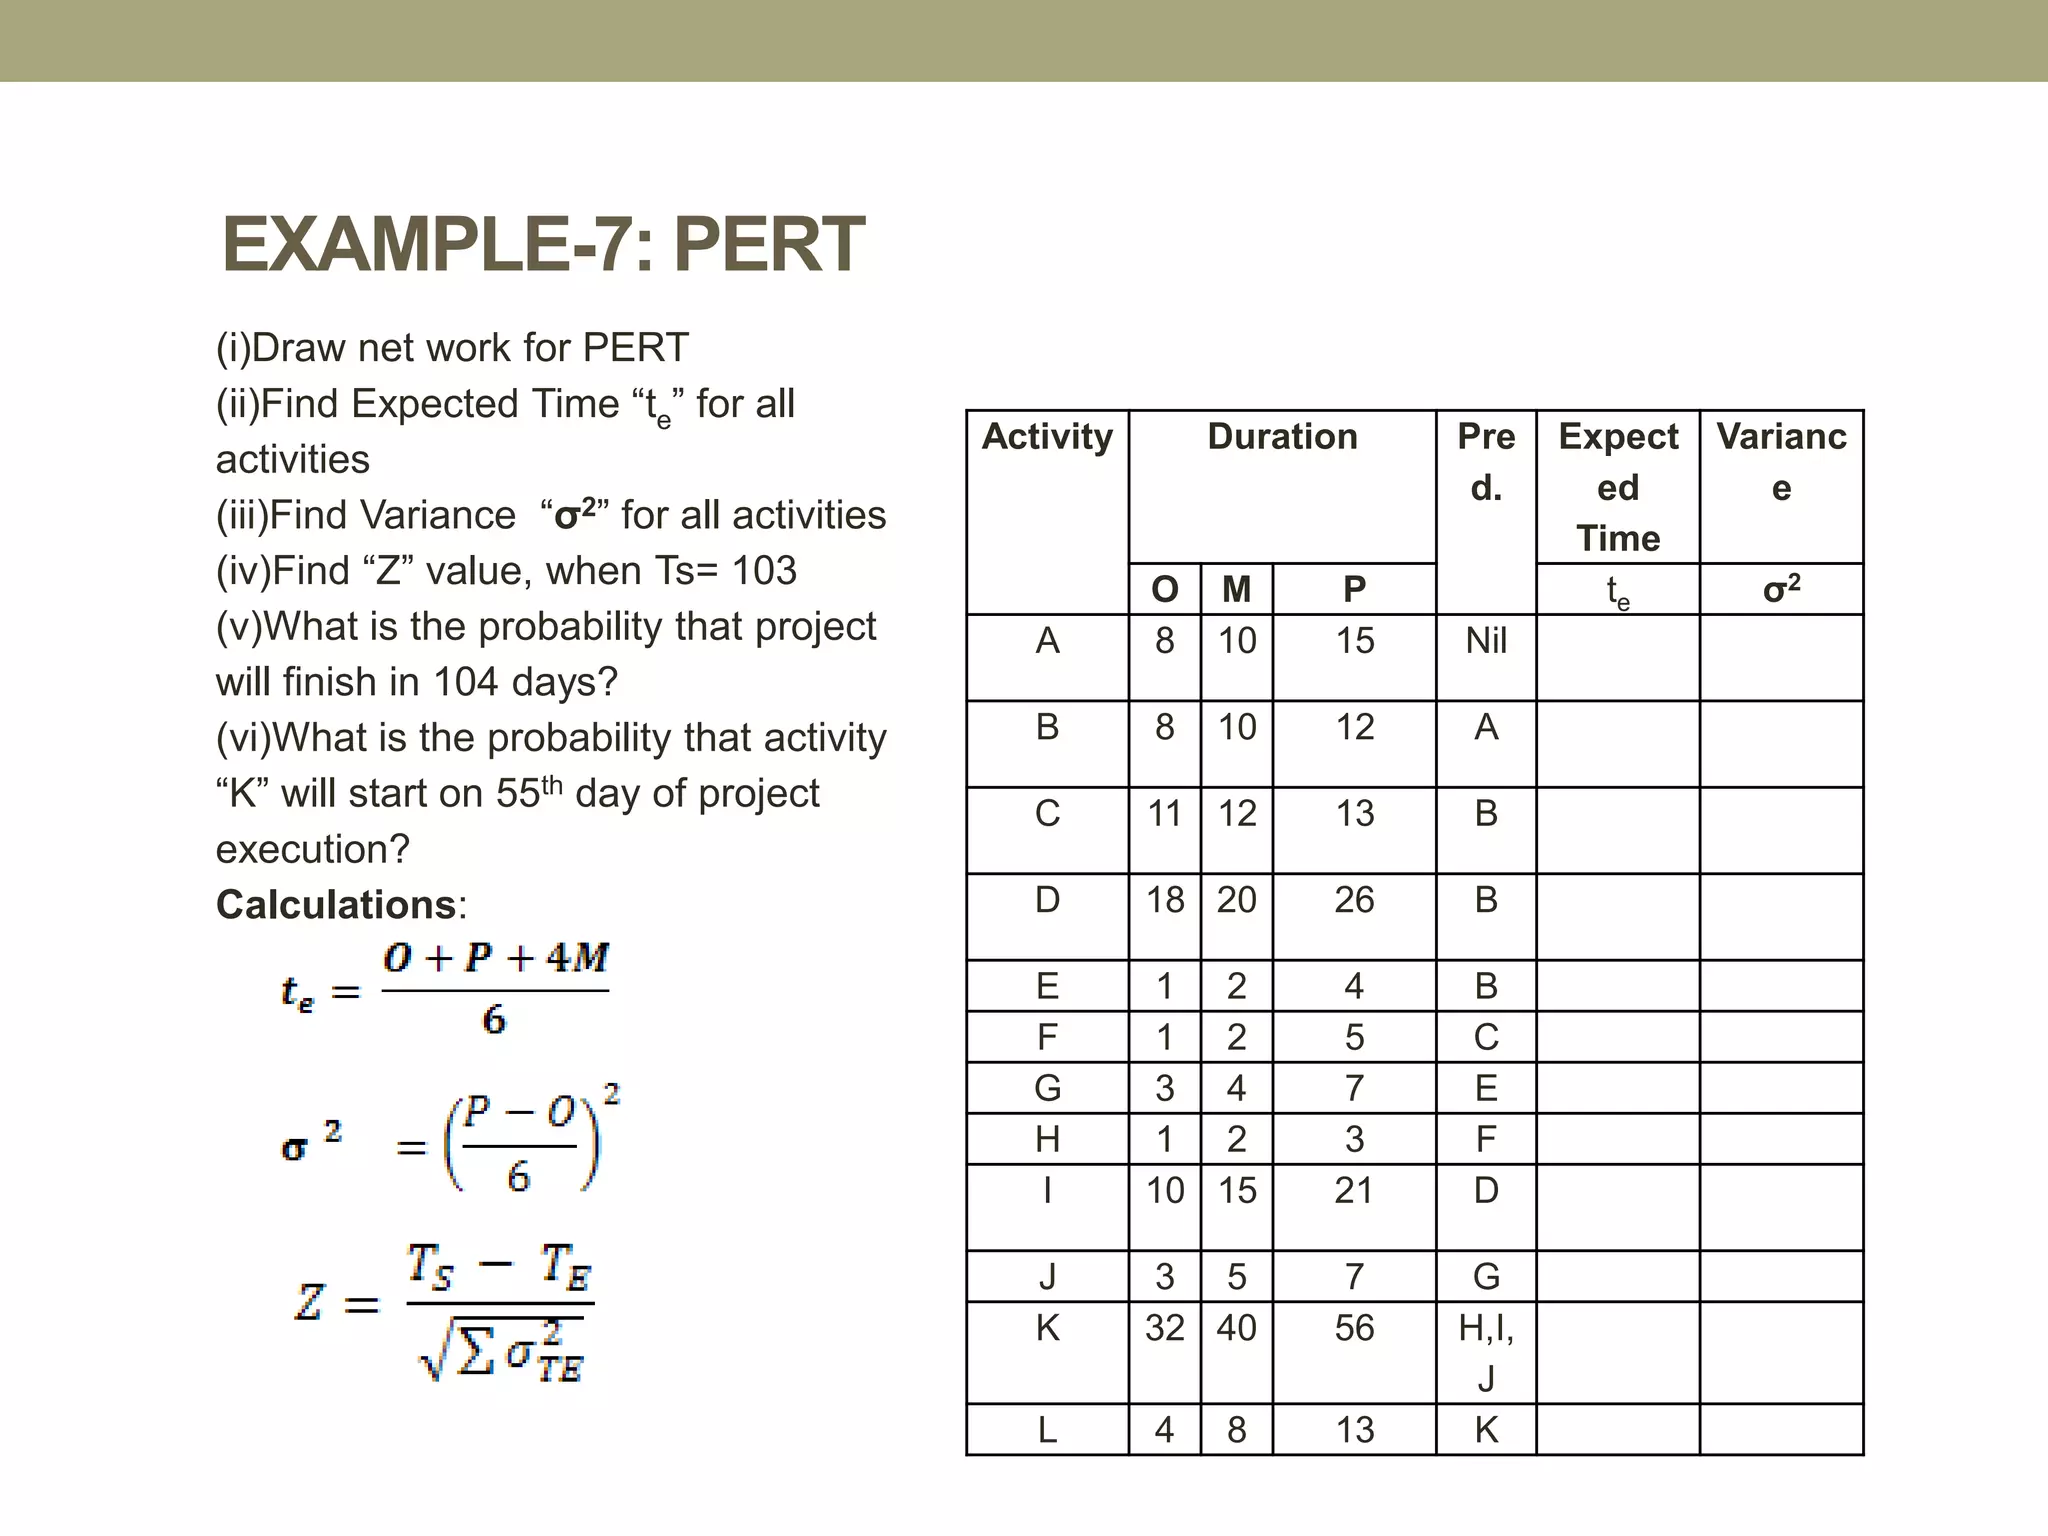
EXAMPLE-7: PERT
Activity DurationPre
d.
Expect
ed
Time
Varianc
e
O M P te σ2
A 8 10 15 Nil
B 8 10 12 A
C 11 12 13 B
D 18 20 26 B
E 1 2 4 B
F 1 2 5 C
G 3 4 7 E
H 1 2 3 F
I 10 15 21 D
J 3 5 7 G
K 32 40 56 H,I,
J
L 4 8 13 K
(i)Draw net work for PERT
(ii)Find Expected Time “te” for all
activities
(iii)Find Variance “σ2” for all activities
(iv)Find “Z” value, when Ts= 103
(v)What is the probability that project
will finish in 104 days?
(vi)What is the probability that activity
“K” will start on 55th day of project
execution?
Calculations:
70.
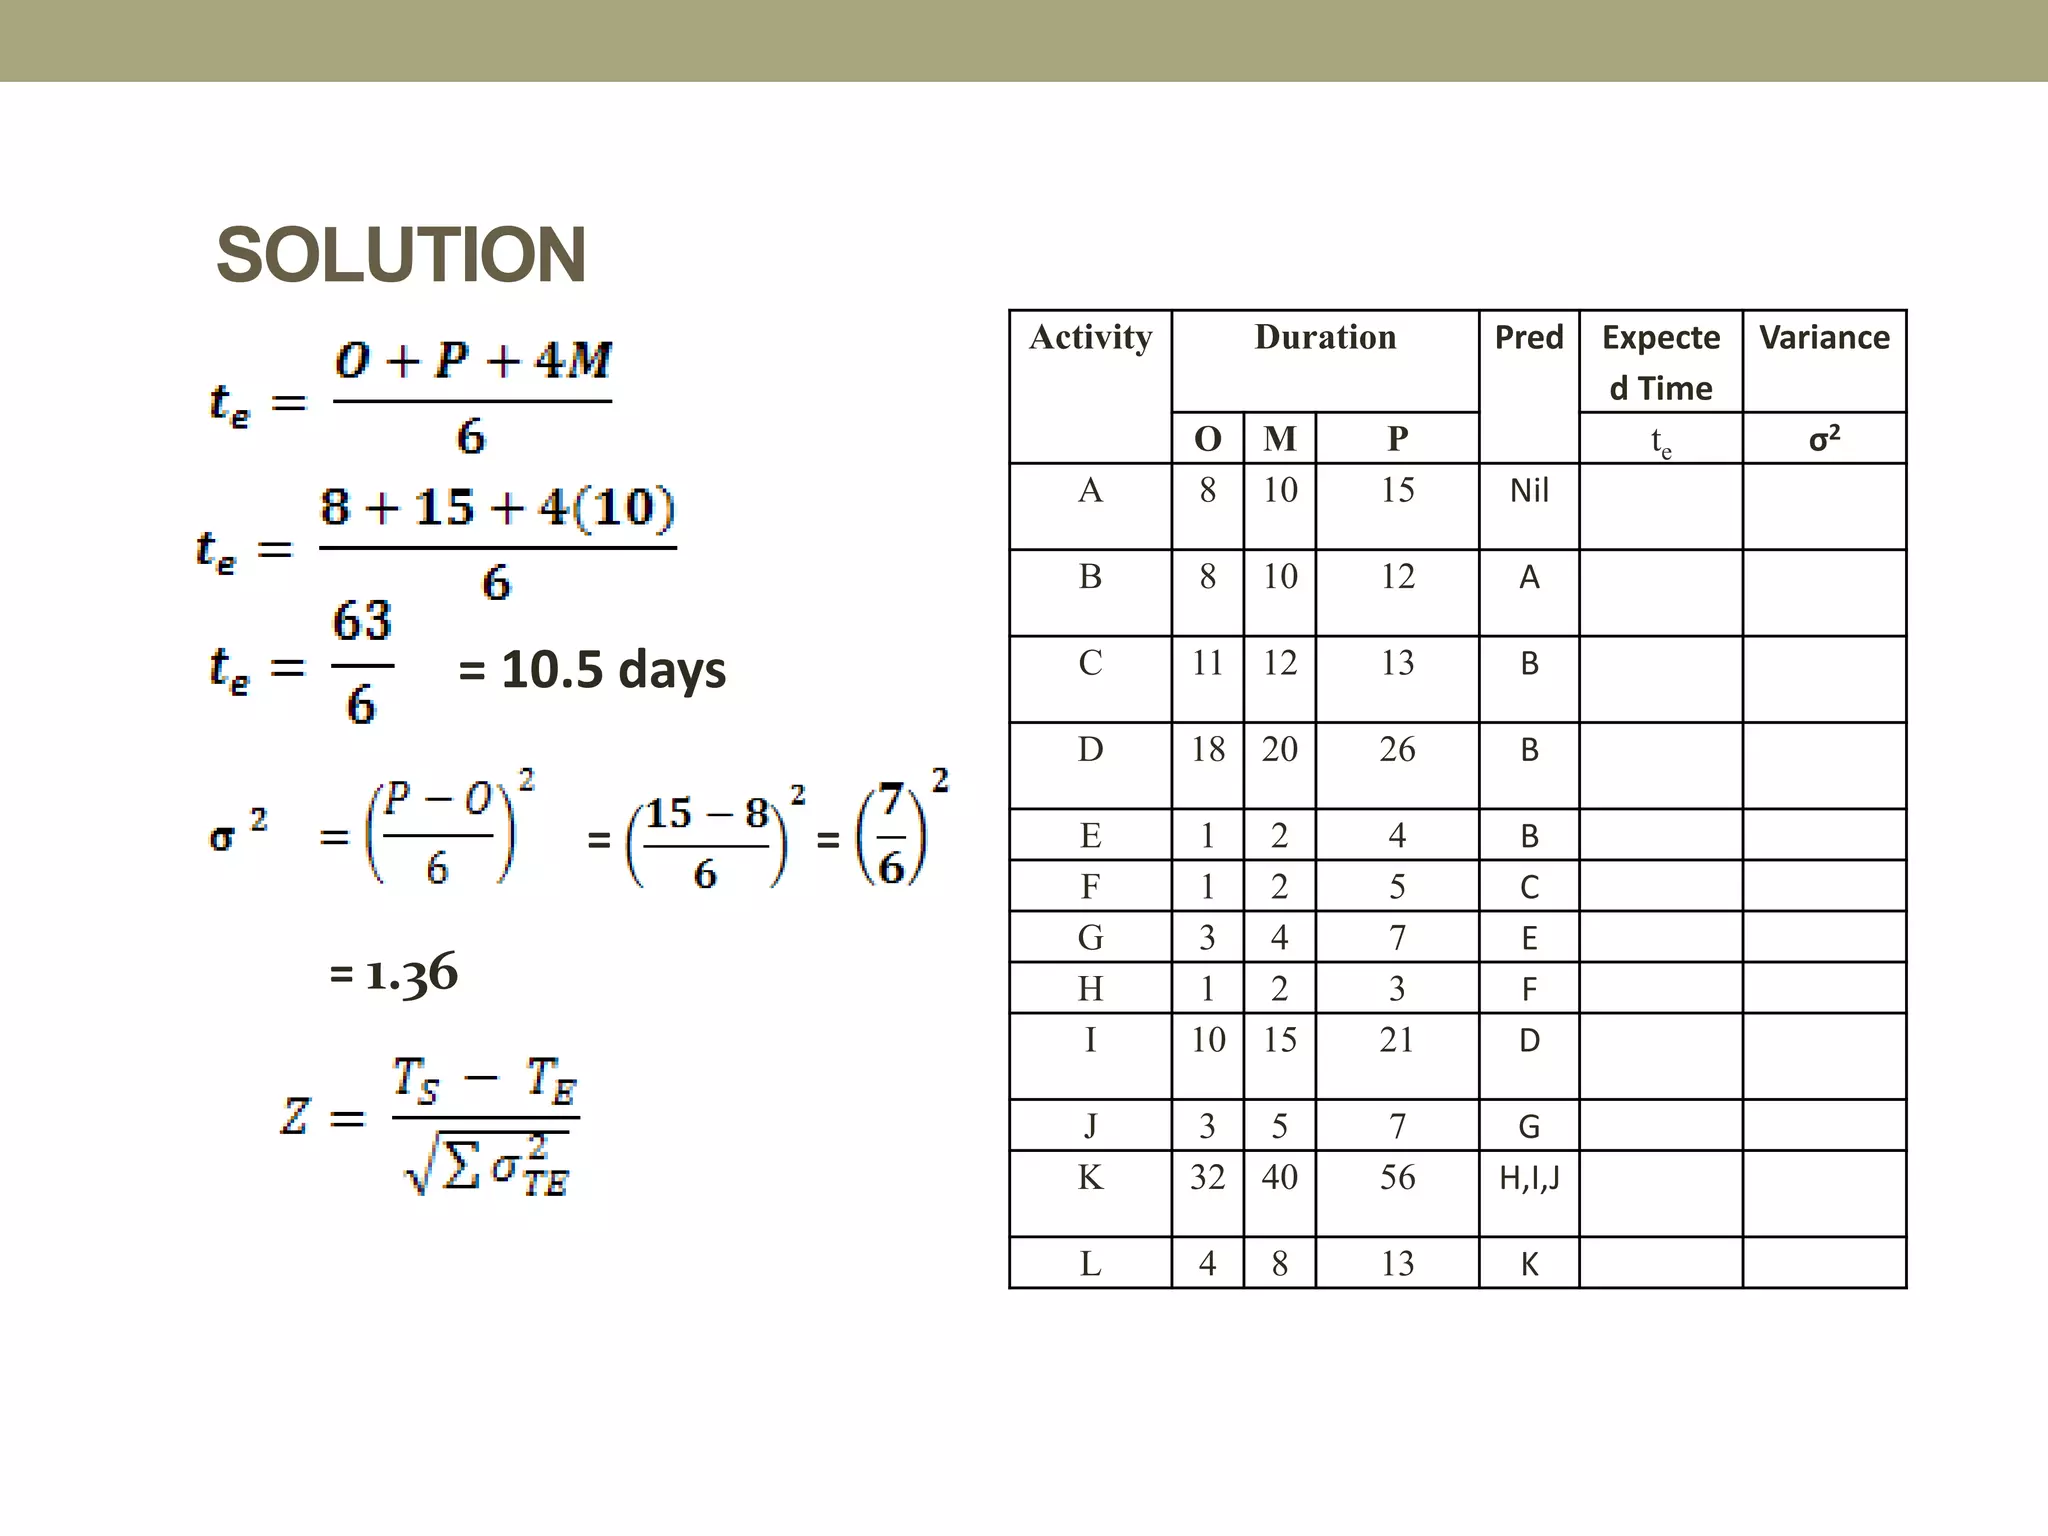
SOLUTION
Activity Duration PredExpecte
d Time
Variance
O M P te σ2
A 8 10 15 Nil
B 8 10 12 A
C 11 12 13 B
D 18 20 26 B
E 1 2 4 B
F 1 2 5 C
G 3 4 7 E
H 1 2 3 F
I 10 15 21 D
J 3 5 7 G
K 32 40 56 H,I,J
L 4 8 13 K
= 10.5 days
= =
= 1.36


![Municipal periodic plan in nepalese context [compatibility mode]](https://cdn.slidesharecdn.com/ss_thumbnails/municipalperiodicplaninnepalesecontextcompatibilitymode-141227095002-conversion-gate01-thumbnail.jpg?width=640&height=640&fit=bounds)