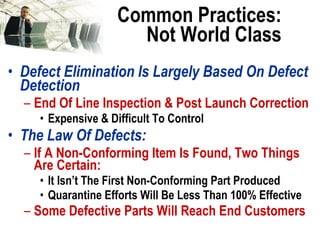
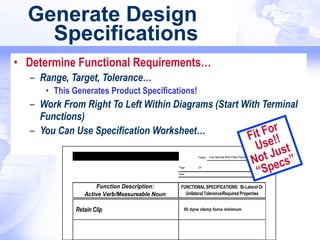
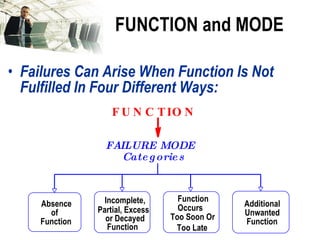
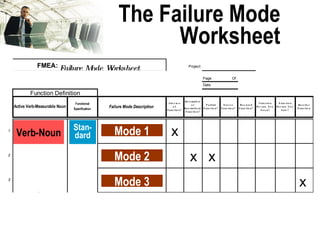
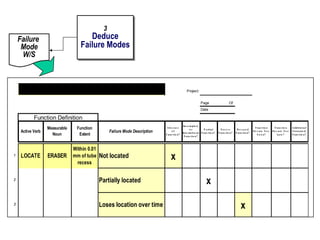
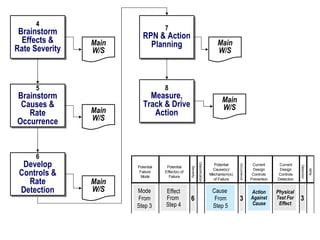
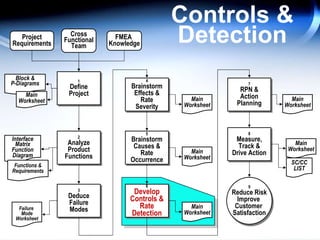
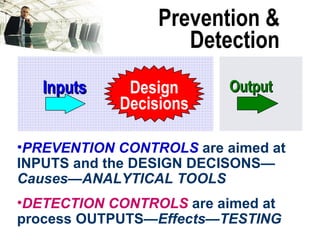
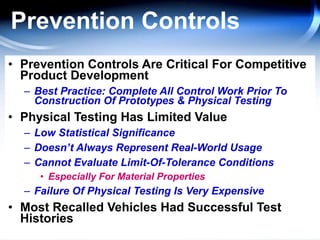
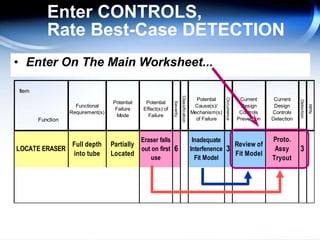
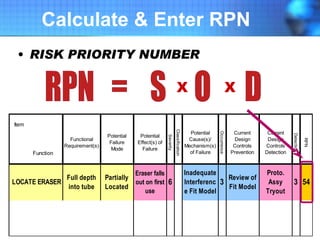
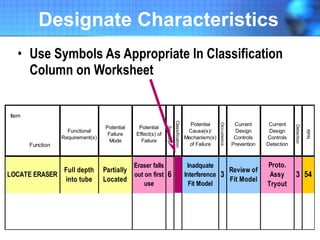
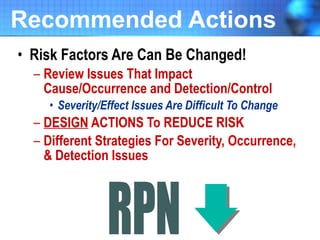
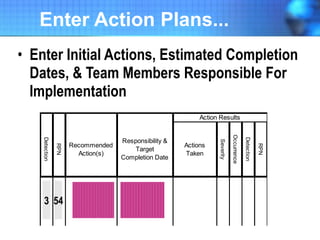
The document discusses the concept of 'world class' quality in manufacturing, emphasizing the importance of defect elimination rooted in preventive measures rather than detection. It introduces Failure Mode and Effects Analysis (FMEA) as a systematic approach to identifying risks, improving designs, and enabling better quality control through robust verification processes. The text outlines methods for evaluating product functions, potential failures, and the necessity of cross-functional collaboration to enhance customer satisfaction and reduce risks.


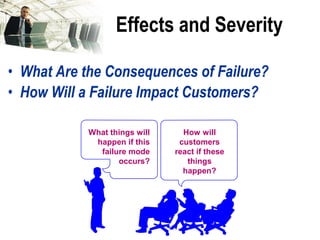
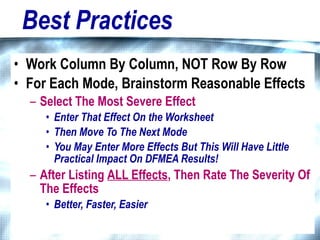
![Brainstorm EFFECTS For Each MODE When Multiple Effects Occur, Enter [At Least] The “Worst Case” Effect Brainstorm All Effects Before Rating Severity](https://image.slidesharecdn.com/lts2009dfmea-123832760789-phpapp02/85/Best-Damn-D-FMEA-Method-30-320.jpg)


![Fmea Handbook V4.1[1][1]](https://cdn.slidesharecdn.com/ss_thumbnails/fmeahandbookv4111-1310447612699-phpapp01-110712001630-phpapp01-thumbnail.jpg?width=640&height=640&fit=bounds)


