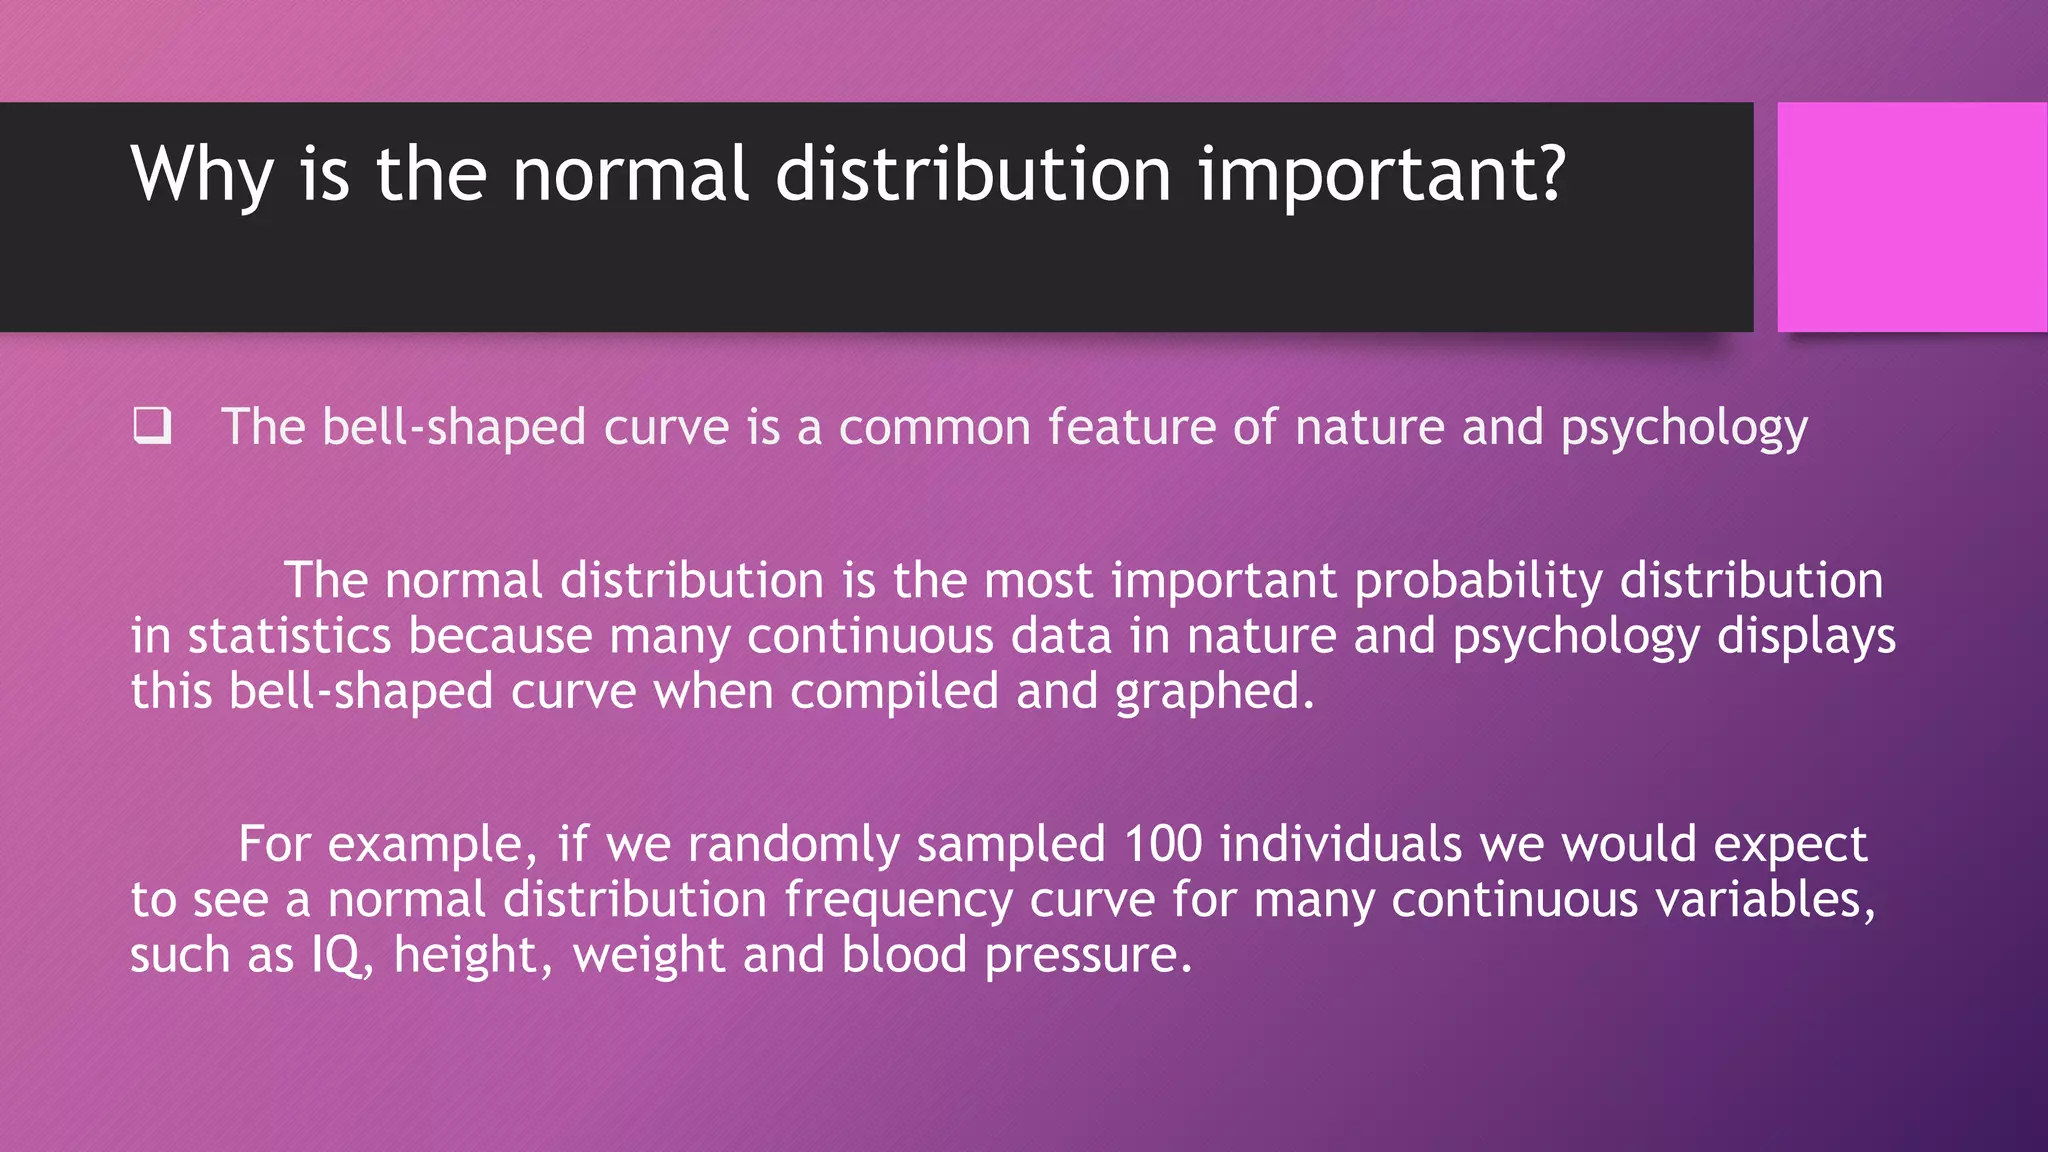
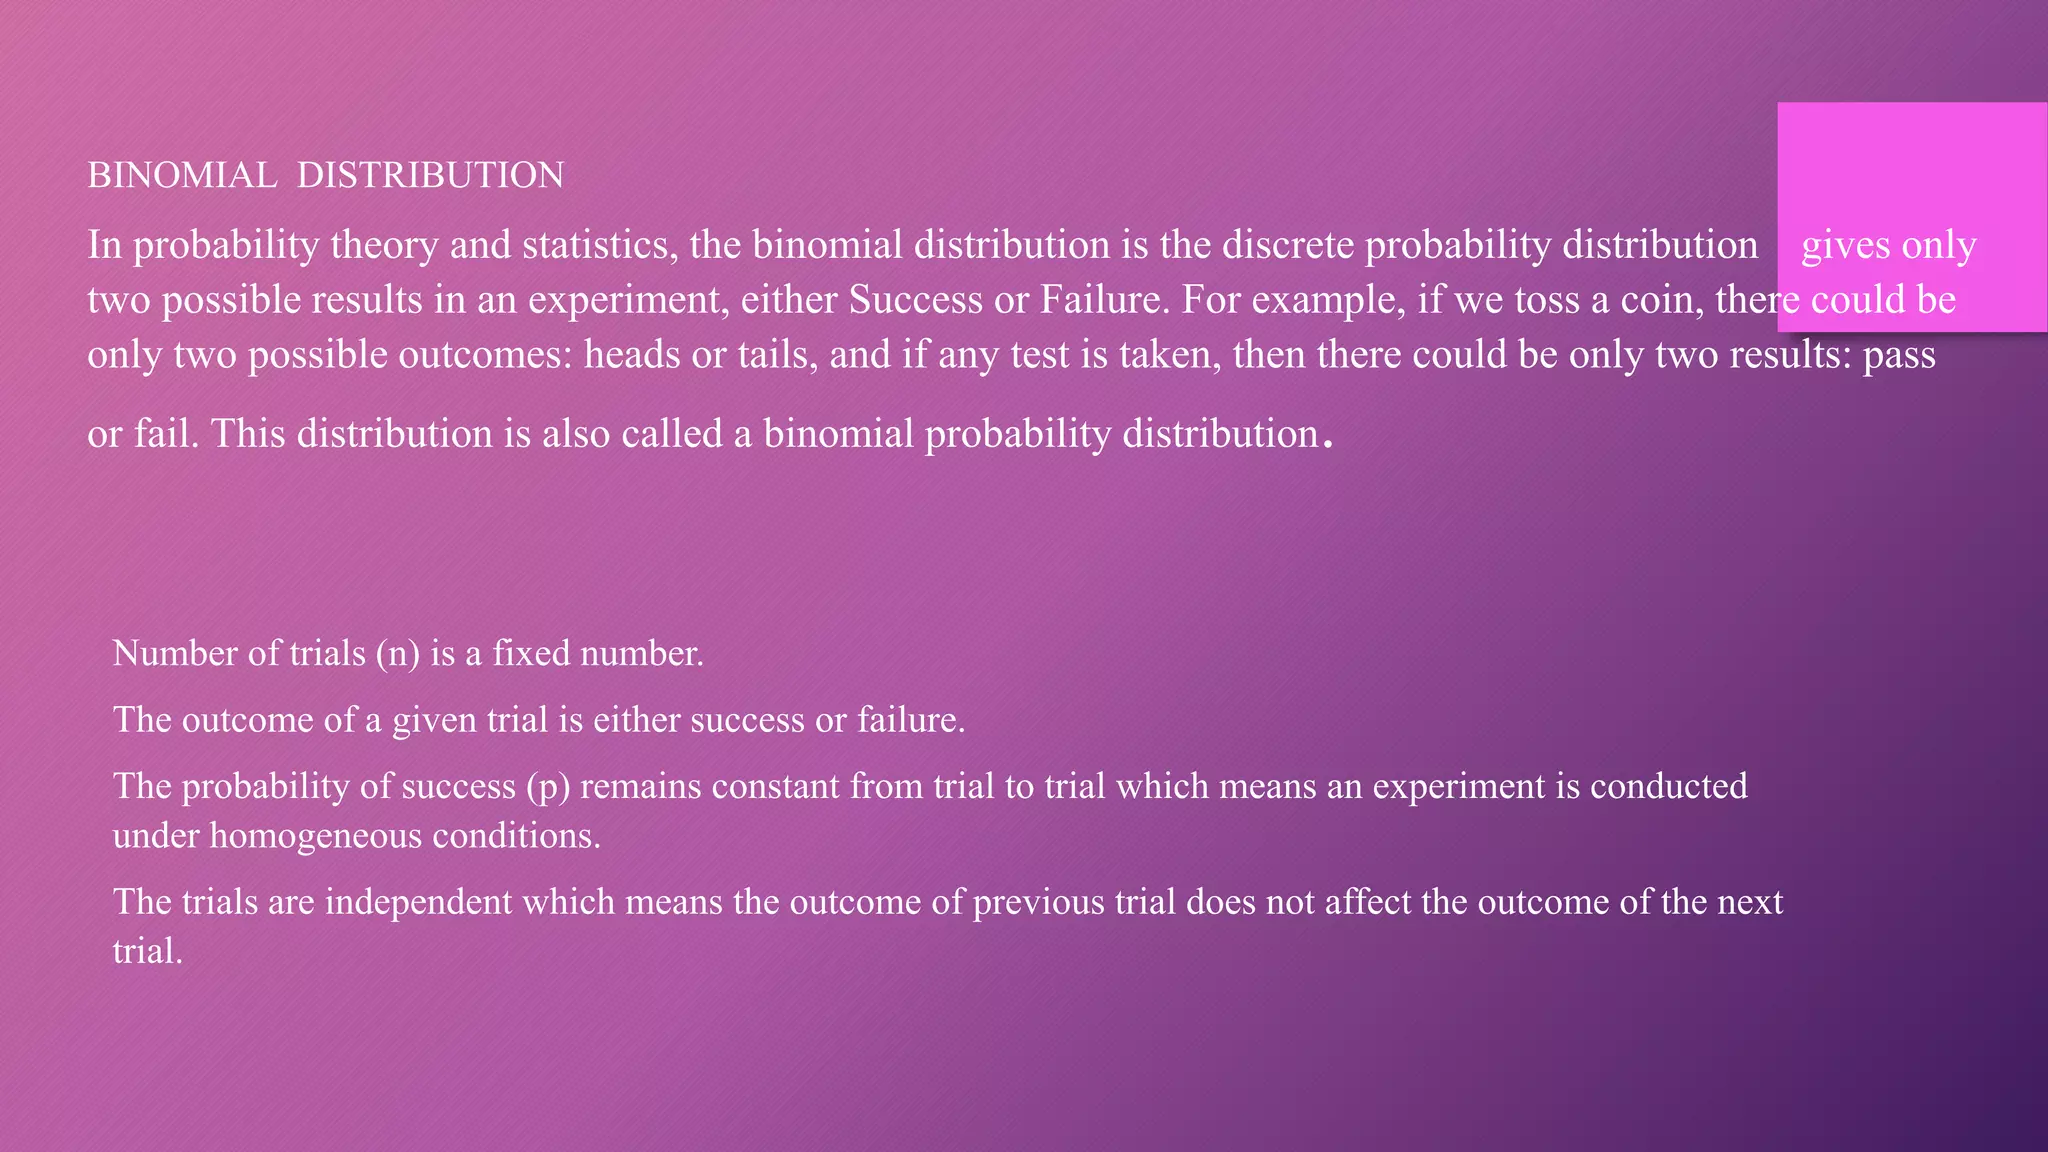
The document explains three fundamental probability distributions: binomial, Poisson, and normal distribution. Binomial distribution features two possible outcomes in fixed trials, while Poisson distribution addresses independent events over a fixed interval, and normal distribution describes continuous data with a bell-shaped curve. It also covers mean, variance, and their applications in real-life scenarios, alongside comparisons of the distributions.

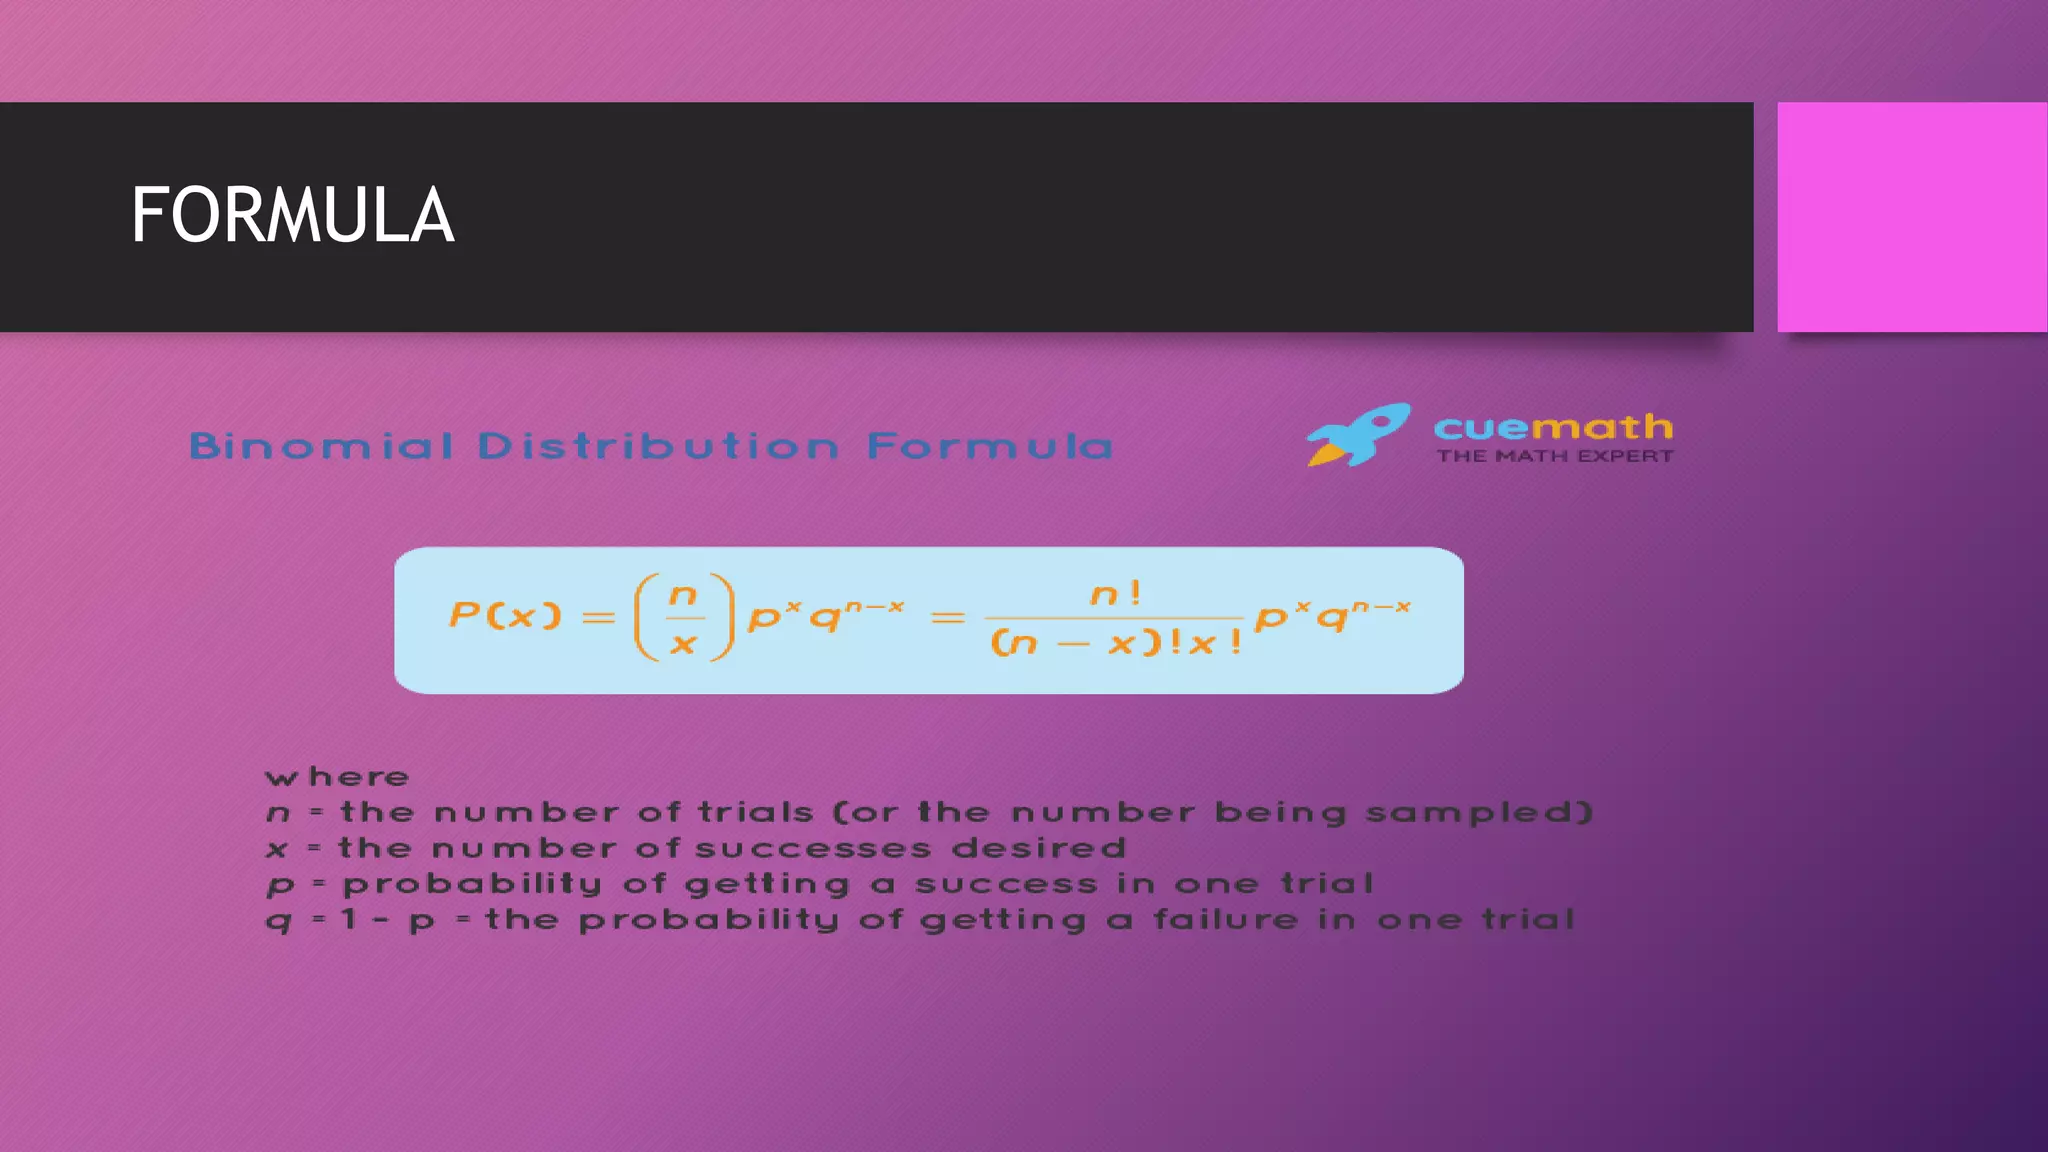
![The binomial distribution formula is for any random variable X, given by;
P(x:n,p) = nCx px (1-p)n-x
Where,
n = the number of experiments
x = 0, 1, 2, 3, 4, …
p = Probability of Success in a single experiment
q = Probability of Failure in a single experiment = 1 – p
The binomial distribution formula can also be written in the form of n-Bernoulli trials,
where nCx = n!/x!(n-x)!. Hence,
P(x:n,p) = n!/[x!(n-x)!].px.(q)n-x](https://image.slidesharecdn.com/binomialpoissonandnormaldistribution-221219042035-3aefa4b3/75/BINOMIAL-POISSON-AND-NORMAL-DISTRIBUTION-pptx-6-2048.jpg)
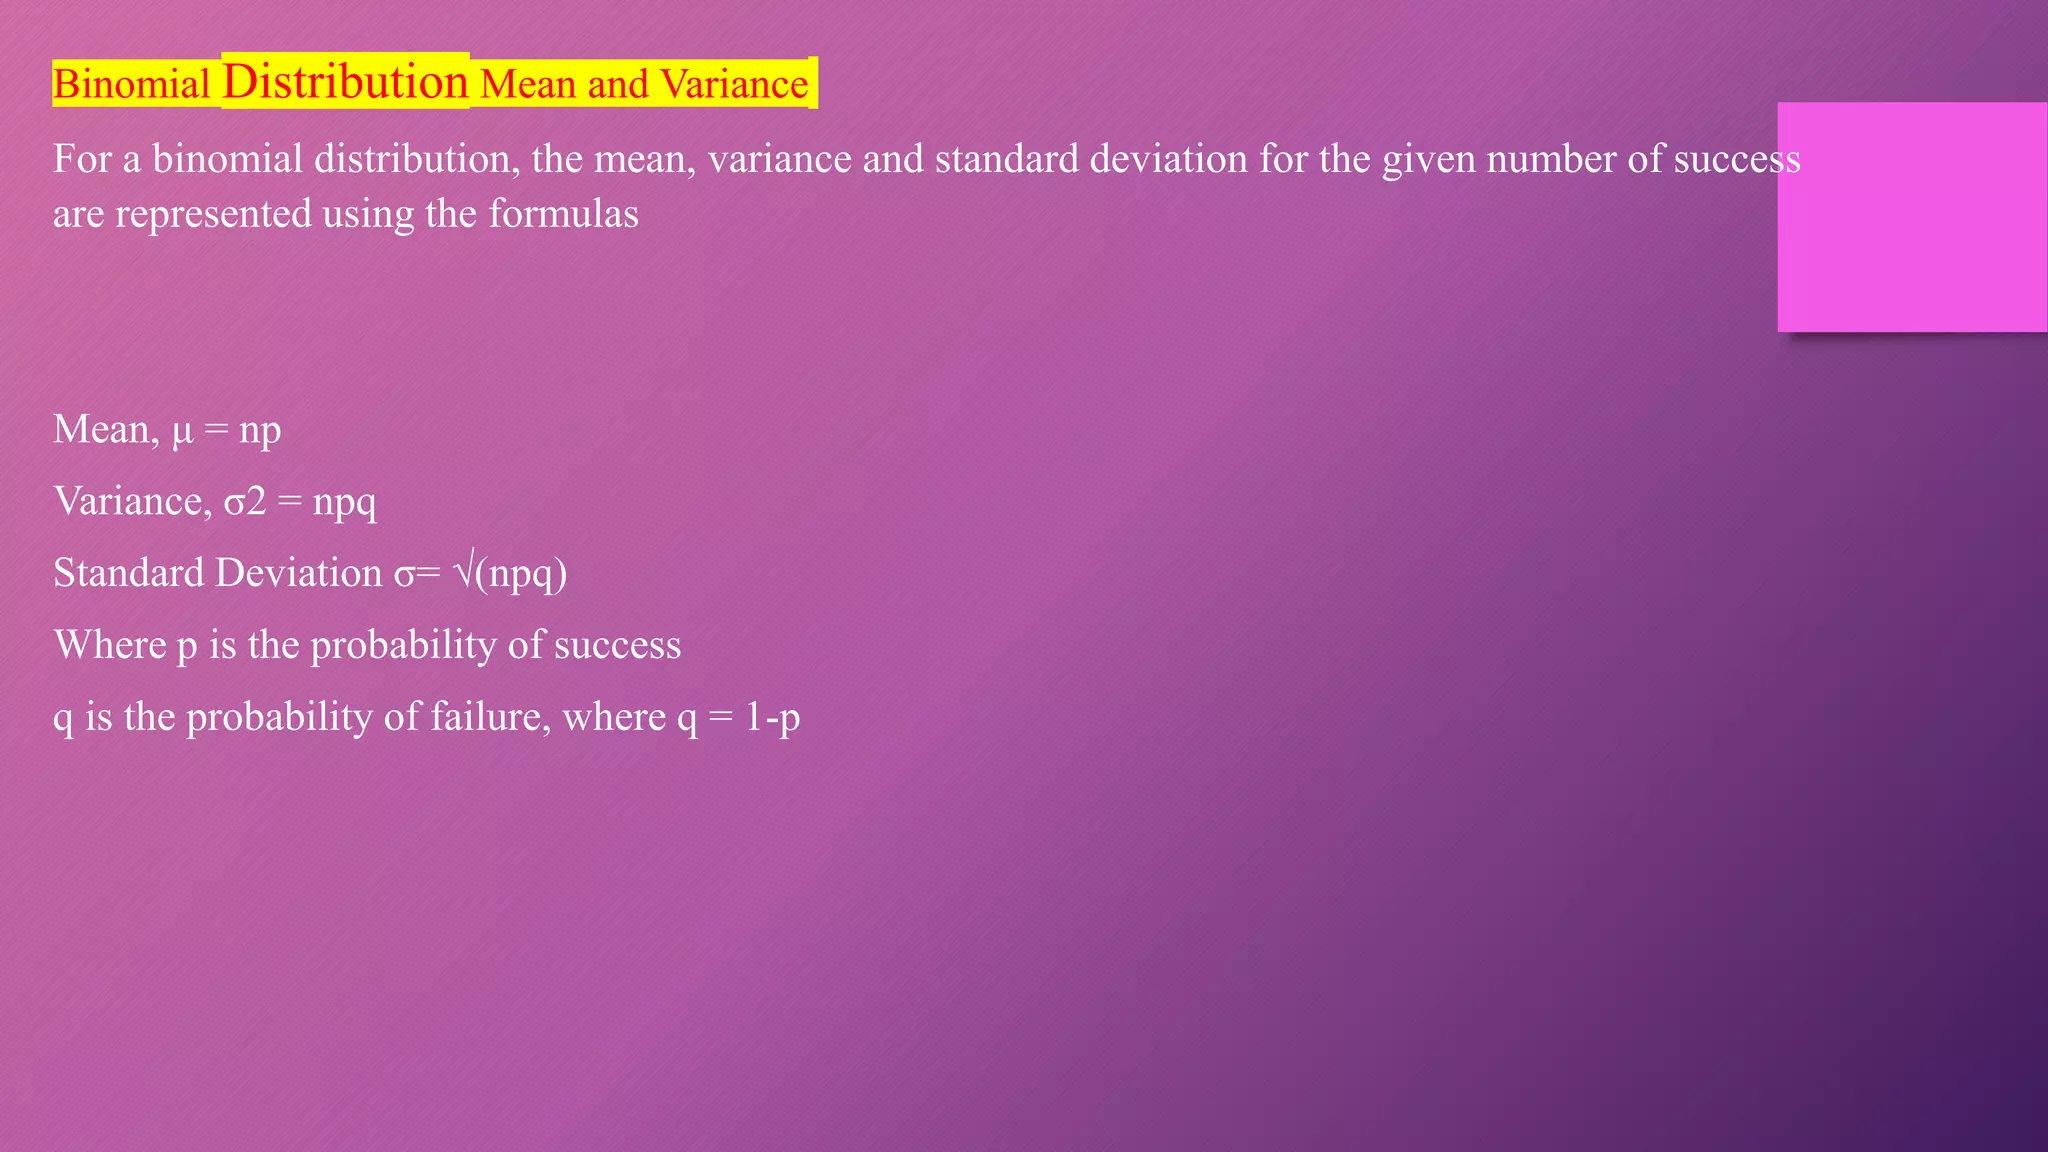
![It is a p.m.f.(probability mass function).
The parameters of Binomial Distribution are ’n’ and ‘p’ where, n - number of trials and p - probability of
success.
Mean of Binomial Distribution = np
Variance of Binomial Distribution = npq (here q=1-p)
Mode of Binomial Distribution is integral part of (n+1)p, if (n+1)p is not an integer. But, if (n+1)p is an
integer, then the distribution has two modal values, (n+1)p and [(n+1)p] - 1.
q- probability of failure, q < 1, hence, npq < np. Thus, Variance is less than Mean.
If p=q=1/2, then the distribution is symmetric about median and if p is not equal to q, then it is skewed
distribution.
Additive property of Binomial Distribution : If X and Y are independent variables such that X follows
Binomial Distribution with (n1, p) and Y follows Binomial Distribution with (n2, p), then (X+Y) follows
Binomial Distribution with (n1+n2, p).
If X1, X2,…., Xn are independent and identically distributed Bernoulli variates each with parameter p, then
their addition follows Binomial Distribution with (n, p).](https://image.slidesharecdn.com/binomialpoissonandnormaldistribution-221219042035-3aefa4b3/75/BINOMIAL-POISSON-AND-NORMAL-DISTRIBUTION-pptx-9-2048.jpg)