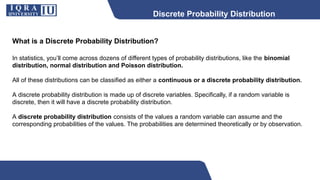
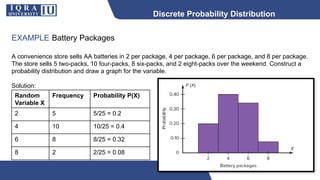
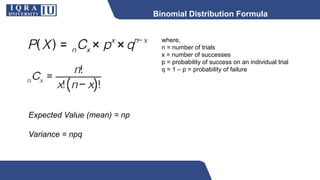
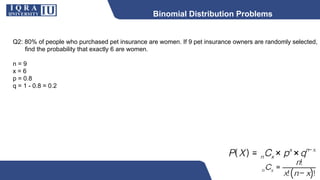
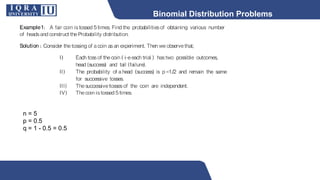
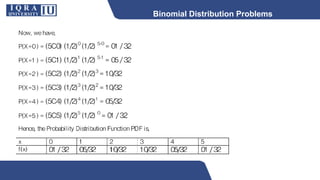
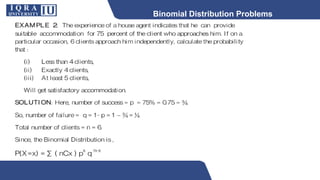
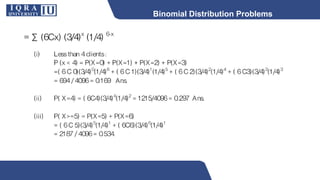
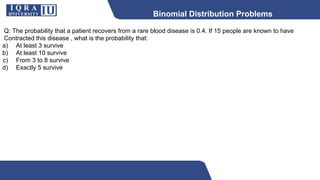
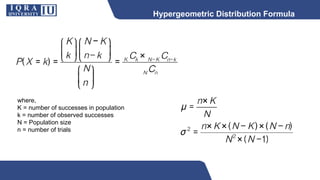
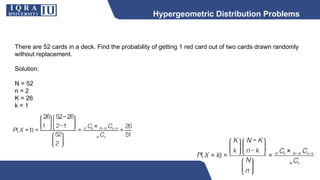
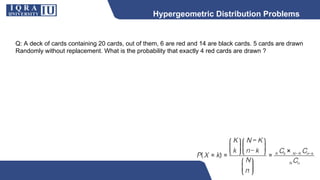
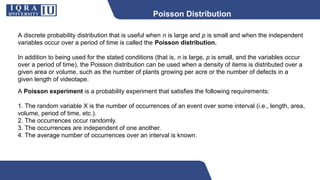
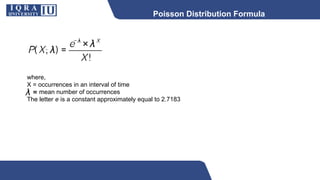
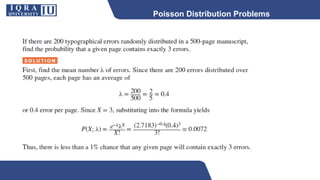
Discrete Probability Distributions
• Binomial Distribution
• Hyper geometric Distribution
• Poisson Distribution
By: Syed Saiq Hussain
What is a Discrete Probability Distribution?
In statistics, you’ll come across dozens of different types of probability distributions, like the binomial
distribution, normal distribution and Poisson distribution.
All of these distributions can be classified as either a continuous or a discrete probability distribution.
A discrete probability distribution is made up of discrete variables. Specifically, if a random variable is
discrete, then it will have a discrete probability distribution.
A discrete probability distribution consists of the values a random variable can assume and the
corresponding probabilities of the values. The probabilities are determined theoretically or by observation.
Discrete Probability Distribution
EXAMPLE Rolling a die
Discrete Probability Distribution
EXAMPLE Tossing three coins`
When three coins are tossed, the sample space is represented as :
TTT, TTH, THT, HTT, HHT, HTH, THH, HHH
If X is the random variable for the number of heads, then X assumes the value 0, 1, 2, or 3.
Probabilities for the values of X can be determined as follows:
Discrete Probability Distribution
EXAMPLE Battery Packages
A convenience store sells AA batteries in 2 per package, 4 per package, 6 per package, and 8 per package.
The store sells 5 two-packs, 10 four-packs, 8 six-packs, and 2 eight-packs over the weekend. Construct a
probability distribution and draw a graph for the variable.
Solution:
Random
Variable X
Frequency Probability P(X)
2 5 5/25 = 0.2
4 10 10/25 = 0.4
6 8 8/25 = 0.32
8 2 2/25 = 0.08
Binomial Distribution
A binomial distribution can be thought of as simply the probability of a SUCCESS or FAILURE
outcome in an experiment or survey that is repeated multiple times.
The binomial is a type of distribution that has two possible outcomes (the prefix “bi” means two, or
twice).
For example, a coin toss has only two possible outcomes: heads or tails and taking a test could have
two possible outcomes: pass or fail.
When a 6-sided die is rolled, it will either land on an odd or even number.
In a basketball game, a team either wins or loses.
A true/false item can be answered in only two ways, true or false.
Binomial Distribution
Other situations can be reduced to two outcomes. For example, a medical treatment can be classified as
effective or ineffective, depending on the results.
A person can be classified as having normal or abnormal blood pressure, depending on the measure of
the blood pressure gauge.
A multiple- choice question, even though there are four or five answer choices, can be classified as correct
or incorrect.
Situations like these are called binomial experiments.
The outcomes of a binomial experiment and the corresponding probabilities of these
outcomes are called a binomial distribution.
Binomial Distribution
A binomial experiment is a probability experiment that satisfies the following four requirements:
1. There must be a fixed number of trials.
2. Each trial can have only two outcomes or outcomes that can be reduced to two outcomes. These
outcomes can be considered as either success or failure.
3. The outcomes of each trial must be independent of one another.
4. The probability of a success must remain the same for each trial.
Binomial Distribution
Binomial Distribution Formula
where,
n = number of trials
x = number of successes
p = probability of success on an individual trial
q = 1 – p = probability of failure
Expected Value (mean) = np
Variance = npq
Binomial Distribution Problems
Q1: Find the probability of getting 4 heads if the coin is tossed 5 times, find mean and
variance as well.
Solution:
n = 5
x = 4
p = 0.5
q = 1 - 0.5 = 0.5
Binomial Distribution Problems
Q2: 80% of people who purchased pet insurance are women. If 9 pet insurance owners are randomly selected,
find the probability that exactly 6 are women.
n = 9
x = 6
p = 0.8
q = 1 - 0.8 = 0.2
n = 5
p = 0.5
q = 1 - 0.5 = 0.5
Binomial Distribution Problems
Q: The probability that a patient recovers from a rare blood disease is 0.4. If 15 people are known to have
Contracted this disease , what is the probability that:
a) At least 3 survive
b) At least 10 survive
c) From 3 to 8 survive
d) Exactly 5 survive
Binomial Distribution Problems
Hypergeometric Distribution
Types of application for the hypergeometric are very similar to those for the binomial distribution
The hypergeometric distribution is a distribution of a variable that has two outcomes when sampling
is done without replacement
A hypergeometric experiment is a probability experiment that has the following requirements:
1. There are a fixed number of trials.
2. There are two outcomes, and they can be classified as success or failure.
3. The sample is selected without replacement.
Hypergeometric Distribution Formula
where,
K = number of successes in population
k = number of observed successes
N = Population size
n = number of trials
Hypergeometric Distribution Problems
There are 52 cards in a deck. Find the probability of getting 1 red card out of two cards drawn randomly
without replacement.
Solution:
N = 52
n = 2
K = 26
k = 1
Hypergeometric Distribution Problems
Q: A deck of cards containing 20 cards, out of them, 6 are red and 14 are black cards. 5 cards are drawn
Randomly without replacement. What is the probability that exactly 4 red cards are drawn ?
Poisson Distribution
A discrete probability distribution that is useful when n is large and p is small and when the independent
variables occur over a period of time is called the Poisson distribution.
In addition to being used for the stated conditions (that is, n is large, p is small, and the variables occur
over a period of time), the Poisson distribution can be used when a density of items is distributed over a
given area or volume, such as the number of plants growing per acre or the number of defects in a
given length of videotape.
A Poisson experiment is a probability experiment that satisfies the following requirements:
1. The random variable X is the number of occurrences of an event over some interval (i.e., length, area,
volume, period of time, etc.).
2. The occurrences occur randomly.
3. The occurrences are independent of one another.
4. The average number of occurrences over an interval is known.
Poisson Distribution Formula
where,
X = occurrences in an interval of time
mean number of occurrences
The letter e is a constant approximately equal to 2.7183
Poisson Distribution Problems
Thank you

Discrete PDs(1).pdf

  • 1.
    Discrete Probability Distributions •Binomial Distribution • Hyper geometric Distribution • Poisson Distribution By: Syed Saiq Hussain
  • 2.
    What is aDiscrete Probability Distribution? In statistics, you’ll come across dozens of different types of probability distributions, like the binomial distribution, normal distribution and Poisson distribution. All of these distributions can be classified as either a continuous or a discrete probability distribution. A discrete probability distribution is made up of discrete variables. Specifically, if a random variable is discrete, then it will have a discrete probability distribution. A discrete probability distribution consists of the values a random variable can assume and the corresponding probabilities of the values. The probabilities are determined theoretically or by observation. Discrete Probability Distribution
  • 3.
  • 4.
    Discrete Probability Distribution EXAMPLETossing three coins` When three coins are tossed, the sample space is represented as : TTT, TTH, THT, HTT, HHT, HTH, THH, HHH If X is the random variable for the number of heads, then X assumes the value 0, 1, 2, or 3. Probabilities for the values of X can be determined as follows:
  • 5.
    Discrete Probability Distribution EXAMPLEBattery Packages A convenience store sells AA batteries in 2 per package, 4 per package, 6 per package, and 8 per package. The store sells 5 two-packs, 10 four-packs, 8 six-packs, and 2 eight-packs over the weekend. Construct a probability distribution and draw a graph for the variable. Solution: Random Variable X Frequency Probability P(X) 2 5 5/25 = 0.2 4 10 10/25 = 0.4 6 8 8/25 = 0.32 8 2 2/25 = 0.08
  • 6.
    Binomial Distribution A binomialdistribution can be thought of as simply the probability of a SUCCESS or FAILURE outcome in an experiment or survey that is repeated multiple times. The binomial is a type of distribution that has two possible outcomes (the prefix “bi” means two, or twice). For example, a coin toss has only two possible outcomes: heads or tails and taking a test could have two possible outcomes: pass or fail. When a 6-sided die is rolled, it will either land on an odd or even number. In a basketball game, a team either wins or loses. A true/false item can be answered in only two ways, true or false.
  • 7.
    Binomial Distribution Other situationscan be reduced to two outcomes. For example, a medical treatment can be classified as effective or ineffective, depending on the results. A person can be classified as having normal or abnormal blood pressure, depending on the measure of the blood pressure gauge. A multiple- choice question, even though there are four or five answer choices, can be classified as correct or incorrect. Situations like these are called binomial experiments. The outcomes of a binomial experiment and the corresponding probabilities of these outcomes are called a binomial distribution.
  • 8.
    Binomial Distribution A binomialexperiment is a probability experiment that satisfies the following four requirements: 1. There must be a fixed number of trials. 2. Each trial can have only two outcomes or outcomes that can be reduced to two outcomes. These outcomes can be considered as either success or failure. 3. The outcomes of each trial must be independent of one another. 4. The probability of a success must remain the same for each trial.
  • 9.
  • 10.
  • 11.
    Binomial Distribution Formula where, n= number of trials x = number of successes p = probability of success on an individual trial q = 1 – p = probability of failure Expected Value (mean) = np Variance = npq
  • 12.
    Binomial Distribution Problems Q1:Find the probability of getting 4 heads if the coin is tossed 5 times, find mean and variance as well. Solution: n = 5 x = 4 p = 0.5 q = 1 - 0.5 = 0.5
  • 13.
    Binomial Distribution Problems Q2:80% of people who purchased pet insurance are women. If 9 pet insurance owners are randomly selected, find the probability that exactly 6 are women. n = 9 x = 6 p = 0.8 q = 1 - 0.8 = 0.2
  • 14.
    n = 5 p= 0.5 q = 1 - 0.5 = 0.5 Binomial Distribution Problems
  • 15.
  • 16.
  • 17.
  • 18.
    Binomial Distribution Problems Q:The probability that a patient recovers from a rare blood disease is 0.4. If 15 people are known to have Contracted this disease , what is the probability that: a) At least 3 survive b) At least 10 survive c) From 3 to 8 survive d) Exactly 5 survive
  • 19.
  • 20.
  • 21.
    Hypergeometric Distribution Types ofapplication for the hypergeometric are very similar to those for the binomial distribution The hypergeometric distribution is a distribution of a variable that has two outcomes when sampling is done without replacement A hypergeometric experiment is a probability experiment that has the following requirements: 1. There are a fixed number of trials. 2. There are two outcomes, and they can be classified as success or failure. 3. The sample is selected without replacement.
  • 22.
    Hypergeometric Distribution Formula where, K= number of successes in population k = number of observed successes N = Population size n = number of trials
  • 23.
    Hypergeometric Distribution Problems Thereare 52 cards in a deck. Find the probability of getting 1 red card out of two cards drawn randomly without replacement. Solution: N = 52 n = 2 K = 26 k = 1
  • 24.
    Hypergeometric Distribution Problems Q:A deck of cards containing 20 cards, out of them, 6 are red and 14 are black cards. 5 cards are drawn Randomly without replacement. What is the probability that exactly 4 red cards are drawn ?
  • 25.
    Poisson Distribution A discreteprobability distribution that is useful when n is large and p is small and when the independent variables occur over a period of time is called the Poisson distribution. In addition to being used for the stated conditions (that is, n is large, p is small, and the variables occur over a period of time), the Poisson distribution can be used when a density of items is distributed over a given area or volume, such as the number of plants growing per acre or the number of defects in a given length of videotape. A Poisson experiment is a probability experiment that satisfies the following requirements: 1. The random variable X is the number of occurrences of an event over some interval (i.e., length, area, volume, period of time, etc.). 2. The occurrences occur randomly. 3. The occurrences are independent of one another. 4. The average number of occurrences over an interval is known.
  • 26.
    Poisson Distribution Formula where, X= occurrences in an interval of time mean number of occurrences The letter e is a constant approximately equal to 2.7183
  • 27.
  • 28.
  • 29.
  • 30.
  • 31.